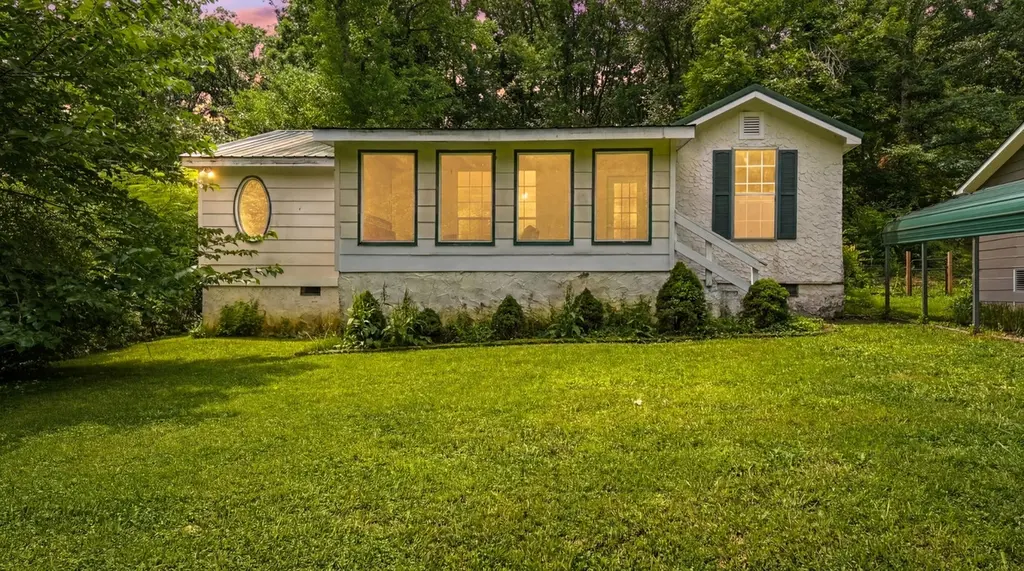
415 Hickory St · Lakeview, GA
Flood risk 1/10 · Minimal
- FEMA flood zone
- X (unshaded)
- Chance of flooding over 30 yrs
- 0.0%
- Est. flood insurance / yr
- $507 – $1,088
Fire risk 1/10 · Minimal
- Est. fire insurance / yr
- $963 – $1,789
Heat risk 5/10 · Moderate
- Hot days now (above 105°F)
- 7 days/yr
- Hot days in 30 yrs
- 19 days/yr
Wind risk 4/10 · Minor
- Chance of severe wind over 30 yrs
- 13.0%
Air-quality risk 3/10 · Minor
- Unhealthy air days now
- 2 days/yr
- Unhealthy air days in 30 yrs
- 2 days/yr
Risk factors via First Street. Map © Google.
Why this score? — see what drove the D- grade
The composite is a weighted blend of 9 inputs, each scored 0–100. Each bar is that input's sub-score; the figure is the points it added to the 100-point composite (weight × sub-score).
- ARV discount +10.6/15.0
- Cash flow +9.3/30.0
- Rent growth +4.4/5.0
- Livability +3.5/5.0
- DSCR +2.6/10.0
- Condition / age +2.5/5.0
- Schools +2.3/10.0
- 1% rule +2.0/10.0
- Appreciation +0.0/10.0
$210,000
🖨 Deal sheet 📄 Offer letter ✓ Due diligence
Listing remarks MLS
* Just minutes from Lake Winnie * Welcome to 415 Hickory St, a move in ready 3 bedroom, 2 bathroom home that offers an excellent opportunity for a first time homebuyer, downsizer, or investor. The previous owner made numerous improvements to the property, including new subfloors, new flooring, fresh interior paint, and updated bathrooms, giving the home a clean and updated feel throughout. Situated on a nice level lot with a fenced backyard and covered carport, there's plenty of space to enjoy outdoor activities, entertain guests, or simply relax at home. Conveniently located near shopping, dining, Fort Oglethorpe, and downtown Chattanooga, this property offers both comfort and convenience at an affordable price. Don't miss this opportunity before it's gone! Schedule your private showing today.
Key facts
- Covered carport
- New flooring
- Level lot
Tags
Property features AI
Finance
- Other: Lot approximately 0.35 acres (73 x 210, agent calculated); Living area reported as 1,513 square feet
Exterior
- Parking: Detached parking; 1 covered space; 1 total parking space; Carport (1 space)
- Utilities: Public water; Septic sewer; Water available
- Home design: Single family residence; Residential property; Three or more levels; Entry facing information not provided
- Construction: Metal roof; Block foundation; Other construction materials; Year built: existing
- Exterior features: Deck; Porch; Back yard fencing
Interior
- Kitchen: Refrigerator; Electric range; Eat-in kitchen
- Bedrooms: 3 bedrooms
- Flooring: Other
- Bathrooms: 2 full bathrooms
- Heating & cooling: Central heating; Central air
- Interior features: Eat-in kitchen; Refrigerator; Electric range
- Laundry & utility: Washer hookup; Electric dryer hookup
Neighborhood map
What this means for you Summary
Snapshot
- This is a 3-bed/2.0-bath single-family listed at $210k.
Deal economics
- At list price, monthly cash flow is $-152 ($-2k/yr) — negative.
- To cash-flow at today's rent, offer at most $183k (12.8% below list).
- To meet the 1% rule (rent ≥ 1% of price), the offer needs to be $147k (30.1% below list).
- Recommended offer: $147k (30.1% below list) — sets the bar for 1% rule.
Location & tenants
- Location reads 69/100 on livability (#106 in GA) — a middle-class / working-renter tenant base. Strengths: cost of living A+, housing A+, crime B; Watch: amenities F, commute F.
- Walker County (rural): math 25% / reading 29% proficiency, ranked #114 of 174 in GA (top 66%) — low school quality limits family demand, transient renter base, plan for 1-2y turnover; 61% free/reduced lunch — lower-income household profile, screen leases tightly.
- Zoned schools: Rossville Elementary School (math 22% / reading 17%, grade F, #878 of 1,228 statewide, top 75%, 416 students, 91% FRL); Ridgeland High School (math 23% / reading 19%, grade F, #225 of 424 statewide, top 54%, 1,244 students, 70% FRL) — zoned schools average 80% FRL vs 61% district-wide (19 pts higher); higher-poverty schools than district average — tighter screening recommended.
- Market conditions: Rents rising fast (+7.4%/yr); 425 active listings in the ZIP; 21 comparable units currently listed for rent nearby; rentals at typical pace (median 24d on market — plan ~3-4 weeks tenant-placement turnaround); 347 units permitted in Walker County in 2024 (24 in 5+ unit buildings).
Forward outlook
- Local home prices are declining (-3.0%/yr); year-one equity from $1k of loan paydown is wiped out by about $6k of value loss. Plan a longer hold.
- Walker County population projected at -16% by 2050 — secular population decline; favor cash flow + early exit over multi-decade hold.
Negotiation context
- Only 7 days on market — expect competitive offers; lowballing is unlikely to land.
- 11 sale attempts since 14y ago with the ask held roughly flat each time — persistent listings suggest the price (not the market) is what's stuck; bring a comps-based counter.
Risks & watch-outs
- Watch-outs: built in 1942 — expect roof / HVAC / electrical / plumbing capex.
- Climate carrying-cost: extreme-heat days projected 7→19/yr by 2055 (HVAC capex compounding) — expect insurance premiums to compound above CPI over the hold.
Questions for the listing agent
- What do current leases actually rent for vs. the listed asking? Can we see a recent rent roll and the last 12 months of T-12 income?
- Built in 1942 — when were the roof, HVAC, electrical panel, plumbing, and water heater last replaced?
- Is there a deadline driving the sale (1031 exchange, divorce, estate, relocation)? That informs how much negotiation room exists.
- Schools are F-rated, which usually means shorter tenancies and higher turnover. Who's the typical renter profile here, and what's been the actual vacancy rate?
- The area grade is low — what's the realistic commute time and amenity access for the typical tenant pool here? Any planned neighborhood developments (good or bad) we should know about?
- What's the average days-on-market for RENTAL listings here right now (not sales)? A rising rental-DOM trend means longer vacancies and softer asking-rent achievability than the comps imply.
- What's the recent tenant-quality profile in this submarket — average credit score on applications, eviction rate, late-payment / NSF rate, and stable-employment percentage? A property-management company in the area should have these aggregated.
- How much new for-sale + rental construction is in the pipeline within 1–3 miles? Heavy new supply typically softens prices + rents 12–24 months out; constrained supply supports both.
Investment metrics
- 1% rule
- 0.70% ✗
- Cap rate
- 5.42%
- Cash-on-cash
- -3.11%
- DSCR
- 0.86
- GRM
- 11.9
CMA / ARV
- ARV (on-the-fly)
- $225,500
- Comps found
- 12
Show comp detail 12 sales within ~0.75 mi
| Address | Dist | Beds/Ba | Sqft | Sold | Price | $/sf | Match |
|---|---|---|---|---|---|---|---|
| 234 Lakeview Dr | 0.12mi | 3/2.0 | 1,486 (+8%) | 4mo | $242,000 | $163 | 78 |
| 310 School St | 0.22mi | 3/2.0 | 1,235 (-10%) | 2mo | $230,000 | $186 | 71 |
| 303 Claire St | 0.40mi | 2/2.0 (-1) | 1,300 (-6%) | 7mo | $218,000 | $168 | 61 |
| 411 School St | 0.23mi | 2/1.0 (-1) | 1,200 (-13%) | 0mo | $244,999 | $204 | 58 |
| 105 N Lake Ter | 0.64mi | 3/2.0 | 1,436 (+4%) | 9mo | $249,900 | $174 | 55 |
| 3503 Land St | 0.70mi | 3/2.0 | 1,428 (+4%) | 8mo | $229,125 | $160 | 54 |
| 195 S Elmwood St | 0.51mi | 3/2.0 | 1,533 (+12%) | 4mo | $215,000 | $140 | 54 |
| 42 Warren St | 0.71mi | 3/2.0 | 1,492 (+8%) | 0mo | $245,000 | $164 | 52 |
| 268 Lawrence Dr | 0.64mi | 3/2.0 | 1,520 (+10%) | 3mo | $245,000 | $161 | 50 |
| 1906 Close Rd | 0.71mi | 3/2.0 | 1,488 (+8%) | 7mo | $230,000 | $155 | 47 |
| 243 Greens Lake Cir | 0.65mi | 2/1.0 (-1) | 1,296 (-6%) | 5mo | $228,000 | $176 | 47 |
| 385 Cross St | 0.64mi | 4/2.5 (+1) | 1,536 (+12%) | 2mo | $197,700 | $129 | 42 |
Match score weights: distance 35% · size 25% · config 20% · recency 20%. Top-matched comps best support the ARV.
Projected returns pro-forma
-3.0% appreciation · 7.44% rent growth · sell at horizon
- IRR
- -17.2%
- Equity multiple
- 0.37×
- Total profit
- $-36,937
- Equity at exit
- $31,312
- IRR
- -3.1%
- Equity multiple
- 0.76×
- Total profit
- $-14,094
- Equity at exit
- $18,157
Cash invested: $58,800 (down + closing). Projections, not guarantees.
Landlord ↔ Tenant lean methodology
- Overall (STATE)
- 90 Strongly Landlord-Friendly
- State Georgia
- 90 Strongly Landlord-Friendly · R+3
- County
- — inherits STATE
- City
- — inherits STATE
ZIP-level market 30741
- Home prices YoY
- -30.7%
- Rents YoY
- 7.4%
- Active inventory
- 425
- Price-to-rent
- 11.9×
Monthly cashflow live
- Estimated rent
- $1,468 high interval (Pro) →
- Mortgage (P&I)
- −$1,101
- Tax from tax record
- −$123 /mo · $1,475/yr
- Insurance
- −$88
- HOA
- −$0
- Vacancy / Maint / Mgmt
- −$308
- Net cashflow
- $-152
Break-even live
UW: 25.0% down · 7.5% · 30yr · 1.5% tax · 5.0% vac · 8.0% maint · 8.0% mgmt
Financing live
Cash to close
- Down payment
- $52,500
- Closing costs
- $6,300
- Reserves months
- —
- Total cash needed
- —
Loan-product check · same deal, 3 products live
Conventional
25% down · 7.5% · 30yr
- Down + closing
- —
- Monthly P&I
- —
- Monthly cashflow
- —
- DSCR
- —
- Eligible?
- —
Personal DTI + credit; lowest rate.
DSCR
20% down · 8.5% · 30yr
- Down + closing
- —
- Monthly P&I
- —
- Monthly cashflow
- —
- DSCR
- —
- Eligible?
- —
No personal income docs; deal must DSCR.
Hard money
10% down · 12.0% · 12mo
- Down + closing
- —
- Monthly P&I
- —
- Monthly cashflow
- —
- DSCR
- —
- Eligible?
- —
Short-term bridge; refi at stabilization.
Rent comps 21 comps
| Address | Beds | Baths | Sqft | Rent | $/sqft | DOM | Units | Dist |
|---|---|---|---|---|---|---|---|---|
| 819 Asterwood Dr Unit B Rossville, GA | 2.0 | 2.0 | 975 | $1,445 | $1.48 | 13d | 1 | 0.30mi |
| 1106 Carline Rd Apt B Rossville, GA | 2.0 | 1.5 | 877 | $1,095 | $1.25 | 21d | 1 | 0.45mi |
| 1106 Carline Rd Rossville, GA | 2.0 | 1.5 | 1012 | $1,095 | $1.08 | 13d | 1 | 0.45mi |
| 813 Chickamauga Ave Unit A Rossville, GA | 2.0 | 1.0 | 900 | $1,099 | $1.22 | 23d | 1 | 0.58mi |
| 132 Hogan Rd Rossville, GA | 3.0 | 2.0 | 1248 | $1,975 | $1.58 | 43d | 1 | 0.78mi |
| 135 Hogan Rd Rossville, GA | 3.0 | 2.5 | 1839 | $1,975 | $1.07 | 43d | 1 | 0.82mi |
| 1413 Mana Ln Chattanooga, TN | 2.0 | 1.0 | 990 | $1,200 | $1.21 | 23d | 1 | 0.96mi |
| 361 Hogan Rd Unit C Rossville, GA | 2.0 | 2.0 | 1210 | $1,295 | $1.07 | 43d | 1 | 0.99mi |
| 1591 Park City Rd Apt E15 Rossville, GA | 2.0 | 1.0 | 1050 | $1,145 | $1.09 | 23d | 1 | 1.03mi |
| 1408 Mana Ln East Ridge, TN | 2.0–3.0 | 1.5–2.5 | 1357 | $1,659 | $1.22 | 13d | 3 | 1.04mi |
| 61 Corley Ave Rossville, GA | 3.0 | 2.0 | 1304 | $1,823 | $1.40 | 23d | 1 | 1.17mi |
| 15 Greenway Dr Fort Oglethorpe, GA | 2.0 | 1.5 | 1150 | $1,149 | $1.00 | 43d | 2 | 1.22mi |
| 704 Corey Cir Fort Oglethorpe, GA | 2.0 | 2.0 | 1100 | $1,300 | $1.18 | 13d | 2 | 1.23mi |
| 301 Corey Cir Fort Oglethorpe, GA | 2.0 | 2.0 | 1100 | $1,300 | $1.18 | 43d | 1 | 1.24mi |
| 10 Mary Ln Rossville, GA | 3.0 | 1.5 | 1400 | $1,700 | $1.21 | 23d | 1 | 1.24mi |
| 2180 Dugan St Chattanooga, TN | 2.0 | 1.0 | 1583 | $1,295 | $0.82 | 13d | 1 | 1.34mi |
| 200A E Oak St Unit B Rossville, GA | 3.0 | 2.0 | 1200 | $1,200 | $1.00 | 13d | 1 | 1.39mi |
| 100 Biltford Ave Rossville, GA | 2.0 | 1.0 | 1100 | $1,295 | $1.18 | 13d | 1 | 1.42mi |
| 108 Biltford Ave Rossville, GA | 2.0 | 1.0 | 1100 | $1,295 | $1.18 | 23d | 1 | 1.42mi |
| 104 Foster St Rossville, GA | 3.0 | 2.0 | 1200 | $1,599 | $1.33 | 43d | 1 | 1.43mi |
| 3414 Betty Ln Chattanooga, TN | 2.0 | 1.5 | 1117 | $1,295 | $1.16 | 23d | 1 | 1.50mi |
Listing history 7 events
-
2026-06-18days on market $210,000 Active 7 DOM
-
2026-06-17days on market $210,000 Active 6 DOM
-
2026-06-16days on market $210,000 Active 5 DOM
-
2026-06-15days on market $210,000 Active 4 DOM
-
2026-06-14days on market $210,000 Active 2 DOM
-
2026-06-13remarks 699-char remark
-
2026-06-13$210,000 Active 1 DOM
ⓘ Source: listings_history table (triggers on properties + properties_extension) + one-shot
backfill from property_details.listing_events for pre-trigger history.
Tax reassessment forecast GA · Resets to sale price
- Current annual tax
- $1,475 · $123/mo
- Projected year-2 tax
- $1,932 · $161/mo
- Expected delta
- +$457/yr (+$38/mo · 31.0%)
ⓘ Screening estimate from a state-policy table — verify with the county assessor before closing.
Climate risk First Street
- Flood 1/10 Low FEMA zone X (unshaded) · 0% chance over 30 yrs
- Wildfire 1/10 Low
- Heat 5/10 Major 7 d/yr ≥105°F today · 19 d/yr by 30 yrs out
- Wind 4/10 Moderate 13% chance of damaging wind over 30 yrs
- Air quality 3/10 Moderate 2 unhealthy d/yr today · 2 by 30 yrs out
Nearby sold comps map
Loading sold comps map…
Walkable amenities ~0.75 mi
Loading nearby amenities…
Taxation est. · year 1
- Rental income
- $17,612
- − Mortgage interest
- −$11,763
- − Property taxes
- −$1,475
- − Insurance
- −$1,050
- − Repairs & maintenance
- −$1,409
- − Management
- −$1,409
- − Depreciation
- −$6,109
- Taxable loss
- −$5,603
- Est. tax savings @ 24.0%
- +$1,345
- After-tax cash flow
- $-482/yr
For passive investors: Depreciation is non-cash, so a rental often shows a tax loss while cash-flowing — sheltering income. Rental losses are passive: they offset passive income freely, and up to $25,000/yr can offset ordinary (W-2) income if you actively participate and your MAGI is under $100k (phasing out to $0 by $150k); unused losses carry forward. On sale, claimed depreciation is recaptured at up to 25%, and gains may owe capital-gains tax (a 1031 exchange can defer both). Figures are a year-1 estimate at your 24.0% rate — not tax advice; consult a CPA.
Schools (NCES district)
- District
- Walker County
- NCES district ID
- 1305370
- Math proficiency
- 25% ▼ -10.00%
- Reading proficiency
- 29% ▼ -10.00%
- Median HH income
- $39,889
- Composite
- 22.74/100
- National rank
- #8035
- State rank
- #114 of 174 in GA
Livability — Lakeview
- Score
- 69/100
- State rank
- #106
- US rank
- #8207
Category grades
Schools grade is shown separately in the Schools card above.
Census & demographics
- Census place
- Lakeview, GA
- County
- Walker County · 48,831 people
- Metro
- Chattanooga, TN-GA
- Population (ZIP)
- 30,041
- Household income
- $58,834
- Rent vs Own
- Severe rent burden
- 834.0
Population outlook (Walker County) Hauer SSP2
- Today (2025)
- 66,050 people
- By 2030
- 64,305 · -2.6%
- By 2040
- 60,127 · -9.0%
- By 2050
- 55,551 · -15.9%
- By 2075
- 44,886 · -32.0%
- By 2100
- 34,015 · -48.5%
Race, ethnicity, and origin ACS 2023
- Neighborhood character
- Predominantly White (86%)
- Race & ethnicity
- White 86% Black 5% Two or more races 5% Hispanic / Latino 5%
- Common ancestry
- Slovak 3% Iranian 2% Italian 1%
- Foreign-born
- 2% · Canada
- Languages at home
- 96% English-only · Spanish 3%
Political lean MEDSL · Walker
- 2024 margin
- Solid R (+59.3) · D 20.1% · R 79.4%
- 2008→2024 swing
- -12.5pp toward R · 2008: -46.8pp · 2024: -59.3pp
- All cycles
- 2024: R+59.3 2020: R+59.3 2016: R+61.5 2012: R+50.2 2008: R+46.8
Not yet ingested
- Civics
- —
Market trends
- HPI YoY
- ▼ -118.05%
- Current HPI
- 267.0047
- Rent YoY
- ▲ 7.44%
- Metro
- Chattanooga, TN-GA
- State GDP YoY
- ▲ 2.66%
- F500 in state
- 28
Industry mix (Fortune 500 HQ in GA)
| Industry | F500 HQs | Revenue |
|---|---|---|
| Paper / Packaging | 2 | $29B |
|
||
| Retail | 1 | $160B |
|
||
| Transportation / Logistics | 1 | $91B |
|
||
| Airlines | 1 | $62B |
|
||
| Consumer Goods | 1 | $47B |
|
||
| Utilities | 1 | $25B |
|
||
Price history
+611.9% since first listed32 events — show timeline
- 2026-06-11 Listed $210,000 REALTRACS as Distributed by MLS Grid
- 2026-06-11 Listed $210,000 GCAR
- 2026-06-10 Coming Soon $210,000 REALTRACS as Distributed by MLS Grid
- 2026-06-10 Coming Soon $210,000 GCAR
- 2025-04-10 Sold (MLS) $195,000 REALTRACS as Distributed by MLS Grid
- 2025-04-10 Sold (MLS) $195,000 GCAR
- 2025-02-14 Contingent — GCAR
- 2025-02-14 Contingent — REALTRACS as Distributed by MLS Grid
- 2025-01-21 Price Changed $205,000 GCAR
- 2025-01-21 Price Changed $205,000 REALTRACS as Distributed by MLS Grid
- 2024-12-05 Relisted — GCAR
- 2024-12-05 Relisted — REALTRACS as Distributed by MLS Grid
- 2024-12-03 Contingent — GCAR
- 2024-12-03 Contingent — REALTRACS as Distributed by MLS Grid
- 2024-11-19 Price Changed $209,000 GCAR
- 2024-11-19 Price Changed $209,000 REALTRACS as Distributed by MLS Grid
- 2024-10-30 Listed $219,900 REALTRACS as Distributed by MLS Grid
- 2024-10-20 Price Changed $219,900 GCAR
- 2024-10-12 Listed $225,000 GCAR
- 2024-05-08 Sold (Public Records) $130,000 Public Records
- 2024-04-30 Sold (MLS) $130,000 GCAR
- 2024-02-19 Contingent — GCAR
- 2024-02-19 Relisted — GCAR
- 2024-02-18 Delisted — GCAR
- 2024-02-17 Listed $169,900 GCAR
- 2022-04-13 Sold (Public Records) $107,500 Public Records
- 2022-04-07 Sold (MLS) $107,500 GCAR
- 2022-03-18 Contingent — GCAR
- 2022-03-15 Listed $107,500 GCAR
- 2012-07-18 Sold (MLS) $29,000 CCARMLS
- 2012-04-24 Listed $29,500 RCAOR
- 2012-04-09 Listed $29,500 CCARMLS
Property tax history
+8.1%/yrLatest (2025): $1,475 · +11.8% YoY. Source: county tax records.
Cash-flow waterfall
monthlySold comps — $/sqft
last 12 mo · ≤1 miLoading sold comps…