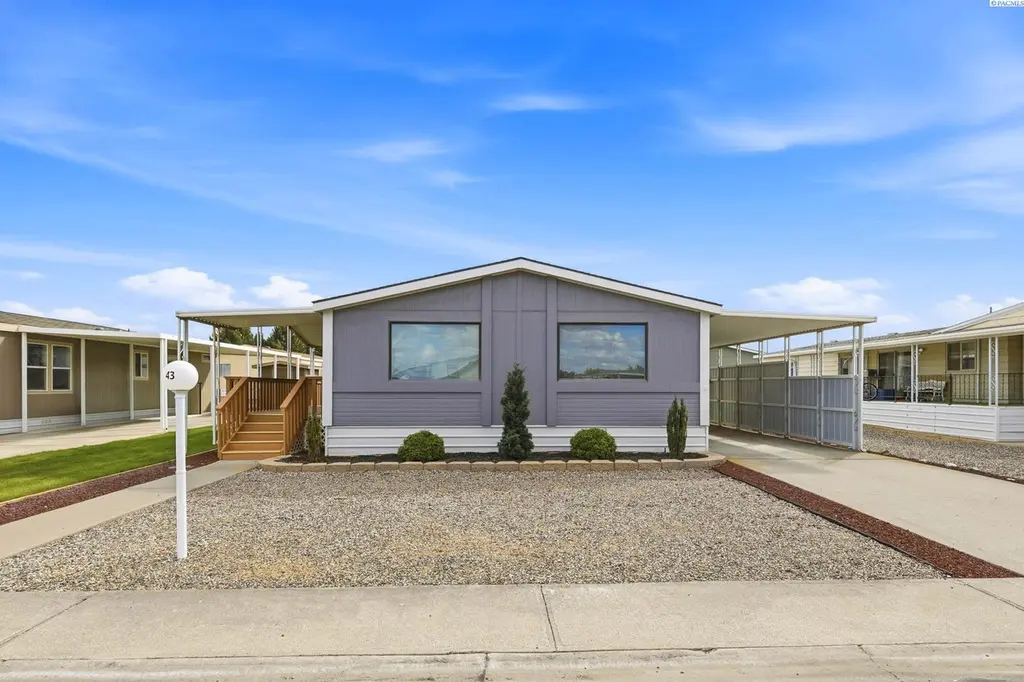
312 S Columbia Center Blvd. #43 Blvd #43 · Kennewick, WA
Flood risk 1/10 · Minimal
- FEMA flood zone
- X
- Chance of flooding over 30 yrs
- 0.0%
- Est. flood insurance / yr
- $507 – $1,088
Fire risk 4/10 · Minor
- Est. fire insurance / yr
- $604 – $1,122
Heat risk 5/10 · Moderate
- Hot days now (above 98°F)
- 7 days/yr
- Hot days in 30 yrs
- 14 days/yr
Wind risk 1/10 · Minimal
- Chance of severe wind over 30 yrs
- —
Air-quality risk 8/10 · Major
- Unhealthy air days now
- 14 days/yr
- Unhealthy air days in 30 yrs
- 15 days/yr
Risk factors via First Street. Map © Google.
Why this score? — see what drove the C+ grade
The composite is a weighted blend of 9 inputs, each scored 0–100. Each bar is that input's sub-score; the figure is the points it added to the 100-point composite (weight × sub-score).
- Cash flow +30.0/30.0
- 1% rule +10.0/10.0
- DSCR +10.0/10.0
- Schools +4.6/10.0
- Livability +3.9/5.0
- Rent growth +3.3/5.0
- Condition / age +2.5/5.0
- ARV discount +0.0/15.0
- Appreciation +0.0/10.0
$109,000
🖨 Deal sheet 📄 Offer letter ✓ Due diligence
Listing remarks
MLS# 292449 welcome to this beautifully maintained 3-bedroom, 2 bath manufactured home in a sought-after 55+ community! This move-in ready home offers a bright, open floor plan with vaulted ceilings, ceiling fans, and stylish wood laminate flooring throughout much of the home. The spacious kitchen is a standout feature, complete with abundant cabinet storage, generous counter space, and a convenient breakfast bar-perfect for everyday living and entertaining. All appliances are included, including washer and dryer, making this home turnkey. Retreat to the primary suite featuring a luxurious garden tub, separate walk-in shower, and ample space for comfort. Additional highlights include a larg
Key facts
- Covered wood deck
- Garage
- Built 1986
Tags
Property features AI
Finance
- Other: Manufactured home (rented lot)
- HOA & community: Located in a community with curbs and sidewalks; Zoned for mobile home park
Exterior
- Parking: One total parking space; One covered space; Attached garage; Carport
- Utilities: Public water; Electricity on property; Cable connected; Sewer connected; Timed underground irrigation
- Home design: Manufactured double-wide home; One level; Residential property in a mobile home park; New construction
- Construction: Concrete construction; Composition roof
- Exterior features: Deck; Shed(s); Paved road access; Curbs and sidewalks (community)
Interior
- Kitchen: Dishwasher; Disposal; Range / Oven; Refrigerator
- Flooring: Carpet; Laminate
- Bathrooms: One full bathroom; One three-quarter bathroom
- Heating & cooling: Heat pump heating; Heat pump cooling
- Interior features: Breakfast bar; Soaking tub; Vaulted ceilings; Ceiling fans; Window coverings
- Laundry & utility: Laundry room; Washer; Dryer
Neighborhood map
What this means for you Summary
Snapshot
- This is a 3-bed/2.0-bath manufactured listed at $109k.
Deal economics
- At list price, monthly cash flow is $985 ($12k/yr) — positive.
- The deal already cash-flows at list — no discount required.
- Meets the 1% rule at list price ($2k rent vs $109k).
- Recommended offer: $106k (3.0% below list) — sets the bar for market timing.
- Cap rate 17.1% vs local median 3.3% in Kennewick — top-decile yield for the area; either an underpriced asset or a hidden risk that comps aren't pricing in. Stress-test before assuming the spread holds.
Location & tenants
- Location reads 78/100 on livability (#131 in WA, #2,599 nationally) — a middle-class / working-renter tenant base. Strengths: commute A+, housing A+, health & safety A; Watch: schools D+, amenities D+, crime F.
- Kennewick School District (urban): math 43% / reading 58% proficiency, ranked #141 of 291 in WA (top 48%) — acceptable for families but not a draw, mixed tenant base, ~2y average lease.
- Market conditions: Rents rising (+3.4%/yr); 286 active listings in the ZIP; 15 comparable units currently listed for rent nearby; rentals leasing fast (median 14d on market — plan ~1-2 weeks tenant-placement turnaround); 47% of comp listings sitting > 30 days — soft ceiling on asking rent; 1,532 units permitted in Benton County in 2024 (389 in 5+ unit buildings).
- This rent runs 40% of the median local income ($63k/yr) — at the standard rent-burdened threshold; future hikes will face affordability resistance.
Forward outlook
- Local home prices are declining (-3.0%/yr); year-one equity from $754 of loan paydown is wiped out by about $3k of value loss. Plan a longer hold.
- Benton County population projected at +32% by 2050 — long-run rental-demand tailwind backs the buy-and-hold thesis.
- At projected returns (-3.0% appreciation + 3.4% rent growth), your $31k cash investment doubles in ~4 years — after that, you're playing with house money.
Negotiation context
- It's been on market 54 days — a 3% lower offer ($106k) is reasonable based on typical stale-listing flexibility.
Risks & watch-outs
- Climate carrying-cost: extreme-heat days projected 7→14/yr by 2055 (HVAC capex compounding) — expect insurance premiums to compound above CPI over the hold.
Questions for the listing agent
- It's been on market 54 days. Have you received any prior offers? Is the seller open to a 3% concession, seller financing, or rate buy-down credit?
- Is there a deadline driving the sale (1031 exchange, divorce, estate, relocation)? That informs how much negotiation room exists.
- Schools are D-rated, which usually means shorter tenancies and higher turnover. Who's the typical renter profile here, and what's been the actual vacancy rate?
- Crime grade is F in this area — have there been break-ins, vandalism, or insurance claims at this property in the last 3 years? What carrier currently insures it and at what premium?
- What's the average days-on-market for RENTAL listings here right now (not sales)? A rising rental-DOM trend means longer vacancies and softer asking-rent achievability than the comps imply.
- What's the recent tenant-quality profile in this submarket — average credit score on applications, eviction rate, late-payment / NSF rate, and stable-employment percentage? A property-management company in the area should have these aggregated.
- How much new for-sale + rental construction is in the pipeline within 1–3 miles? Heavy new supply typically softens prices + rents 12–24 months out; constrained supply supports both.
Investment metrics
- 1% rule
- 1.92% ✓
- Cap rate
- 17.14%
- Cash-on-cash
- 38.73%
- DSCR
- 2.72
- GRM
- 4.3
CMA / ARV
- ARV (median comp)
- $83,000
- List price
- $109,000
- Delta
- 31.33%
- Verdict
- OVERPRICED
- Comps
- 18 within 1.0 mi
Show comp detail 12 sales within ~0.75 mi
| Address | Dist | Beds/Ba | Sqft | Sold | Price | $/sf | Match |
|---|---|---|---|---|---|---|---|
| 312 S Columbia Center Blvd. #89 Blvd #89 | 0.11mi | 3/2.0 | 1,716 (+2%) | 3mo | $75,000 | $44 | 89 |
| 312 S Columbia Center Blvd #79 | 0.08mi | 3/2.0 | 1,809 (+8%) | 2mo | $76,000 | $42 | 82 |
| 312 S Columbia Center Blvd #90 | 0.11mi | 3/2.0 | 1,620 (-4%) | 11mo | $110,000 | $68 | 80 |
| 7901 W Clearwater Ave #108 | 0.14mi | 3/2.0 | 1,560 (-7%) | 8mo | $91,500 | $59 | 75 |
| 312 S Columbia Center Blvd #52 | 0.05mi | 3/2.0 | 1,512 (-10%) | 12mo | $65,000 | $43 | 71 |
| 312 S Columbia Center Blvd #69 | 0.05mi | 3/2.0 | 1,484 (-12%) | 9mo | $62,000 | $42 | 70 |
| 312 S Columbia Center Blvd. #95 Blvd #95 | 0.09mi | 3/2.0 | 1,440 (-14%) | 2mo | $34,250 | $24 | 70 |
| 312 S Columbia Center Blvd., #68 Blvd | 0.03mi | 3/2.0 | 1,488 (-11%) | 12mo | $142,000 | $95 | 70 |
| 312 S Columbia Center Blvd. #56 Blvd #56 | 0.03mi | 2/2.0 (-1) | 1,512 (-10%) | 11mo | $118,500 | $78 | 68 |
| 312 S Columbia Center Blvd. #72 Blvd #72 | 0.07mi | 2/2.0 (-1) | 1,456 (-13%) | 3mo | $43,000 | $30 | 67 |
| 312 S Columbia Center Blvd Unit 21 Blvd #21 | 0.08mi | 3/2.0 | 1,456 (-13%) | 11mo | $129,000 | $89 | 65 |
| 7901 W Clearwater Ave #201 | 0.25mi | 3/2.0 | 1,512 (-10%) | 12mo | $119,000 | $79 | 62 |
Match score weights: distance 35% · size 25% · config 20% · recency 20%. Top-matched comps best support the ARV.
Projected returns pro-forma
-3.0% appreciation · 3.39% rent growth · sell at horizon
- IRR
- 35.3%
- Equity multiple
- 2.50×
- Total profit
- $45,876
- Equity at exit
- $16,252
- IRR
- 42.3%
- Equity multiple
- 5.06×
- Total profit
- $124,054
- Equity at exit
- $9,424
Cash invested: $30,520 (down + closing). Projections, not guarantees.
Landlord ↔ Tenant lean methodology
- Overall (STATE)
- 28 Tenant-Leaning
- State Washington
- 28 Tenant-Leaning · D+8
- County
- — inherits STATE
- City
- — inherits STATE
ZIP-level market 99336
- Rents YoY
- 3.4%
- Active inventory
- 286
- Price-to-rent
- 4.3×
Monthly cashflow live
- Estimated rent
- $2,092 high interval (Pro) →
- Mortgage (P&I)
- −$572
- Tax from tax record
- −$51 /mo · $611/yr
- Insurance
- −$45
- HOA
- −$0
- Vacancy / Maint / Mgmt
- −$439
- Net cashflow
- $985
Break-even live
UW: 25.0% down · 7.5% · 30yr · 1.5% tax · 5.0% vac · 8.0% maint · 8.0% mgmt
Financing live
Cash to close
- Down payment
- $27,250
- Closing costs
- $3,270
- Reserves months
- —
- Total cash needed
- —
Loan-product check · same deal, 3 products live
Conventional
25% down · 7.5% · 30yr
- Down + closing
- —
- Monthly P&I
- —
- Monthly cashflow
- —
- DSCR
- —
- Eligible?
- —
Personal DTI + credit; lowest rate.
DSCR
20% down · 8.5% · 30yr
- Down + closing
- —
- Monthly P&I
- —
- Monthly cashflow
- —
- DSCR
- —
- Eligible?
- —
No personal income docs; deal must DSCR.
Hard money
10% down · 12.0% · 12mo
- Down + closing
- —
- Monthly P&I
- —
- Monthly cashflow
- —
- DSCR
- —
- Eligible?
- —
Short-term bridge; refi at stabilization.
Rent comps 15 comps
| Address | Beds | Baths | Sqft | Rent | $/sqft | DOM | Units | Dist |
|---|---|---|---|---|---|---|---|---|
| 7803 W Deschutes Ave Kennewick, WA | 1.0–3.0 | 1.0–2.0 | 925 | $2,010 | $2.17 | 13d | 13 | 0.32mi |
| 8180 W 4th Ave Kennewick, WA | 2.0–3.0 | 2.0 | 1202 | $2,299 | $1.91 | 13d | 4 | 0.33mi |
| 7960 W 10th Ave Kennewick, WA | 1.0–2.0 | 1.0–2.0 | 946 | $2,345 | $2.48 | 13d | 9 | 0.56mi |
| 7968 W 10th Ave Kennewick, WA | 1.0–3.0 | 1.0–2.0 | 951 | $2,200 | $2.31 | 13d | 10 | 0.58mi |
| 24 S Quay St Unit 3 Kennewick, WA | 3.0 | 1.5 | 1128 | $1,625 | $1.44 | 13d | 1 | 0.81mi |
| 8831 W Entiat Ave Kennewick, WA | 3.0 | 2.0 | 1232 | $1,995 | $1.62 | 43d | 1 | 0.89mi |
| 725 N Center Pkwy Kennewick, WA | 1.0–3.0 | 1.0–2.0 | 1086 | $2,195 | $2.02 | 13d | 9 | 0.94mi |
| 1080 N Montana St Kennewick, WA | 3.0 | 2.0 | 1842 | $2,600 | $1.41 | 43d | 1 | 1.02mi |
| 867 S Zeelar St Kennewick, WA | 4.0 | 2.5 | 1968 | $2,495 | $1.27 | 43d | 1 | 1.26mi |
| 883 S Zeelar St Kennewick, WA | 3.0 | 2.5 | 1735 | $2,395 | $1.38 | 43d | 1 | 1.26mi |
| 33 N Jefferson Pl Unit 110 Kennewick, WA | 3.0 | 2.5 | 1536 | $1,950 | $1.27 | 43d | 1 | 1.32mi |
| 5702 W Kennewick Pl #110 Kennewick, WA | 3.0 | 2.5 | 1435 | $1,695 | $1.18 | 13d | 1 | 1.38mi |
| 100 N Irving Pl Kennewick, WA | 1.0–3.0 | 1.0–1.5 | 939 | $1,750 | $1.86 | 13d | 11 | 1.44mi |
| 100 N Irving Pl Unit K101 Kennewick, WA | 3.0 | 1.5 | 1120 | $1,700 | $1.52 | 44d | 1 | 1.45mi |
| 100 N Irving Pl Unit H101 Kennewick, WA | 3.0 | 1.5 | 1120 | $1,699 | $1.52 | 44d | 1 | 1.45mi |
Listing history 17 events
-
2026-06-18days on market $109,000 Active 54 DOM
-
2026-06-17days on market $109,000 Active 53 DOM
-
2026-06-16days on market $109,000 Active 52 DOM
-
2026-06-15days on market $109,000 Active 51 DOM
-
2026-06-14days on market $109,000 Active 49 DOM
-
2026-06-13days on market $109,000 Active 48 DOM
-
2026-06-10days on market $109,000 Active 46 DOM
-
2026-06-09days on market $109,000 Active 45 DOM
-
2026-06-08days on market $109,000 Active 44 DOM
-
2026-06-07days on market $109,000 Active 43 DOM
-
2026-06-05days on market $109,000 Active 40 DOM
-
2026-06-03days on market $109,000 Active 39 DOM
-
2026-06-02days on market $109,000 Active 38 DOM
-
2026-06-01days on market $109,000 Active 37 DOM
-
2026-05-31days on market $109,000 Active 36 DOM
-
2026-05-30days on market $109,000 Active 35 DOM
-
2026-04-25$109,000 Active 1128-char remark
ⓘ Source: listings_history table (triggers on properties + properties_extension) + one-shot
backfill from property_details.listing_events for pre-trigger history.
Tax reassessment forecast WA · Resets to sale price
- Current annual tax
- $611 · $51/mo
- Projected year-2 tax
- $1,068 · $89/mo
- Expected delta
- +$457/yr (+$38/mo · 74.8%)
ⓘ Screening estimate from a state-policy table — verify with the county assessor before closing.
Climate risk First Street
- Flood 1/10 Low FEMA zone X · 0% chance over 30 yrs
- Wildfire 4/10 Moderate
- Heat 5/10 Major 7 d/yr ≥98°F today · 14 d/yr by 30 yrs out
- Wind 1/10 Low
- Air quality 8/10 Severe 14 unhealthy d/yr today · 15 by 30 yrs out
Nearby sold comps map
Loading sold comps map…
Walkable amenities ~0.75 mi
Loading nearby amenities…
Taxation est. · year 1
- Rental income
- $25,108
- − Mortgage interest
- −$6,106
- − Property taxes
- −$611
- − Insurance
- −$545
- − Repairs & maintenance
- −$2,009
- − Management
- −$2,009
- − Depreciation
- −$3,171
- Taxable income
- $10,658
- Est. tax owed @ 24.0%
- −$2,558
- After-tax cash flow
- $9,262/yr
For passive investors: Depreciation is non-cash, so a rental often shows a tax loss while cash-flowing — sheltering income. Rental losses are passive: they offset passive income freely, and up to $25,000/yr can offset ordinary (W-2) income if you actively participate and your MAGI is under $100k (phasing out to $0 by $150k); unused losses carry forward. On sale, claimed depreciation is recaptured at up to 25%, and gains may owe capital-gains tax (a 1031 exchange can defer both). Figures are a year-1 estimate at your 24.0% rate — not tax advice; consult a CPA.
Schools (NCES district)
- District
- Kennewick School District
- NCES district ID
- 5303930
- Math proficiency
- 43% ▼ -1.00%
- Reading proficiency
- 58% ▬ 0.00%
- Median HH income
- $54,191
- Composite
- 45.56/100
- National rank
- #5667
- State rank
- #141 of 291 in WA
Livability — Kennewick
- Score
- 78/100
- State rank
- #131
- US rank
- #2599
Category grades
Schools grade is shown separately in the Schools card above.
Census & demographics
- Census place
- Kennewick, WA
- County
- Benton County · 186,895 people
- City population
- 104,655
- Metro
- Kennewick-Richland, WA
- Population (ZIP)
- 50,735
- Household income
- $62,527
- Rent vs Own
- Severe rent burden
- 2605.0
Population outlook (Benton County) Hauer SSP2
- Today (2025)
- 219,421 people
- By 2030
- 233,813 · +6.6%
- By 2040
- 262,134 · +19.5%
- By 2050
- 290,100 · +32.2%
- By 2075
- 363,525 · +65.7%
- By 2100
- 418,667 · +90.8%
Race, ethnicity, and origin ACS 2023
- Neighborhood character
- Diverse neighborhood (Simpson 0.56)
- Race & ethnicity
- White 55% Hispanic / Latino 37% Two or more races 15% Black 3% Asian 2% Native American 1%
- Hispanic origin (detail)
- Mexican 31% Cuban 2%
- Common ancestry
- Portuguese 4% Slovak 3% Romanian 1%
- Foreign-born
- 16% · Canada, Jamaica
- Languages at home
- 68% English-only · Spanish 29% Arabic 1%
Political lean MEDSL · Benton
- 2024 margin
- Strong R (+21.9) · D 37.7% · R 59.6% · Other 2.7%
- 2008→2024 swing
- +4.2pp toward D · 2008: -26.1pp · 2024: -21.9pp
- All cycles
- 2024: R+21.9 2020: R+21.0 2016: R+26.6 2012: R+27.0 2008: R+26.1
Not yet ingested
- Civics
- —
Market trends
- HPI YoY
- ▼ -408.26%
- Current HPI
- 256.1143
- Rent YoY
- ▲ 3.39%
- Metro
- Kennewick-Richland, WA
- State GDP YoY
- ▲ 4.65%
- F500 in state
- 22
Industry mix (Fortune 500 HQ in WA)
| Industry | F500 HQs | Revenue |
|---|---|---|
| Retail | 2 | $269B |
|
||
| Technology / Retail | 1 | $638B |
|
||
| Technology | 1 | $245B |
|
||
| Telecommunications | 1 | $38B |
|
||
| Food / Beverage | 1 | $36B |
|
||
| Automotive / Trucks | 1 | $34B |
|
||
Price history
1 event — show timeline
- 2026-04-25 Listed $109,000 PACMLS
Property tax history
+54.4%/yrLatest (2026): $611 · -5.7% YoY. Source: county tax records.
Cash-flow waterfall
monthlySold comps — $/sqft
last 12 mo · ≤1 miLoading sold comps…