563 S 12th Ave · Piggott, AR
Flood risk 8/10 · Major
- FEMA flood zone
- X (unshaded)
- Chance of flooding over 30 yrs
- 0.99%
- Est. flood insurance / yr
- $507 – $1,088
Fire risk 2/10 · Minimal
- Est. fire insurance / yr
- $1,499 – $2,785
Heat risk 5/10 · Moderate
- Hot days now (above 109°F)
- 7 days/yr
- Hot days in 30 yrs
- 20 days/yr
Wind risk 4/10 · Minor
- Chance of severe wind over 30 yrs
- 7.0%
Air-quality risk 2/10 · Minimal
- Unhealthy air days now
- 0 days/yr
- Unhealthy air days in 30 yrs
- 1 days/yr
Risk factors via First Street. Map © Google.
Why this score? — see what drove the B- grade
The composite is a weighted blend of 9 inputs, each scored 0–100. Each bar is that input's sub-score; the figure is the points it added to the 100-point composite (weight × sub-score).
- Cash flow +21.7/30.0
- ARV discount +14.8/15.0
- Appreciation +10.0/10.0
- DSCR +6.9/10.0
- 1% rule +4.7/10.0
- Livability +3.5/5.0
- Rent growth +2.5/5.0
- Schools +2.5/10.0
- Condition / age +2.5/5.0
$102,000
🖨 Deal sheet 📄 Offer letter ✓ Due diligence
Listing remarks MLS
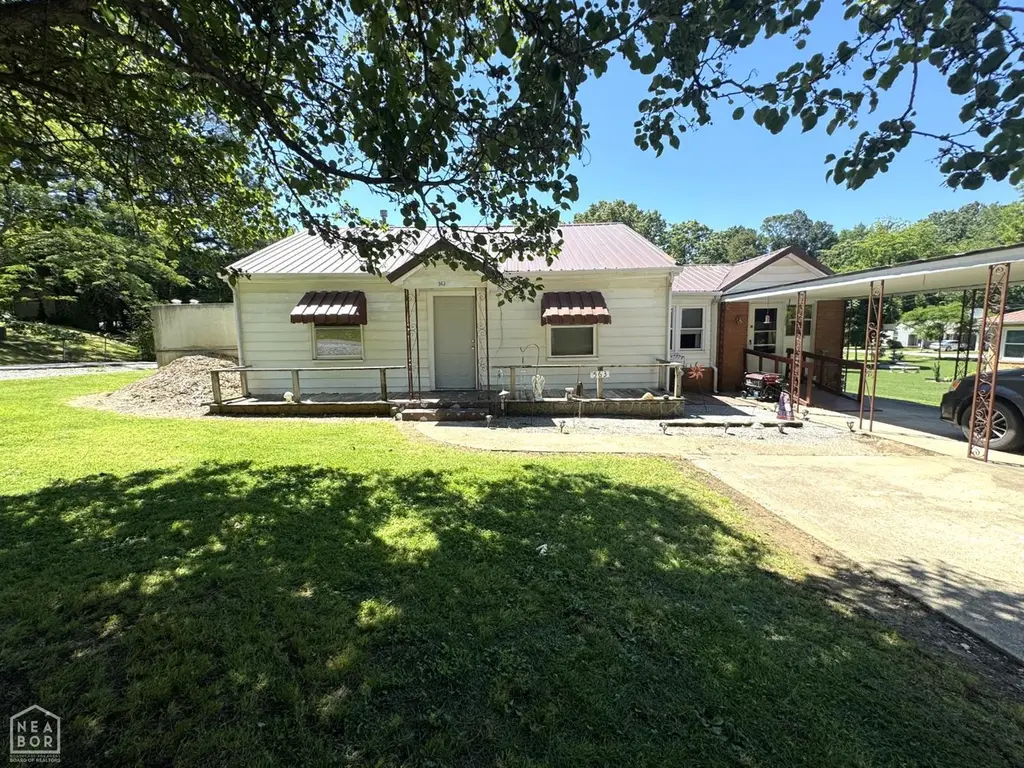
Welcome to 563 S. 12th Ave. in Piggott, AR 72454. This 1,390 sq ft home offers 3 bedrooms 2 bathrooms, and includes as spacious family room, eat-in kitchen, central heat and air, and updated double-hung windows throughout. Enjoy the oversized enclosed sunroom-perfect for enjoying your morning coffee year-round. This property is situated on a . 38 acre corner lot with an outbuilding for storage, and a walk-in storm shelter with interior entrance. This property provides both convenience and peace of mind. Whether you are looking for your first home, downsizing, or searching for a great investment opportunity, this property has much to offer. Schedule your private showing today!
Key facts
- Eat-in kitchen
- Corner lot
- Spacious family room
Tags
Property features AI
Finance
- Other: Internet service available via fiber; Insulated windows
- Financial info: Financing available: conventional loan or cash
Exterior
- Parking: Carport for 1 car
- Utilities: Public sewer; Public water; Municipal electric service (Entergy); Natural gas
- Home design: Brick and metal/vinyl siding exterior; Level corner lot; Inside city limits; Not in a subdivision
- Construction: Crawl space foundation; Metal roof
- Exterior features: Patio; Partially fenced yard; Outside storage area; Guttering; Storm cellar; Chain link; Wheelchair accessible
Interior
- Kitchen: Free-standing stove; Gas range; Dishwasher; Refrigerator included; Ice maker connection
- Flooring: Carpet; Vinyl; Laminate
- Bathrooms: 2 full bathrooms
- Heating & cooling: Central electric cooling; Attic fan; Central gas heat; Floor/wall furnace
- Interior features: Washer connection; Electric dryer connection; Gas water heater; Smoke detectors; Window treatments; Floored attic; Ceiling fans; Walk-in shower; Breakfast bar; Formica kitchen counters
- Laundry & utility: Washer connection; Electric dryer connection
Neighborhood map
What this means for you Summary
Snapshot
- This is a 3-bed/2.0-bath single-family listed at $102k.
Deal economics
- At list price, monthly cash flow is $90 ($1k/yr) — positive.
- The deal already cash-flows at list — no discount required.
- To meet the 1% rule (rent ≥ 1% of price), the offer needs to be $99k (3.3% below list).
- Recommended offer: $99k (3.3% below list) — sets the bar for 1% rule.
Location & tenants
- Location reads 70/100 on livability (#50 in AR) — a middle-class / working-renter tenant base. Strengths: crime A+, cost of living A+, housing A+; Watch: amenities F, commute F, employment F.
- Piggott School District (town): math 32% / reading 28% proficiency, ranked #157 of 238 in AR (top 66%) — families likely to look elsewhere, expect single-tenant / working-renter base with shorter leases.
- Zoned schools: Piggott Elementary School (math 42% / reading 30%, grade F, #248 of 454 statewide, top 55%, 488 students, 65% FRL); Piggott High School (math 22% / reading 26%, grade F, #206 of 292 statewide, top 71%, 361 students, 49% FRL).
- Market conditions: 71 active listings in the ZIP; 4 units permitted in Clay County in 2024 (0 in 5+ unit buildings).
Forward outlook
- In year one you build about $11k of equity ($705 loan paydown + $10k appreciation (10.0% local appreciation)).
- Clay County population projected at -24% by 2050 — secular population decline; favor cash flow + early exit over multi-decade hold.
- At projected returns (10.0% appreciation + 3.0% rent growth), your $29k cash investment doubles in ~3 years — after that, you're playing with house money.
- By year 4, paydown + projected appreciation supports a ~$39k cash-out refi (75% LTV) — recoverable capital for the next deal without selling this one.
Negotiation context
- It's been on market 43 days — a 3% lower offer ($99k) is reasonable based on typical stale-listing flexibility.
- 2 sale attempts with the ask held roughly flat each time — persistent listings suggest the price (not the market) is what's stuck; bring a comps-based counter.
- Current owner paid $42k; list at $102k implies a 143% gain — meaningful room to come down on a strong offer.
Risks & watch-outs
- Watch-outs: flood insurance adds $66/mo; built in 1955 — expect roof / HVAC / electrical / plumbing capex.
- Climate carrying-cost: severe flood risk; extreme-heat days projected 7→20/yr by 2055 (HVAC capex compounding) — expect insurance premiums to compound above CPI over the hold.
Questions for the listing agent
- It's been on market 43 days. Have you received any prior offers? Is the seller open to a 3% concession, seller financing, or rate buy-down credit?
- Built in 1955 — when were the roof, HVAC, electrical panel, plumbing, and water heater last replaced?
- What's the actual annual flood-insurance premium (NFIP or private), and is the property in a SFHA with mandatory coverage?
- Is there a deadline driving the sale (1031 exchange, divorce, estate, relocation)? That informs how much negotiation room exists.
- Schools are F-rated, which usually means shorter tenancies and higher turnover. Who's the typical renter profile here, and what's been the actual vacancy rate?
- What's the average days-on-market for RENTAL listings here right now (not sales)? A rising rental-DOM trend means longer vacancies and softer asking-rent achievability than the comps imply.
- What's the recent tenant-quality profile in this submarket — average credit score on applications, eviction rate, late-payment / NSF rate, and stable-employment percentage? A property-management company in the area should have these aggregated.
- How much new for-sale + rental construction is in the pipeline within 1–3 miles? Heavy new supply typically softens prices + rents 12–24 months out; constrained supply supports both.
Investment metrics
- 1% rule
- 0.97% ✗
- Cap rate
- 8.13%
- Cash-on-cash
- 6.57%
- DSCR
- 1.29
- GRM
- 8.6
CMA / ARV
- ARV (median comp)
- $121,804
- List price
- $102,000
- Delta
- -16.26%
- Verdict
- UNDERPRICED
- Comps
- 20 within 1.0 mi
Show comp detail 12 sales within ~0.75 mi
| Address | Dist | Beds/Ba | Sqft | Sold | Price | $/sf | Match |
|---|---|---|---|---|---|---|---|
| 690 Redwood Dr | 0.07mi | 4/2.0 (+1) | 1,375 (-1%) | 4mo | $159,000 | $116 | 87 |
| 1120 Frisco Ln | 0.06mi | 3/2.0 | 1,286 (-8%) | 2mo | $152,000 | $118 | 83 |
| 560 S 14th Ave | 0.10mi | 3/2.0 | 1,311 (-6%) | 11mo | $261,500 | $199 | 77 |
| 560 S 14th Ave | 0.11mi | 3/2.0 | 1,311 (-6%) | 11mo | $261,500 | $199 | 77 |
| 1391 Wiley Dr | 0.22mi | 3/2.0 | 1,440 (+4%) | 10mo | $40,000 | $28 | 76 |
| 1344 Wallain Dr | 0.08mi | 3/1.0 | 1,232 (-11%) | 1mo | $75,000 | $61 | 72 |
| 1075 W Clay | 0.21mi | 3/2.0 | 1,536 (+10%) | 2mo | $69,900 | $46 | 71 |
| 420 N 12th Ave | 0.51mi | 3/2.0 | 1,344 (-3%) | 1mo | $166,500 | $124 | 70 |
| 162 S 10th Ave | 0.31mi | 3/2.0 | 1,507 (+8%) | 4mo | $52,700 | $35 | 68 |
| 677 Crestline Dr | 0.24mi | 2/1.0 (-1) | 1,308 (-6%) | 3mo | $69,500 | $53 | 67 |
| 1610 S 12th Ave | 0.65mi | 3/1.5 | 1,382 (-1%) | 10mo | $155,000 | $112 | 58 |
| 787 W Main St | 0.43mi | 2/2.0 (-1) | 1,236 (-11%) | 6mo | $95,000 | $77 | 51 |
Match score weights: distance 35% · size 25% · config 20% · recency 20%. Top-matched comps best support the ARV.
Projected returns pro-forma
10.0% appreciation · 3.0% rent growth · sell at horizon
- IRR
- 27.0%
- Equity multiple
- 3.15×
- Total profit
- $61,278
- Equity at exit
- $91,890
- IRR
- 23.6%
- Equity multiple
- 7.16×
- Total profit
- $175,965
- Equity at exit
- $198,164
Cash invested: $28,560 (down + closing). Projections, not guarantees.
Landlord ↔ Tenant lean methodology
- Overall (STATE)
- 92 Strongly Landlord-Friendly
- State Arkansas
- 92 Strongly Landlord-Friendly · R+14
- County
- — inherits STATE
- City
- — inherits STATE
ZIP-level market 72454
- Home prices YoY
- 3.4%
- Active inventory
- 71
- Price-to-rent
- 8.6×
Monthly cashflow live
- Estimated rent
- $986 medium interval (Pro) →
- Mortgage (P&I)
- −$535
- Tax from tax record
- −$46 /mo · $547/yr
- Insurance
- −$42
- Flood insurance flood zone
- −$66 /mo · $798/yr
- HOA
- −$0
- Vacancy / Maint / Mgmt
- −$207
- Net cashflow
- $90
Break-even live
UW: 25.0% down · 7.5% · 30yr · 1.5% tax · 5.0% vac · 8.0% maint · 8.0% mgmt
Financing live
Cash to close
- Down payment
- $25,500
- Closing costs
- $3,060
- Reserves months
- —
- Total cash needed
- —
Loan-product check · same deal, 3 products live
Conventional
25% down · 7.5% · 30yr
- Down + closing
- —
- Monthly P&I
- —
- Monthly cashflow
- —
- DSCR
- —
- Eligible?
- —
Personal DTI + credit; lowest rate.
DSCR
20% down · 8.5% · 30yr
- Down + closing
- —
- Monthly P&I
- —
- Monthly cashflow
- —
- DSCR
- —
- Eligible?
- —
No personal income docs; deal must DSCR.
Hard money
10% down · 12.0% · 12mo
- Down + closing
- —
- Monthly P&I
- —
- Monthly cashflow
- —
- DSCR
- —
- Eligible?
- —
Short-term bridge; refi at stabilization.
Listing history 19 events
-
2026-06-19days on market $102,000 Active 43 DOM
-
2026-06-18days on market $102,000 Active 42 DOM
-
2026-06-17days on market $102,000 Active 41 DOM
-
2026-06-16days on market $102,000 Active 40 DOM
-
2026-06-15days on market $102,000 Active 39 DOM
-
2026-06-14days on market $102,000 Active 37 DOM
-
2026-06-12days on market $102,000 Active 36 DOM
-
2026-06-09days on market $102,000 Active 33 DOM
-
2026-06-08days on market $102,000 Active 32 DOM
-
2026-06-07days on market $102,000 Active 31 DOM
-
2026-06-05days on market $102,000 Active 29 DOM
-
2026-06-04days on market $102,000 Active 27 DOM
-
2026-06-02days on market $102,000 Active 26 DOM
-
2026-06-01days on market $102,000 Active 25 DOM
-
2026-05-31days on market $102,000 Active 24 DOM
-
2026-05-31days on market $102,000 Active 23 DOM
-
2026-05-07$102,000 New Listing 684-char remark
Show marketing remark (684 chars)
Welcome to 563 S. 12th Ave. in Piggott, AR 72454. This 1,390 sq ft home offers 3 bedrooms 2 bathrooms, and includes as spacious family room, eat-in kitchen, central heat and air, and updated double-hung windows throughout. Enjoy the oversized enclosed sunroom-perfect for enjoying your morning coffee year-round. This property is situated on a . 38 acre corner lot with an outbuilding for storage, and a walk-in storm shelter with interior entrance. This property provides both convenience and peace of mind. Whether you are looking for your first home, downsizing, or searching for a great investment opportunity, this property has much to offer. Schedule your private showing today!
-
2026-05-07$102,000 Active 684-char remark
Show marketing remark (684 chars)
Welcome to 563 S. 12th Ave. in Piggott, AR 72454. This 1,390 sq ft home offers 3 bedrooms 2 bathrooms, and includes as spacious family room, eat-in kitchen, central heat and air, and updated double-hung windows throughout. Enjoy the oversized enclosed sunroom-perfect for enjoying your morning coffee year-round. This property is situated on a . 38 acre corner lot with an outbuilding for storage, and a walk-in storm shelter with interior entrance. This property provides both convenience and peace of mind. Whether you are looking for your first home, downsizing, or searching for a great investment opportunity, this property has much to offer. Schedule your private showing today!
-
1996-08-01soldstatus $42,000
ⓘ Source: listings_history table (triggers on properties + properties_extension) + one-shot
backfill from property_details.listing_events for pre-trigger history.
Tax reassessment forecast AR · Resets to sale price
- Current annual tax
- $547 · $46/mo
- Projected year-2 tax
- $653 · $54/mo
- Expected delta
- +$106/yr (+$9/mo · 19.3%)
ⓘ Screening estimate from a state-policy table — verify with the county assessor before closing.
Climate risk First Street
- Flood 8/10 Severe FEMA zone X (unshaded) · 99% chance over 30 yrs
- Wildfire 2/10 Low
- Heat 5/10 Major 7 d/yr ≥109°F today · 20 d/yr by 30 yrs out
- Wind 4/10 Moderate 7% chance of damaging wind over 30 yrs
- Air quality 2/10 Low 0 unhealthy d/yr today · 1 by 30 yrs out
Nearby sold comps map
Loading sold comps map…
Walkable amenities ~0.75 mi
Loading nearby amenities…
Taxation est. · year 1
- Rental income
- $11,837
- − Mortgage interest
- −$5,714
- − Property taxes
- −$547
- − Insurance
- −$1,308
- − Repairs & maintenance
- −$947
- − Management
- −$947
- − Depreciation
- −$2,967
- Taxable loss
- −$592
- Est. tax savings @ 24.0%
- +$142
- After-tax cash flow
- $1,220/yr
For passive investors: Depreciation is non-cash, so a rental often shows a tax loss while cash-flowing — sheltering income. Rental losses are passive: they offset passive income freely, and up to $25,000/yr can offset ordinary (W-2) income if you actively participate and your MAGI is under $100k (phasing out to $0 by $150k); unused losses carry forward. On sale, claimed depreciation is recaptured at up to 25%, and gains may owe capital-gains tax (a 1031 exchange can defer both). Figures are a year-1 estimate at your 24.0% rate — not tax advice; consult a CPA.
Schools (NCES district)
- District
- Piggott School District
- NCES district ID
- 0511370
- Math proficiency
- 32% ▼ -15.00%
- Reading proficiency
- 28% ▼ -10.00%
- Median HH income
- $33,336
- Composite
- 24.63/100
- National rank
- #7628
- State rank
- #157 of 238 in AR
Livability — Piggott
- Score
- 70/100
- State rank
- #50
- US rank
- #7358
Category grades
Schools grade is shown separately in the Schools card above.
Census & demographics
- Census place
- Piggott, AR
- Population (ZIP)
- 4,699
Population outlook (Clay County) Hauer SSP2
- Today (2025)
- 13,564 people
- By 2030
- 12,834 · -5.4%
- By 2040
- 11,498 · -15.2%
- By 2050
- 10,325 · -23.9%
- By 2075
- 8,228 · -39.3%
- By 2100
- 6,675 · -50.8%
Race, ethnicity, and origin ACS 2023
- Neighborhood character
- Predominantly White (94%)
- Race & ethnicity
- White 94% Two or more races 5% Hispanic / Latino 2%
- Common ancestry
- Slovak 1% Serbian 1% Italian 1%
- Foreign-born
- 1%
- Languages at home
- 99% English-only · German/W. Germanic 1%
Political lean MEDSL · Clay
- 2024 margin
- Solid R (+61.6) · D 18.3% · R 79.9% · Other 1.9%
- 2008→2024 swing
- -47.3pp toward R · 2008: -14.3pp · 2024: -61.6pp
- All cycles
- 2024: R+61.6 2020: R+60.3 2016: R+29.8 2012: R+29.1 2008: R+14.3
Not yet ingested
- Civics
- —
Market trends
- HPI YoY
- ▲ 11.57%
- Current HPI
- 355.7877
- Rent YoY
- —
- Metro
- —
- State GDP YoY
- ▲ 3.80%
- F500 in state
- 10
Industry mix (Fortune 500 HQ in AR)
| Industry | F500 HQs | Revenue |
|---|---|---|
| Retail | 1 | $681B |
|
||
| Food / Agriculture | 1 | $53B |
|
||
| Retail / Energy | 1 | $22B |
|
||
| Transportation / Logistics | 1 | $12B |
|
||
| Energy | 1 | $4B |
|
||
Price history
+142.9% since first listed3 events — show timeline
- 2026-05-07 Listed $102,000 NEABOR MLS
- 2026-05-07 Listed $102,000 CARMLS
- 1996-08-01 Sold (Public Records) $42,000 Public Records
Property tax history
+12.2%/yrLatest (2025): $547 · +0.0% YoY. Source: county tax records.
Cash-flow waterfall
monthlySold comps — $/sqft
last 12 mo · ≤1 miLoading sold comps…