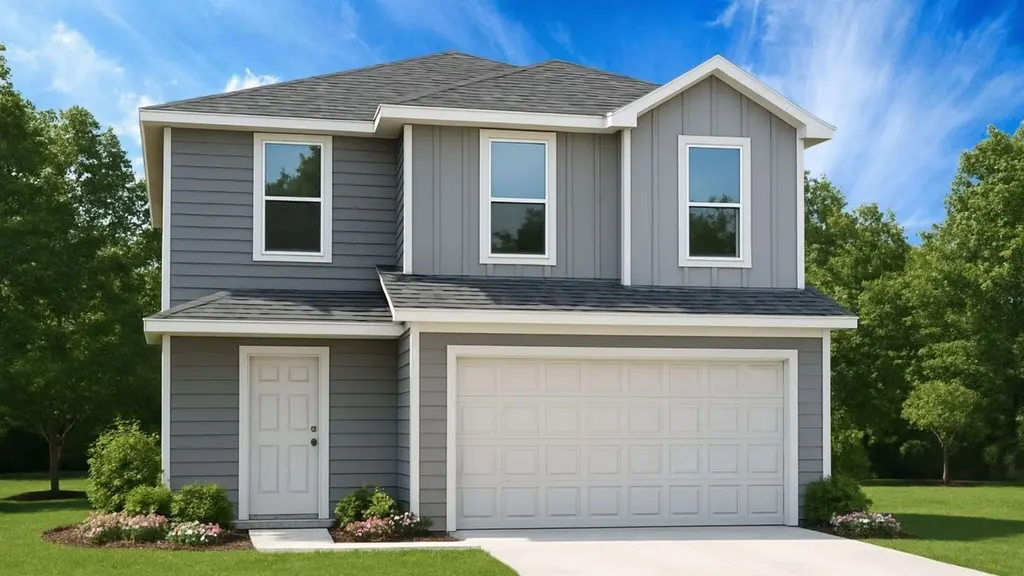
22846 Primrose Wind Ln · Houston, TX
Flood risk 1/10 · Minimal
- FEMA flood zone
- X (unshaded)
- Chance of flooding over 30 yrs
- 0.0%
- Est. flood insurance / yr
- $507 – $1,088
Fire risk 5/10 · Moderate
- Est. fire insurance / yr
- $1,222 – $2,270
Heat risk 8/10 · Major
- Hot days now (above 112°F)
- 7 days/yr
- Hot days in 30 yrs
- 20 days/yr
Wind risk 8/10 · Major
- Chance of severe wind over 30 yrs
- 99.0%
Air-quality risk 2/10 · Minimal
- Unhealthy air days now
- 1 days/yr
- Unhealthy air days in 30 yrs
- 1 days/yr
Risk factors via First Street. Map © Google.
Why this score? — see what drove the C- grade
The composite is a weighted blend of 9 inputs, each scored 0–100. Each bar is that input's sub-score; the figure is the points it added to the 100-point composite (weight × sub-score).
- Cash flow +19.8/30.0
- ARV discount +8.4/15.0
- DSCR +6.3/10.0
- 1% rule +5.3/10.0
- Condition / age +4.2/5.0
- Livability +3.7/5.0
- Schools +2.9/10.0
- Rent growth +2.1/5.0
- Appreciation +0.0/10.0
$275,990
🖨 Deal sheet 📄 Offer letter ✓ Due diligence
Listing remarks
Welcome to the Franklin Plan, located in Sunset Valley. This new home layout offers 2 classic front exteriors, 5 bedrooms, 2.5 baths, 2 car-garage and 1891 square feet of comfortable living. Step inside The Franklin to find an elongated foyer opening to an open concept living room, kitchen, and dining area. The gourmet kitchen faces the living area so you don't miss a thing while cooking and includes quartz counter tops, stainless steel appliances and shaker style cabinetry. The main bedroom is located toward the front of the home on the second story and features an attractive attached bathroom with a walk-in shower, quartz countertops, a grand walk-in closet and plenty of storage space. Th
Key facts
- Attached bathroom
- Gourmet kitchen
- Quartz counter tops
Tags
Property features AI
Finance
- Financial info: List price $285,990
Exterior
- Parking: 2 covered garage spaces (2 parking spaces total)
- Home design: Single-family home; New construction (Spec) — Franklin plan
- Exterior features: Living area of 1892 (listed)
Interior
- Bedrooms: 5 bedrooms
- Bathrooms: 2 full bathrooms, 1 half bathroom (2.5 total)
- Interior features: Spec-built Franklin plan
Neighborhood map
What this means for you Summary
Snapshot
- This is a 5-bed/2.5-bath single-family listed at $276k. Condition is rated good.
Deal economics
- At list price, monthly cash flow is $330 ($4k/yr) — positive.
- The deal already cash-flows at list — no discount required.
- Meets the 1% rule at list price ($3k rent vs $276k).
- Recommended offer: $268k (3.0% below list) — sets the bar for market timing.
- Cap rate 7.7% vs local median 3.2% in Houston — top-decile yield for the area; either an underpriced asset or a hidden risk that comps aren't pricing in. Stress-test before assuming the spread holds.
Location & tenants
- Location reads 74/100 on livability (#184 in TX, #4,771 nationally) — a middle-class / working-renter tenant base. Strengths: amenities A+, cost of living A+, housing A+; Watch: schools D, crime F.
- Waller ISD (rural): math 30% / reading 35% proficiency, ranked #532 of 826 in TX (top 64%) — families likely to look elsewhere, expect single-tenant / working-renter base with shorter leases.
- Market conditions: Rents soft (-1.6%/yr); 1782 active listings in the ZIP; 3 comparable units currently listed for rent nearby; rentals at typical pace (median 22d on market — plan ~3-4 weeks tenant-placement turnaround); high-income renter base; 29,883 units permitted in Harris County in 2024 (8,621 in 5+ unit buildings).
Forward outlook
- Local home prices are declining (-3.0%/yr); year-one equity from $2k of loan paydown is wiped out by about $8k of value loss. Plan a longer hold.
- Harris County population projected at +47% by 2050 — long-run rental-demand tailwind backs the buy-and-hold thesis.
Negotiation context
- It's been on market 43 days — a 3% lower offer ($268k) is reasonable based on typical stale-listing flexibility.
Risks & watch-outs
- Climate carrying-cost: severe wind risk, 99% chance of damaging wind over 30y; moderate wildfire risk; extreme-heat days projected 7→20/yr by 2055 (HVAC capex compounding) — expect insurance premiums to compound above CPI over the hold.
Questions for the listing agent
- It's been on market 43 days. Have you received any prior offers? Is the seller open to a 3% concession, seller financing, or rate buy-down credit?
- Is there a deadline driving the sale (1031 exchange, divorce, estate, relocation)? That informs how much negotiation room exists.
- Schools are D-rated, which usually means shorter tenancies and higher turnover. Who's the typical renter profile here, and what's been the actual vacancy rate?
- Crime grade is F in this area — have there been break-ins, vandalism, or insurance claims at this property in the last 3 years? What carrier currently insures it and at what premium?
- What's the average days-on-market for RENTAL listings here right now (not sales)? A rising rental-DOM trend means longer vacancies and softer asking-rent achievability than the comps imply.
- What's the recent tenant-quality profile in this submarket — average credit score on applications, eviction rate, late-payment / NSF rate, and stable-employment percentage? A property-management company in the area should have these aggregated.
- How much new for-sale + rental construction is in the pipeline within 1–3 miles? Heavy new supply typically softens prices + rents 12–24 months out; constrained supply supports both.
Investment metrics
- 1% rule
- 1.03% ✓
- Cap rate
- 7.73%
- Cash-on-cash
- 5.12%
- DSCR
- 1.23
- GRM
- 8.1
CMA / ARV
- ARV (median comp)
- $281,878
- List price
- $275,990
- Delta
- -2.09%
- Verdict
- FAIR
- Comps
- 20 within 1.0 mi
Show comp detail 10 sales within ~0.75 mi
| Address | Dist | Beds/Ba | Sqft | Sold | Price | $/sf | Match |
|---|---|---|---|---|---|---|---|
| 18719 Hawthorn Stem Dr | 0.20mi | 5/2.5 | 1,892 (0%) | 3mo | $281,990 | $149 | 88 |
| 18703 Hawthorn Stem Dr | 0.23mi | 5/2.5 | 1,892 (0%) | 3mo | $281,990 | $149 | 87 |
| 18706 Sunset Horizon Dr | 0.28mi | 5/2.5 | 1,892 (0%) | 4mo | $285,990 | $151 | 84 |
| 18622 Sunset Horizon Dr | 0.29mi | 5/2.5 | 1,892 (0%) | 5mo | $290,890 | $154 | 82 |
| 22703 Sundown Shadows Dr | 0.42mi | 5/2.5 | 1,892 (0%) | 5mo | $283,990 | $150 | 76 |
| 22711 Sundown Shadows Dr | 0.46mi | 5/2.5 | 1,892 (0%) | 3mo | $285,000 | $151 | 76 |
| 22723 Sundown Shadows Dr | 0.54mi | 5/2.5 | 1,892 (0%) | 8mo | $286,990 | $152 | 69 |
| 18726 Buttercup Farms Ln | 0.74mi | 4/3.0 (-1) | 1,942 (+3%) | 3mo | $350,900 | $181 | 52 |
| 18719 Buttercup Farms Ln | 0.71mi | 4/3.0 (-1) | 2,129 (+12%) | 1mo | $429,990 | $202 | 38 |
| 18707 Buttercup Farms Ln | 0.72mi | 4/3.0 (-1) | 2,169 (+15%) | 2mo | $379,900 | $175 | 34 |
Match score weights: distance 35% · size 25% · config 20% · recency 20%. Top-matched comps best support the ARV.
Projected returns pro-forma
-3.0% appreciation · 0.0% rent growth · sell at horizon
- IRR
- -11.8%
- Equity multiple
- 0.59×
- Total profit
- $-31,976
- Equity at exit
- $41,151
- IRR
- -7.8%
- Equity multiple
- 0.58×
- Total profit
- $-32,698
- Equity at exit
- $23,863
Cash invested: $77,277 (down + closing). Projections, not guarantees.
Landlord ↔ Tenant lean methodology
- Overall (STATE)
- 87 Strongly Landlord-Friendly
- State Texas
- 87 Strongly Landlord-Friendly · R+5
- County
- — inherits STATE
- City
- — inherits STATE
ZIP-level market 77447
- Home prices YoY
- -31.1%
- Rents YoY
- -1.6%
- Active inventory
- 1782
- Price-to-rent
- 8.1×
Monthly cashflow live
- Estimated rent
- $2,832 medium interval (Pro) →
- Mortgage (P&I)
- −$1,447
- Tax est. 1.5%
- −$345 /mo · $4,140/yr
- Insurance
- −$115
- HOA
- −$0
- Vacancy / Maint / Mgmt
- −$595
- Net cashflow
- $330
Break-even live
UW: 25.0% down · 7.5% · 30yr · 1.5% tax · 5.0% vac · 8.0% maint · 8.0% mgmt
Financing live
Cash to close
- Down payment
- $68,998
- Closing costs
- $8,280
- Reserves months
- —
- Total cash needed
- —
Loan-product check · same deal, 3 products live
Conventional
25% down · 7.5% · 30yr
- Down + closing
- —
- Monthly P&I
- —
- Monthly cashflow
- —
- DSCR
- —
- Eligible?
- —
Personal DTI + credit; lowest rate.
DSCR
20% down · 8.5% · 30yr
- Down + closing
- —
- Monthly P&I
- —
- Monthly cashflow
- —
- DSCR
- —
- Eligible?
- —
No personal income docs; deal must DSCR.
Hard money
10% down · 12.0% · 12mo
- Down + closing
- —
- Monthly P&I
- —
- Monthly cashflow
- —
- DSCR
- —
- Eligible?
- —
Short-term bridge; refi at stabilization.
Rent comps 3 comps
| Address | Beds | Baths | Sqft | Rent | $/sqft | DOM | Units | Dist |
|---|---|---|---|---|---|---|---|---|
| 22222 Opa Glen Dr Hockley, TX | 4.0 | 3.0 | 2609 | $2,850 | $1.09 | 43d | 1 | 1.07mi |
| 20313 Evergreen Cypress Dr Hockley, TX | 2.0–5.0 | 2.0–3.5 | 2051 | $3,070 | $1.50 | 1d | 1 | 1.26mi |
| 18927 Jasper Ridge Dr Hockley, TX | 4.0 | 2.5 | 1851 | $1,895 | $1.02 | 21d | 1 | 1.34mi |
Listing history 14 events
-
2026-06-18days on market $275,990 Active 43 DOM
-
2026-06-17days on market $275,990 Active 42 DOM
-
2026-06-16days on market $275,990 Active 41 DOM
-
2026-06-15days on market $275,990 Active 40 DOM
-
2026-06-13days on market $275,990 Active 38 DOM
-
2026-06-09days on market $275,990 Active 34 DOM
-
2026-06-08days on market $275,990 Active 33 DOM
-
2026-06-07days on market $275,990 Active 32 DOM
-
2026-06-04days on market $275,990 Active 29 DOM
-
2026-06-03days on market $275,990 Active 28 DOM
-
2026-06-02days on market $275,990 Active 27 DOM
-
2026-06-01days on market $275,990 Active 26 DOM
-
2026-05-31days on market $275,990 Active 25 DOM
-
2026-05-06$285,990 Active 1311-char remark
ⓘ Source: listings_history table (triggers on properties + properties_extension) + one-shot
backfill from property_details.listing_events for pre-trigger history.
Climate risk First Street
- Flood 1/10 Low FEMA zone X (unshaded) · 0% chance over 30 yrs
- Wildfire 5/10 Major
- Heat 8/10 Severe 7 d/yr ≥112°F today · 20 d/yr by 30 yrs out
- Wind 8/10 Severe 99% chance of damaging wind over 30 yrs
- Air quality 2/10 Low 1 unhealthy d/yr today · 1 by 30 yrs out
Nearby sold comps map
Loading sold comps map…
Walkable amenities ~0.75 mi
Loading nearby amenities…
Taxation est. · year 1
- Rental income
- $33,981
- − Mortgage interest
- −$15,460
- − Property taxes
- −$4,140
- − Insurance
- −$1,380
- − Repairs & maintenance
- −$2,718
- − Management
- −$2,718
- − Depreciation
- −$8,029
- Taxable loss
- −$465
- Est. tax savings @ 24.0%
- +$112
- After-tax cash flow
- $4,069/yr
For passive investors: Depreciation is non-cash, so a rental often shows a tax loss while cash-flowing — sheltering income. Rental losses are passive: they offset passive income freely, and up to $25,000/yr can offset ordinary (W-2) income if you actively participate and your MAGI is under $100k (phasing out to $0 by $150k); unused losses carry forward. On sale, claimed depreciation is recaptured at up to 25%, and gains may owe capital-gains tax (a 1031 exchange can defer both). Figures are a year-1 estimate at your 24.0% rate — not tax advice; consult a CPA.
Condition & rehab AI · 30 photos
This new construction home is move-in ready with excellent condition and minimal repairs needed. It offers a spacious layout with high-end finishes and ample natural light, making it an attractive option for both resale and rental markets.
Value-add opportunities
- Both Painting exterior and interior walls — Enhances curb appeal and interior aesthetics
- Both Reorganizing furniture in living room — Optimizes space and improves flow
- Both Adding smart home features — Enhances comfort and energy efficiency
Renovation cost estimate screening
Value-add ROI direction
- Both Painting exterior and interior walls — Enhances curb appeal and interior aesthetics ↑
- Both Reorganizing furniture in living room — Optimizes space and improves flow ↑
- Both Adding smart home features — Enhances comfort and energy efficiency ↑
ⓘ Cost ranges are severity-bucket heuristics (US national rule-of-thumb). Get contractor quotes + a written scope before underwriting a rehab budget.
Schools (NCES district)
- District
- Waller ISD
- NCES district ID
- 4844430
- Math proficiency
- 30% ▼ -23.00%
- Reading proficiency
- 35% ▼ -11.00%
- Median HH income
- $58,911
- Composite
- 29.12/100
- National rank
- #6593
- State rank
- #532 of 826 in TX
Livability — Houston
- Score
- 74/100
- State rank
- #184
- US rank
- #4771
Category grades
Schools grade is shown separately in the Schools card above.
Census & demographics
- County
- Harris County · 4,702,590 people
- City population
- 3,226,434
- Metro
- Houston-The Woodlands-Sugar Land, TX
- Population (ZIP)
- 25,231
- Household income
- $116,925
- Rent vs Own
- Severe rent burden
- 265.0
Population outlook (Harris County) Hauer SSP2
- Today (2025)
- 5,571,493 people
- By 2030
- 6,089,821 · +9.3%
- By 2040
- 7,142,806 · +28.2%
- By 2050
- 8,185,864 · +46.9%
- By 2075
- 10,574,329 · +89.8%
- By 2100
- 12,109,958 · +117.4%
Race, ethnicity, and origin ACS 2023
- Neighborhood character
- Diverse neighborhood (Simpson 0.63)
- Race & ethnicity
- White 44% Hispanic / Latino 41% Two or more races 16% Black 9% Asian 1%
- Hispanic origin (detail)
- Mexican 27%
- Common ancestry
- Lithuanian 3% Slovak 1% Romanian 1%
- Foreign-born
- 15% · Canada, Jamaica, Dominican Republic
- Languages at home
- 69% English-only · Spanish 28% Other Indo-European 1% Vietnamese 1%
Political lean MEDSL · Harris
- 2024 margin
- Lean D (+5.5) · D 52.0% · R 46.4% · Other 1.6%
- 2008→2024 swing
- +3.9pp toward D · 2008: 1.6pp · 2024: 5.5pp
- All cycles
- 2024: D+5.5 2020: D+13.3 2016: D+12.4 2012: D+0.1 2008: D+1.6
Not yet ingested
- Civics
- —
Market trends
- HPI YoY
- ▼ -112.73%
- Current HPI
- 249.6969
- Rent YoY
- ▼ -1.58%
- Metro
- Houston-The Woodlands-Sugar Land, TX
- State GDP YoY
- ▲ 3.95%
- F500 in state
- 110
Industry mix (Fortune 500 HQ in TX)
| Industry | F500 HQs | Revenue |
|---|---|---|
| Energy | 16 | $1,198B |
|
||
| Technology | 5 | $198B |
|
||
| Engineering / Construction | 4 | $72B |
|
||
| Energy Services | 3 | $60B |
|
||
| Utilities | 3 | $41B |
|
||
| Healthcare | 2 | $330B |
|
||
Cash-flow waterfall
monthlySold comps — $/sqft
last 12 mo · ≤1 miLoading sold comps…