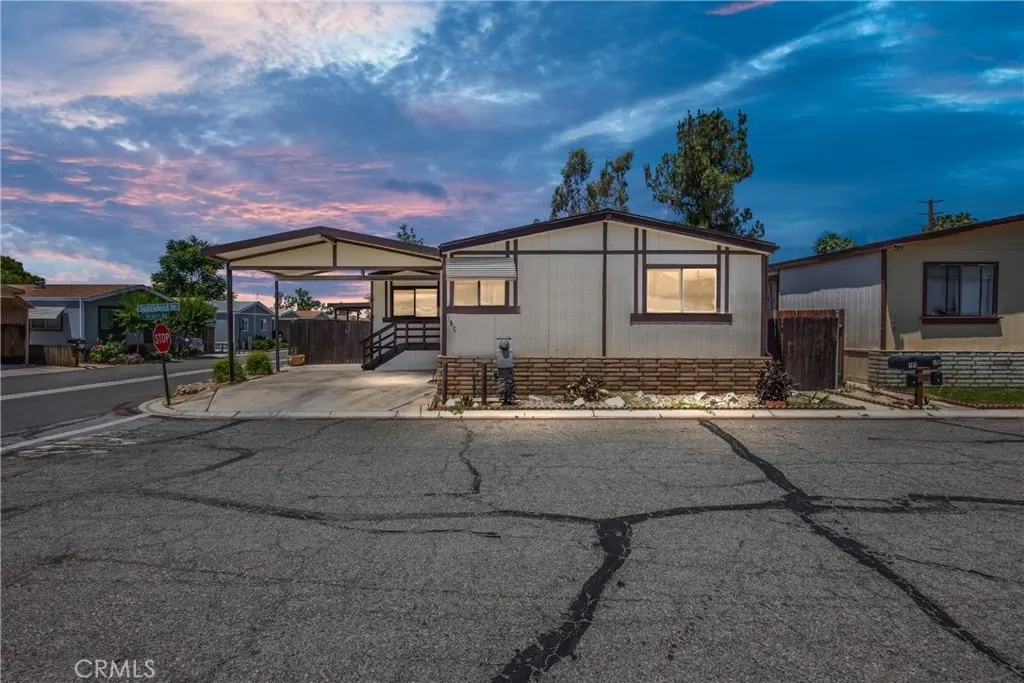
7717 Church #160 · Highland, CA
Flood risk 1/10 · Minimal
- FEMA flood zone
- X
- Chance of flooding over 30 yrs
- 0.0%
- Est. flood insurance / yr
- $507 – $1,088
Fire risk 8/10 · Major
- Est. fire insurance / yr
- $659 – $1,223
Heat risk 8/10 · Major
- Hot days now (above 101°F)
- 6 days/yr
- Hot days in 30 yrs
- 19 days/yr
Wind risk 1/10 · Minimal
- Chance of severe wind over 30 yrs
- —
Air-quality risk 10/10 · Severe
- Unhealthy air days now
- 29 days/yr
- Unhealthy air days in 30 yrs
- 35 days/yr
Risk factors via First Street. Map © Google.
Why this score? — see what drove the B+ grade
The composite is a weighted blend of 9 inputs, each scored 0–100. Each bar is that input's sub-score; the figure is the points it added to the 100-point composite (weight × sub-score).
- Cash flow +30.0/30.0
- ARV discount +13.4/15.0
- 1% rule +10.0/10.0
- DSCR +10.0/10.0
- Rent growth +3.2/5.0
- Schools +3.1/10.0
- Livability +3.0/5.0
- Condition / age +2.5/5.0
- Appreciation +0.0/10.0
$165,000
🖨 Deal sheet 📄 Offer letter ✓ Due diligence
Listing remarks MLS
Welcome to this charming manufactured home located in the desirable Highlands Mobile Home Park Community. This spacious 3-bedroom, 2-bathroom home offers approximately 1,704 sqft of comfortable living space. The large living room creates an inviting atmosphere for gatherings and relaxation. The spacious kitchen features bar seating and an eat-in area, perfect for family meals and entertaining. The home also includes a convenient laundry room and has a generously sized backyard, ideal for outdoor activities and gardening. Calling all buyers—bring your imagination and make this lovely space your own! The community offers fantastic amenities including a clubhouse, exercise room, pool, and spa, providing plenty of opportunities for leisure and socializing. Don’t miss the chance to enjoy the vibrant lifestyle in Highlands Mobile Home Park!
Key facts
- 1,704 sq ft lot
- Community pool
- Built 1985
Neighborhood map
What this means for you Summary
Snapshot
- This is a 3-bed/2.0-bath manufactured listed at $165k.
Deal economics
- At list price, monthly cash flow is $1k ($13k/yr) — positive.
- The deal already cash-flows at list — no discount required.
- Meets the 1% rule at list price ($3k rent vs $165k).
- Recommended offer: $155k (6.0% below list) — sets the bar for market timing.
- Cap rate 14.3% vs local median 2.9% in Highland — top-decile yield for the area; either an underpriced asset or a hidden risk that comps aren't pricing in. Stress-test before assuming the spread holds.
Location & tenants
- Location reads 59/100 on livability (#618 in CA) — a working-class tenant base; expect higher turnover. Strengths: housing A-; Watch: schools C-, commute D+, crime D-.
- San Bernardino City Unified (urban): math 27% / reading 40% proficiency, ranked #959 of 1,400 in CA (top 68%) — families likely to look elsewhere, expect single-tenant / working-renter base with shorter leases; 81% free/reduced lunch — lower-income household profile, screen leases tightly.
- Market conditions: Rents rising (+2.9%/yr); 147 active listings in the ZIP; 12 comparable units currently listed for rent nearby; rentals at typical pace (median 24d on market — plan ~3-4 weeks tenant-placement turnaround); solid renter incomes; 5,458 units permitted in San Bernardino County in 2024 (1,500 in 5+ unit buildings).
- This rent runs 40% of the median local income ($85k/yr) — at the standard rent-burdened threshold; future hikes will face affordability resistance.
Forward outlook
- Local home prices are declining (-3.0%/yr); year-one equity from $1k of loan paydown is wiped out by about $5k of value loss. Plan a longer hold.
- San Bernardino County population projected at +15% by 2050 — modest demand growth; plan on rents tracking national, not racing it.
- At projected returns (-3.0% appreciation + 2.9% rent growth), your $46k cash investment doubles in ~5 years — after that, you're playing with house money.
Negotiation context
- It's been on market 61 days — a 6% lower offer ($155k) is reasonable based on typical stale-listing flexibility.
- 3 sale attempts with the ask held roughly flat each time — persistent listings suggest the price (not the market) is what's stuck; bring a comps-based counter.
Risks & watch-outs
- Climate carrying-cost: severe wildfire risk; extreme-heat days projected 6→19/yr by 2055 (HVAC capex compounding) — expect insurance premiums to compound above CPI over the hold.
Questions for the listing agent
- It's been on market 61 days. Have you received any prior offers? Is the seller open to a 6% concession, seller financing, or rate buy-down credit?
- Why hasn't it sold? Are there any deal-killer items the seller is aware of (foundation, flood, title, zoning, code violations)?
- Is there a deadline driving the sale (1031 exchange, divorce, estate, relocation)? That informs how much negotiation room exists.
- Crime grade is D in this area — have there been break-ins, vandalism, or insurance claims at this property in the last 3 years? What carrier currently insures it and at what premium?
- What's the average days-on-market for RENTAL listings here right now (not sales)? A rising rental-DOM trend means longer vacancies and softer asking-rent achievability than the comps imply.
- What's the recent tenant-quality profile in this submarket — average credit score on applications, eviction rate, late-payment / NSF rate, and stable-employment percentage? A property-management company in the area should have these aggregated.
- How much new for-sale + rental construction is in the pipeline within 1–3 miles? Heavy new supply typically softens prices + rents 12–24 months out; constrained supply supports both.
Investment metrics
- 1% rule
- 1.71% ✓
- Cap rate
- 14.26%
- Cash-on-cash
- 28.44%
- DSCR
- 2.27
- GRM
- 4.9
CMA / ARV
- ARV (median comp)
- $190,000
- List price
- $165,000
- Delta
- -13.16%
- Verdict
- UNDERPRICED
- Comps
- 7 within 1.0 mi
Show comp detail 3 sales within ~0.75 mi
| Address | Dist | Beds/Ba | Sqft | Sold | Price | $/sf | Match |
|---|---|---|---|---|---|---|---|
| 7717 Church #31 | 0.00mi | 3/2.0 | 1,792 (+5%) | 1mo | $220,000 | $123 | 91 |
| 7717 CHURCH Ave #214 | 0.00mi | 4/2.0 (+1) | 1,848 (+8%) | 1mo | $190,000 | $103 | 80 |
| 7717 Church Ave #142 | 0.00mi | 3/2.0 | 1,488 (-13%) | 6mo | $185,000 | $124 | 74 |
Match score weights: distance 35% · size 25% · config 20% · recency 20%. Top-matched comps best support the ARV.
Projected returns pro-forma
-3.0% appreciation · 2.91% rent growth · sell at horizon
- IRR
- 22.6%
- Equity multiple
- 1.93×
- Total profit
- $42,795
- Equity at exit
- $24,602
- IRR
- 30.6%
- Equity multiple
- 3.73×
- Total profit
- $126,199
- Equity at exit
- $14,266
Cash invested: $46,200 (down + closing). Projections, not guarantees.
Landlord ↔ Tenant lean methodology
- Overall (STATE)
- 18 Strongly Tenant-Friendly
- State California
- 18 Strongly Tenant-Friendly · D+13
- County
- — inherits STATE
- City
- — inherits STATE
ZIP-level market 92346
- Rents YoY
- 2.9%
- Active inventory
- 147
- Price-to-rent
- 4.9×
Monthly cashflow live
- Estimated rent
- $2,830 high interval (Pro) →
- Mortgage (P&I)
- −$865
- Tax est. 1.5%
- −$206 /mo · $2,475/yr
- Insurance
- −$69
- HOA
- −$0
- Vacancy / Maint / Mgmt
- −$594
- Net cashflow
- $1,095
Break-even live
UW: 25.0% down · 7.5% · 30yr · 1.5% tax · 5.0% vac · 8.0% maint · 8.0% mgmt
Financing live
Cash to close
- Down payment
- $41,250
- Closing costs
- $4,950
- Reserves months
- —
- Total cash needed
- —
Loan-product check · same deal, 3 products live
Conventional
25% down · 7.5% · 30yr
- Down + closing
- —
- Monthly P&I
- —
- Monthly cashflow
- —
- DSCR
- —
- Eligible?
- —
Personal DTI + credit; lowest rate.
DSCR
20% down · 8.5% · 30yr
- Down + closing
- —
- Monthly P&I
- —
- Monthly cashflow
- —
- DSCR
- —
- Eligible?
- —
No personal income docs; deal must DSCR.
Hard money
10% down · 12.0% · 12mo
- Down + closing
- —
- Monthly P&I
- —
- Monthly cashflow
- —
- DSCR
- —
- Eligible?
- —
Short-term bridge; refi at stabilization.
Rent comps 12 comps
| Address | Beds | Baths | Sqft | Rent | $/sqft | DOM | Units | Dist |
|---|---|---|---|---|---|---|---|---|
| 27531 Temple St Highland, CA | 3.0 | 2.0 | 1144 | $2,650 | $2.32 | 10d | 1 | 0.17mi |
| 7448 Yellow Jasmine Dr Highland, CA | 4.0 | 2.0 | 1694 | $3,200 | $1.89 | 5d | 1 | 0.85mi |
| 7565 Webster St Highland, CA | 3.0 | 2.0 | 1568 | $2,950 | $1.88 | 24d | 1 | 0.89mi |
| 7925 Midhurst Dr Highland, CA | 3.0 | 1.5 | 1326 | $2,450 | $1.85 | 24d | 1 | 0.98mi |
| 7938 Sunflower St Highland, CA | 3.0 | 2.5 | 1856 | $3,000 | $1.62 | 2d | 1 | 1.01mi |
| 7767 Colwyn Ave Highland, CA | 3.0 | 1.5 | 1107 | $2,500 | $2.26 | 24d | 1 | 1.03mi |
| 7219 Seville Ave Highland, CA | 3.0 | 2.0 | 1843 | $3,000 | $1.63 | 24d | 1 | 1.10mi |
| 7219 Seville Ave Highland, CA | 3.0 | 2.0 | 1843 | $3,000 | $1.63 | 43d | 1 | 1.10mi |
| 7257 Wakefield Ct Highland, CA | 3.0 | 2.0 | 1183 | $2,395 | $2.02 | 24d | 1 | 1.14mi |
| 28561 Foxboro Ln Highland, CA | 4.0 | 2.5 | 1437 | $3,150 | $2.19 | 18d | 1 | 1.21mi |
| 3931 Atlantic Ave Highland, CA | 4.0 | 2.5 | 2131 | $3,890 | $1.83 | 10d | 1 | 1.23mi |
| 26814 Mansfield St Highland, CA | 3.0 | 1.0 | 1275 | $2,850 | $2.24 | 43d | 1 | 1.39mi |
Listing history 9 events
-
2026-06-01days on market $165,000 Active 61 DOM
-
2026-05-31days on market $165,000 Active 60 DOM
-
2026-04-01$165,000 Active 858-char remark
Show marketing remark (858 chars)
Welcome to this charming manufactured home located in the desirable Highlands Mobile Home Park Community. This spacious 3-bedroom, 2-bathroom home offers approximately 1,704 sqft of comfortable living space. The large living room creates an inviting atmosphere for gatherings and relaxation. The spacious kitchen features bar seating and an eat-in area, perfect for family meals and entertaining. The home also includes a convenient laundry room and has a generously sized backyard, ideal for outdoor activities and gardening. Calling all buyers—bring your imagination and make this lovely space your own! The community offers fantastic amenities including a clubhouse, exercise room, pool, and spa, providing plenty of opportunities for leisure and socializing. Don’t miss the chance to enjoy the vibrant lifestyle in Highlands Mobile Home Park!
-
2026-03-26historical $165,000 858-char remark
Show marketing remark (858 chars)
Welcome to this charming manufactured home located in the desirable Highlands Mobile Home Park Community. This spacious 3-bedroom, 2-bathroom home offers approximately 1,704 sqft of comfortable living space. The large living room creates an inviting atmosphere for gatherings and relaxation. The spacious kitchen features bar seating and an eat-in area, perfect for family meals and entertaining. The home also includes a convenient laundry room and has a generously sized backyard, ideal for outdoor activities and gardening. Calling all buyers—bring your imagination and make this lovely space your own! The community offers fantastic amenities including a clubhouse, exercise room, pool, and spa, providing plenty of opportunities for leisure and socializing. Don’t miss the chance to enjoy the vibrant lifestyle in Highlands Mobile Home Park!
-
2025-12-31historical
-
2025-11-05status Active
-
2025-09-07status Pending Sale
-
2025-07-01price $165,000
-
2025-06-13$170,000 Active
ⓘ Source: listings_history table (triggers on properties + properties_extension) + one-shot
backfill from property_details.listing_events for pre-trigger history.
Climate risk First Street
- Flood 1/10 Low FEMA zone X · 0% chance over 30 yrs
- Wildfire 8/10 Severe
- Heat 8/10 Severe 6 d/yr ≥101°F today · 19 d/yr by 30 yrs out
- Wind 1/10 Low
- Air quality 10/10 Extreme 29 unhealthy d/yr today · 35 by 30 yrs out
Nearby sold comps map
Loading sold comps map…
Walkable amenities ~0.75 mi
Loading nearby amenities…
Taxation est. · year 1
- Rental income
- $33,955
- − Mortgage interest
- −$9,243
- − Property taxes
- −$2,475
- − Insurance
- −$825
- − Repairs & maintenance
- −$2,716
- − Management
- −$2,716
- − Depreciation
- −$4,800
- Taxable income
- $11,179
- Est. tax owed @ 24.0%
- −$2,683
- After-tax cash flow
- $10,458/yr
For passive investors: Depreciation is non-cash, so a rental often shows a tax loss while cash-flowing — sheltering income. Rental losses are passive: they offset passive income freely, and up to $25,000/yr can offset ordinary (W-2) income if you actively participate and your MAGI is under $100k (phasing out to $0 by $150k); unused losses carry forward. On sale, claimed depreciation is recaptured at up to 25%, and gains may owe capital-gains tax (a 1031 exchange can defer both). Figures are a year-1 estimate at your 24.0% rate — not tax advice; consult a CPA.
Schools (NCES district)
- District
- San Bernardino City Unified
- NCES district ID
- 0634170
- Math proficiency
- 27% ▲ 1.00%
- Reading proficiency
- 40% ▬ 0.00%
- Median HH income
- $39,758
- Composite
- 30.8/100
- National rank
- #11385
- State rank
- #959 of 1400 in CA
Livability — Highland
- Score
- 59/100
- State rank
- #618
- US rank
- #19608
Category grades
Schools grade is shown separately in the Schools card above.
Census & demographics
- Census place
- Highland, CA
- County
- San Bernardino County · 2,030,291 people
- City population
- 56,179
- Metro
- Riverside-San Bernardino-Ontario, CA
- Population (ZIP)
- 56,179
- Household income
- $85,163
- Rent vs Own
- Severe rent burden
- 1816.0
Population outlook (San Bernardino County) Hauer SSP2
- Today (2025)
- 2,300,329 people
- By 2030
- 2,378,907 · +3.4%
- By 2040
- 2,523,137 · +9.7%
- By 2050
- 2,642,388 · +14.9%
- By 2075
- 2,880,769 · +25.2%
- By 2100
- 2,909,436 · +26.5%
Race, ethnicity, and origin ACS 2023
- Neighborhood character
- Diverse neighborhood (Simpson 0.63)
- Race & ethnicity
- Hispanic / Latino 53% White 26% Two or more races 14% Black 8% Asian 8% Native American 1%
- Hispanic origin (detail)
- Mexican 46%
- Common ancestry
- Italian 1% Iranian 1% Lithuanian 1%
- Foreign-born
- 19% · Canada, Vietnam, South Korea
- Languages at home
- 60% English-only · Spanish 32% Vietnamese 2% Tagalog/Filipino 2%
Political lean MEDSL · San Bernardino
- 2024 margin
- Toss-up / Even · D 47.5% · R 49.7% · Other 2.8%
- 2008→2024 swing
- -8.5pp toward R · 2008: 6.3pp · 2024: -2.1pp
- All cycles
- 2024: R+2.1 2020: D+10.7 2016: D+9.8 2012: D+5.4 2008: D+6.3
Not yet ingested
- Civics
- —
Market trends
- HPI YoY
- ▼ -328.00%
- Current HPI
- 367.2829
- Rent YoY
- ▲ 2.91%
- Metro
- Riverside-San Bernardino-Ontario, CA
- State GDP YoY
- ▲ 3.21%
- F500 in state
- 116
Industry mix (Fortune 500 HQ in CA)
| Industry | F500 HQs | Revenue |
|---|---|---|
| Technology | 27 | $1,492B |
|
||
| Financial Services | 3 | $174B |
|
||
| Retail | 3 | $44B |
|
||
| Insurance | 3 | $26B |
|
||
| Media / Entertainment | 2 | $115B |
|
||
| Pharmaceuticals / Biotech | 2 | $62B |
|
||
Price history
-2.9% since first listed7 events — show timeline
- 2026-04-01 Listed $165,000 CRMLS
- 2026-03-26 Coming Soon $165,000 CRMLS
- 2025-12-31 Listing Removed — CRMLS
- 2025-11-05 Relisted — CRMLS
- 2025-09-07 Pending — CRMLS
- 2025-07-01 Price Changed $165,000 CRMLS
- 2025-06-13 Listed $170,000 CRMLS
Property tax history
+1.9%/yrLatest (2025): $317 · +0.1% YoY. Source: county tax records.
Cash-flow waterfall
monthlySold comps — $/sqft
last 12 mo · ≤1 miLoading sold comps…