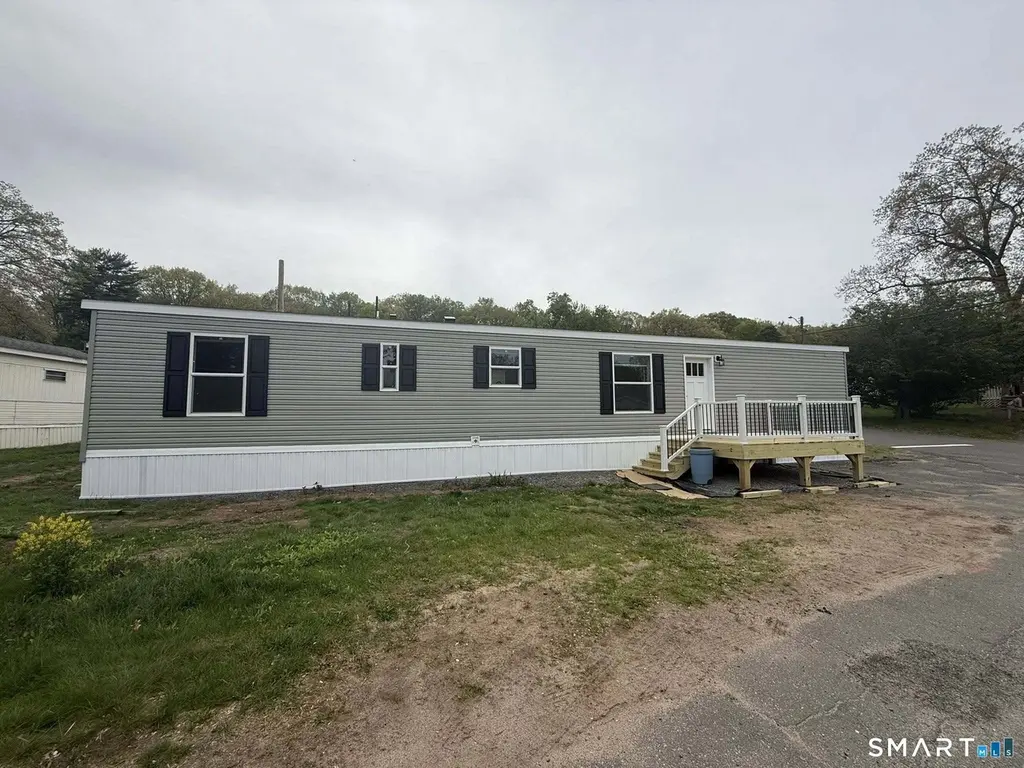
325 Kelly Rd Lot M14 · Vernon, CT
Flood risk No data
- FEMA flood zone
- —
- Chance of flooding over 30 yrs
- —
- Est. flood insurance / yr
- —
Fire risk No data
- Est. fire insurance / yr
- —
Heat risk No data
- Hot days now (above threshold)
- —
- Hot days in 30 yrs
- —
Wind risk No data
- Chance of severe wind over 30 yrs
- —
Air-quality risk No data
- Unhealthy air days now
- —
- Unhealthy air days in 30 yrs
- —
Risk factors via First Street. Map © Google.
Why this score? — see what drove the B- grade
The composite is a weighted blend of 9 inputs, each scored 0–100. Each bar is that input's sub-score; the figure is the points it added to the 100-point composite (weight × sub-score).
- Cash flow +30.0/30.0
- DSCR +10.0/10.0
- 1% rule +8.9/10.0
- ARV discount +7.5/15.0
- Rent growth +3.7/5.0
- Schools +3.6/10.0
- Livability +2.5/5.0
- Condition / age +2.5/5.0
- Appreciation +0.0/10.0
$129,900
🖨 Deal sheet 📄 Offer letter ✓ Due diligence
Listing remarks
Agent is related to seller. Beautiful new home on a nice lot, Vernon Village is a 55 and older community. Potential buyers must fill out an application and be approved by the park prior to any purchase. Grounds are extremely well-kept and service is very good.
Key facts
- Built 1982
- Listed 12 days
Property features AI
Finance
- Other: Living area approximately 784 (public record)
Exterior
- Utilities: Private well; Private water system; Public sewer connection; Electric service (standard)
- Home design: Single-family home
- Construction: Vinyl siding exterior; Asphalt shingle roof; Other construction; No basement
- Exterior features: Cleared lot
Interior
- Kitchen: Gas cooktop; Oven/Range; Microwave; Range hood; Refrigerator; Dishwasher; Garbage disposal
- Bedrooms: 2 bedrooms
- Bathrooms: 1 full bathroom
- Heating & cooling: Hot air heating; Propane-fueled heating (above-ground tank)
- Interior features: Central air conditioning; Energy Star rated
- Laundry & utility: Hot water system (other type)
Neighborhood map
What this means for you Summary
Snapshot
- This is a 2-bed/1.0-bath manufactured listed at $130k.
Deal economics
- At list price, monthly cash flow is $643 ($8k/yr) — positive.
- The deal already cash-flows at list — no discount required.
- Meets the 1% rule at list price ($2k rent vs $130k).
Location & tenants
- Location reads: area grade B — affects rentability + tenant quality, not the cash-flow math above.
- Vernon School District (suburban): math 34% / reading 48% proficiency, ranked #97 of 153 in CT (top 63%) — families likely to look elsewhere, expect single-tenant / working-renter base with shorter leases.
- Market conditions: Rents rising fast (+4.7%/yr); 81 active listings in the ZIP; 1 comparable units currently listed for rent nearby; solid renter incomes; 1,867 units permitted in Capitol Planning Region in 2024 (1,399 in 5+ unit buildings).
Forward outlook
- Local home prices are declining (-3.0%/yr); year-one equity from $898 of loan paydown is wiped out by about $4k of value loss. Plan a longer hold.
- At projected returns (-3.0% appreciation + 4.7% rent growth), your $36k cash investment doubles in ~6 years — after that, you're playing with house money.
Negotiation context
- Only 12 days on market — expect competitive offers; lowballing is unlikely to land.
- 3 sale attempts since 15y ago with the ask held roughly flat each time — persistent listings suggest the price (not the market) is what's stuck; bring a comps-based counter.
Questions for the listing agent
- Is there a deadline driving the sale (1031 exchange, divorce, estate, relocation)? That informs how much negotiation room exists.
- What's the average days-on-market for RENTAL listings here right now (not sales)? A rising rental-DOM trend means longer vacancies and softer asking-rent achievability than the comps imply.
- What's the recent tenant-quality profile in this submarket — average credit score on applications, eviction rate, late-payment / NSF rate, and stable-employment percentage? A property-management company in the area should have these aggregated.
- How much new for-sale + rental construction is in the pipeline within 1–3 miles? Heavy new supply typically softens prices + rents 12–24 months out; constrained supply supports both.
Investment metrics
- 1% rule
- 1.39% ✓
- Cap rate
- 12.24%
- Cash-on-cash
- 21.23%
- DSCR
- 1.94
- GRM
- 6.0
CMA / ARV
- ARV (median comp)
- $79,791
- List price
- $129,900
- Delta
- 62.80%
- Verdict
- OVERPRICED
- Comps
- 20 within 1.0 mi
Projected returns pro-forma
-3.0% appreciation · 4.73% rent growth · sell at horizon
- IRR
- 15.5%
- Equity multiple
- 1.63×
- Total profit
- $23,073
- Equity at exit
- $19,369
- IRR
- 25.3%
- Equity multiple
- 3.37×
- Total profit
- $86,230
- Equity at exit
- $11,231
Cash invested: $36,372 (down + closing). Projections, not guarantees.
Landlord ↔ Tenant lean methodology
- Overall (STATE)
- 27 Tenant-Leaning
- State Connecticut
- 27 Tenant-Leaning · D+7
- County
- — inherits STATE
- City
- — inherits STATE
ZIP-level market 06066
- Rents YoY
- 4.7%
- Active inventory
- 81
- Price-to-rent
- 6.0×
Monthly cashflow live
- Estimated rent
- $1,801 medium interval (Pro) →
- Mortgage (P&I)
- −$681
- Tax from tax record
- −$44 /mo · $528/yr
- Insurance
- −$54
- HOA
- −$0
- Vacancy / Maint / Mgmt
- −$378
- Net cashflow
- $643
Break-even live
UW: 25.0% down · 7.5% · 30yr · 1.5% tax · 5.0% vac · 8.0% maint · 8.0% mgmt
Financing live
Cash to close
- Down payment
- $32,475
- Closing costs
- $3,897
- Reserves months
- —
- Total cash needed
- —
Loan-product check · same deal, 3 products live
Conventional
25% down · 7.5% · 30yr
- Down + closing
- —
- Monthly P&I
- —
- Monthly cashflow
- —
- DSCR
- —
- Eligible?
- —
Personal DTI + credit; lowest rate.
DSCR
20% down · 8.5% · 30yr
- Down + closing
- —
- Monthly P&I
- —
- Monthly cashflow
- —
- DSCR
- —
- Eligible?
- —
No personal income docs; deal must DSCR.
Hard money
10% down · 12.0% · 12mo
- Down + closing
- —
- Monthly P&I
- —
- Monthly cashflow
- —
- DSCR
- —
- Eligible?
- —
Short-term bridge; refi at stabilization.
Rent comps 1 comps
| Address | Beds | Baths | Sqft | Rent | $/sqft | DOM | Units | Dist |
|---|---|---|---|---|---|---|---|---|
| 25 Gerber Rd E South Windsor, CT | 2.0 | 1.0 | 900 | $2,045 | $2.27 | 1d | 1 | 0.40mi |
Listing history 7 events
-
2026-06-18days on market $129,900 Active 12 DOM
-
2026-06-17price $129,900 Active 11 DOM
-
2026-06-17days on market $134,999 Active 11 DOM
-
2026-05-14price $134,999 260-char remark
-
2026-05-11$129,999 Active 260-char remark
-
2012-07-03historical
-
2011-09-14$18,500
ⓘ Source: listings_history table (triggers on properties + properties_extension) + one-shot
backfill from property_details.listing_events for pre-trigger history.
Tax reassessment forecast CT · Partial reset (capped growth)
- Current annual tax
- $528 · $44/mo
- Projected year-2 tax
- $1,654 · $138/mo
- Expected delta
- +$1,126/yr (+$94/mo · 213.2%)
ⓘ Screening estimate from a state-policy table — verify with the county assessor before closing.
Nearby sold comps map
Loading sold comps map…
Walkable amenities ~0.75 mi
Loading nearby amenities…
Taxation est. · year 1
- Rental income
- $21,611
- − Mortgage interest
- −$7,276
- − Property taxes
- −$528
- − Insurance
- −$650
- − Repairs & maintenance
- −$1,729
- − Management
- −$1,729
- − Depreciation
- −$3,779
- Taxable income
- $5,921
- Est. tax owed @ 24.0%
- −$1,421
- After-tax cash flow
- $6,300/yr
For passive investors: Depreciation is non-cash, so a rental often shows a tax loss while cash-flowing — sheltering income. Rental losses are passive: they offset passive income freely, and up to $25,000/yr can offset ordinary (W-2) income if you actively participate and your MAGI is under $100k (phasing out to $0 by $150k); unused losses carry forward. On sale, claimed depreciation is recaptured at up to 25%, and gains may owe capital-gains tax (a 1031 exchange can defer both). Figures are a year-1 estimate at your 24.0% rate — not tax advice; consult a CPA.
Schools (NCES district)
- District
- Vernon School District
- NCES district ID
- 0904680
- Math proficiency
- 34% ▼ -11.00%
- Reading proficiency
- 48% ▼ -6.00%
- Median HH income
- $60,342
- Composite
- 36.26/100
- National rank
- #4704
- State rank
- #97 of 153 in CT
Livability — Vernon
No livability data for this city. (Only ~50 U.S. cities are tracked.)
Census & demographics
- County
- Tolland County · 46,815 people
- Metro
- Hartford-East Hartford-Middletown, CT
- Population (ZIP)
- 30,577
- Household income
- $85,356
- Rent vs Own
- Severe rent burden
- 1140.0
Population outlook (Capitol County) Hauer SSP2
- By 2040
- 1,063,519
Race, ethnicity, and origin ACS 2023
- Neighborhood character
- Predominantly White (71%)
- Race & ethnicity
- White 71% Hispanic / Latino 12% Two or more races 7% Asian 6% Black 5%
- Hispanic origin (detail)
- Mexican 1% Puerto Rican 9%
- Common ancestry
- Lithuanian 8% Romanian 7% Slovak 2%
- Foreign-born
- 11% · Canada, China, South Korea
- Languages at home
- 84% English-only · Spanish 6% Other Indo-European 5% Russian/Polish/Slavic 1%
Political lean MEDSL · Capitol
- 2024 margin
- Strong D (+21.9) · D 60.1% · R 38.2% · Other 1.7%
- All cycles
- 2024: D+21.9
Not yet ingested
- Civics
- —
Market trends
- HPI YoY
- ▼ -136.25%
- Current HPI
- 249.7888
- Rent YoY
- ▲ 4.73%
- Metro
- Hartford-East Hartford-Middletown, CT
- State GDP YoY
- ▲ 1.06%
- F500 in state
- 38
Industry mix (Fortune 500 HQ in CT)
| Industry | F500 HQs | Revenue |
|---|---|---|
| Industrial Machinery | 4 | $38B |
|
||
| Insurance | 3 | $71B |
|
||
| Financial Services | 2 | $25B |
|
||
| Transportation / Logistics | 2 | $18B |
|
||
| Healthcare | 1 | $247B |
|
||
| Telecommunications | 1 | $55B |
|
||
Price history
+602.2% since first listed7 events — show timeline
- 2026-06-17 Price Changed $129,900 Smart MLS
- 2026-06-16 Relisted — Smart MLS
- 2026-05-24 Listing Removed — Smart MLS
- 2026-05-14 Price Changed $134,999 Smart MLS
- 2026-05-11 Listed $129,999 Smart MLS
- 2012-07-03 Listing Removed — Smart MLS
- 2011-09-14 Listed $18,500 Smart MLS
Property tax history
-0.6%/yrLatest (2023): $528 · +0.0% YoY. Source: county tax records.
Cash-flow waterfall
monthlySold comps — $/sqft
last 12 mo · ≤1 miLoading sold comps…