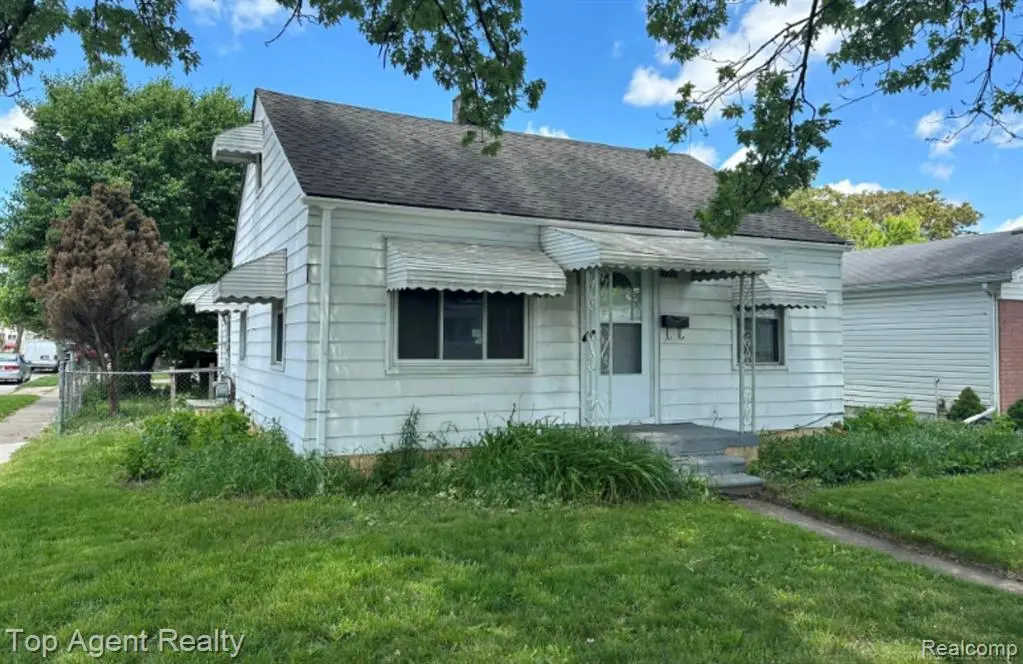
17705 Longfellow St · Roseville, MI
Flood risk 1/10 · Minimal
- FEMA flood zone
- X (unshaded)
- Chance of flooding over 30 yrs
- 0.0%
- Est. flood insurance / yr
- $507 – $1,088
Fire risk 1/10 · Minimal
- Est. fire insurance / yr
- $784 – $1,456
Heat risk 3/10 · Minor
- Hot days now (above 96°F)
- 7 days/yr
- Hot days in 30 yrs
- 15 days/yr
Wind risk 1/10 · Minimal
- Chance of severe wind over 30 yrs
- —
Air-quality risk 4/10 · Minor
- Unhealthy air days now
- 4 days/yr
- Unhealthy air days in 30 yrs
- 5 days/yr
Risk factors via First Street. Map © Google.
Why this score? — see what drove the C- grade
The composite is a weighted blend of 9 inputs, each scored 0–100. Each bar is that input's sub-score; the figure is the points it added to the 100-point composite (weight × sub-score).
- Cash flow +15.0/30.0
- ARV discount +15.0/15.0
- 1% rule +5.0/10.0
- DSCR +5.0/10.0
- Livability +3.6/5.0
- Rent growth +2.6/5.0
- Condition / age +2.5/5.0
- Schools +1.5/10.0
- Appreciation +0.0/10.0
$59,900
🖨 Deal sheet (PDF) 📄 Offer letter ✓ Due diligence
Listing remarks MLS
Opportunity knocks! This charming 2 bedroom in Roseville is the underpriced investor special you've been looking for. Home can be used as a 4 bedroom, but upstairs bedrooms are a bit small. Have you seen the comps in the neighborhood? Home has great bones, but listing price reflects the needed repairs and/or updates. Being sold strictly as-is. .. seller will not do any repairs. All sizes are estimates. Buyer's agent to verify all information. Seller will not accept sight unseen offers. Seller prefers cash, but will consider other finance options. You have many options on this one. Buy it and rent it, fix it and flip it, or simply remodel it and move right in. Hurry, this “investor special†won't last very long.
Key facts
- 4,356 sq ft lot
- Garage
- Built 1947
Property features AI
Exterior
- Parking: Detached 1-car garage
- Utilities: Public water; Public sewer
- Home design: Single-family residence; One and one-half story; Ground-level entry with steps
- Construction: Asphalt construction materials
- Exterior features: Paved road access; Lot approximately 0.1 acre (40 x 105)
Interior
- Bathrooms: 1 full bathroom
- Heating & cooling: Forced air heating (natural gas); No central cooling
- Interior features: Gas water heater; Crawl space basement; Total of 4 rooms
Neighborhood map
What this means for you Summary
Snapshot
- This is a 2-bed/1.0-bath single-family listed at $60k.
Deal economics
- At list price, monthly cash flow is $2k ($23k/yr) — positive.
- The deal already cash-flows at list — no discount required.
- Meets the 1% rule at list price ($3k rent vs $60k).
- Cap rate 45.3% vs local median 5.9% in Roseville — top-decile yield for the area; either an underpriced asset or a hidden risk that comps aren't pricing in. Stress-test before assuming the spread holds.
Location & tenants
- Location reads 72/100 on livability (#258 in MI) — a middle-class / working-renter tenant base. Strengths: commute A+, cost of living A+, housing A+; Watch: health & safety D+, employment D, crime F.
- Roseville Community Schools (suburban): math 11% / reading 24% proficiency, ranked #483 of 540 in MI (top 89%) — low school quality limits family demand, transient renter base, plan for 1-2y turnover; 60% free/reduced lunch — lower-income household profile, screen leases tightly.
- Zoned schools: Roseville High School (math 12% / reading 27%, grade F, #622 of 713 statewide, top 88%, 1,216 students, 70% FRL).
- Market conditions: Rents flat; 269 active listings in the ZIP; 18 comparable units currently listed for rent nearby; rentals leasing fast (median 0d on market — plan ~1-2 weeks tenant-placement turnaround); 1,321 units permitted in Macomb County in 2024 (86 in 5+ unit buildings).
- At $2,989/mo this rent would consume 58% of the median local household income ($62k/yr) (locally 1712% of renters already pay >50% of income on rent) — very limited rent-growth headroom before tenants either downsize or default.
Forward outlook
- Local home prices are declining (-3.0%/yr); year-one equity from $414 of loan paydown is wiped out by about $2k of value loss. Plan a longer hold.
- Macomb County population projected at +9% by 2050 — modest demand growth; plan on rents tracking national, not racing it.
- At projected returns (-3.0% appreciation + 0.4% rent growth), your $17k cash investment doubles in ~1 year — after that, you're playing with house money.
Negotiation context
- Only 8 days on market — expect competitive offers; lowballing is unlikely to land.
- 14 sale attempts since 4y ago with the ask held roughly flat each time — persistent listings suggest the price (not the market) is what's stuck; bring a comps-based counter.
- Current owner paid $30k; list at $60k implies a 100% gain — meaningful room to come down on a strong offer.
Risks & watch-outs
- Watch-outs: built in 1947 — expect roof / HVAC / electrical / plumbing capex.
Questions for the listing agent
- Built in 1947 — when were the roof, HVAC, electrical panel, plumbing, and water heater last replaced?
- Is there a deadline driving the sale (1031 exchange, divorce, estate, relocation)? That informs how much negotiation room exists.
- Schools are F-rated, which usually means shorter tenancies and higher turnover. Who's the typical renter profile here, and what's been the actual vacancy rate?
- Crime grade is F in this area — have there been break-ins, vandalism, or insurance claims at this property in the last 3 years? What carrier currently insures it and at what premium?
- What's the average days-on-market for RENTAL listings here right now (not sales)? A rising rental-DOM trend means longer vacancies and softer asking-rent achievability than the comps imply.
- What's the recent tenant-quality profile in this submarket — average credit score on applications, eviction rate, late-payment / NSF rate, and stable-employment percentage? A property-management company in the area should have these aggregated.
- How much new for-sale + rental construction is in the pipeline within 1–3 miles? Heavy new supply typically softens prices + rents 12–24 months out; constrained supply supports both.
Investment metrics
- 1% rule
- 4.99% ✓
- Cap rate
- 45.31%
- Cash-on-cash
- 139.34%
- DSCR
- 7.20
- GRM
- 1.7
CMA / ARV
- ARV (on-the-fly)
- $111,600
- Comps found
- 12
Show comp detail 12 sales within ~0.75 mi
| Address | Dist | Beds/Ba | Sqft | Sold | Price | $/sf | Match |
|---|---|---|---|---|---|---|---|
| 17705 Longfellow St | 0.00mi | 3/1.0 (+1) | 720 (0%) | 3mo | $30,000 | $42 | 92 |
| 17405 Tennyson St | 0.22mi | 2/1.0 | 688 (-4%) | 12mo | $115,000 | $167 | 73 |
| 17253 Lowell St | 0.38mi | 2/1.0 | 700 (-3%) | 10mo | $105,000 | $150 | 69 |
| 28311 Waverly St | 0.56mi | 2/1.0 | 696 (-3%) | 2mo | $98,000 | $141 | 67 |
| 26500 Greenleaf St | 0.52mi | 2/1.0 | 761 (+6%) | 0mo | $127,000 | $167 | 66 |
| 28648 Hillview St | 0.64mi | 2/1.0 | 688 (-4%) | 4mo | $149,000 | $217 | 60 |
| 28065 Maple St | 0.41mi | 1/1.0 (-1) | 650 (-10%) | 5mo | $30,500 | $47 | 56 |
| 28735 Maple St | 0.70mi | 2/1.0 | 688 (-4%) | 5mo | $151,000 | $219 | 55 |
| 28320 Waverly St | 0.55mi | 2/1.0 | 774 (+8%) | 8mo | $105,000 | $136 | 55 |
| 28336 Rosemont St | 0.59mi | 2/1.0 | 804 (+12%) | 2mo | $125,000 | $155 | 52 |
| 28096 Waverly St | 0.46mi | 2/1.0 | 813 (+13%) | 8mo | $135,750 | $167 | 50 |
| 28648 Rosemont St | 0.71mi | 2/1.0 | 630 (-12%) | 2mo | $60,000 | $95 | 44 |
Match score weights: distance 35% · size 25% · config 20% · recency 20%. Top-matched comps best support the ARV.
Projected returns pro-forma
-3.0% appreciation · 0.39% rent growth · sell at horizon
- IRR
- —
- Equity multiple
- 7.36×
- Total profit
- $106,730
- Equity at exit
- $8,931
- IRR
- —
- Equity multiple
- 14.30×
- Total profit
- $223,050
- Equity at exit
- $5,179
Cash invested: $16,772 (down + closing). Projections, not guarantees.
Landlord ↔ Tenant lean methodology
- Overall (STATE)
- 62 Landlord-Friendly
- State Michigan
- 62 Landlord-Friendly · EVEN
- County
- — inherits STATE
- City
- — inherits STATE
ZIP-level market 48066
- Rents YoY
- 0.4%
- Active inventory
- 269
- Price-to-rent
- 1.7×
Monthly cashflow live
- Estimated rent
- $2,989 high interval (Pro) →
- Mortgage (P&I)
- −$314
- Tax est. 1.5%
- −$75 /mo · $898/yr
- Insurance
- −$25
- HOA
- −$0
- Vacancy / Maint / Mgmt
- −$628
- Net cashflow
- $1,948
Break-even live
Sensitivity live
| Price | -10% $1,989 | -5% $1,968 | +0% $1,948 | +5% $1,927 | +10% $1,906 |
|---|---|---|---|---|---|
| Rent | -10% $1,711 | -5% $1,829 | +0% $1,948 | +5% $2,066 | +10% $2,184 |
| Rate | -1.0pp $1,978 | -0.5pp $1,963 | base $1,948 | +0.5pp $1,932 | +1.0pp $1,916 |
UW: 25.0% down · 7.5% · 30yr · 1.5% tax · 5.0% vac · 8.0% maint · 8.0% mgmt
Financing live
Cash to close
- Down payment
- $14,975
- Closing costs
- $1,797
- Reserves months
- —
- Total cash needed
- —
Loan-product check · same deal, 3 products live
Conventional
25% down · 7.5% · 30yr
- Down + closing
- —
- Monthly P&I
- —
- Monthly cashflow
- —
- DSCR
- —
- Eligible?
- —
Personal DTI + credit; lowest rate.
DSCR
20% down · 8.5% · 30yr
- Down + closing
- —
- Monthly P&I
- —
- Monthly cashflow
- —
- DSCR
- —
- Eligible?
- —
No personal income docs; deal must DSCR.
Hard money
10% down · 12.0% · 12mo
- Down + closing
- —
- Monthly P&I
- —
- Monthly cashflow
- —
- DSCR
- —
- Eligible?
- —
Short-term bridge; refi at stabilization.
Rent comps 18 comps
| Address | Beds | Baths | Sqft | Rent | $/sqft | DOM | Units | Dist |
|---|---|---|---|---|---|---|---|---|
| 18308 Mesle St Unit 1032362P Roseville, MI | 1.0 | 1.0 | 742 | $3,072 | $4.14 | 6d | 1 | 0.32mi |
| 27850 Gratiot Ave Unit 1032354P Roseville, MI | 1.0 | 1.0 | 742 | $3,573 | $4.82 | 0d | 1 | 0.34mi |
| 18340 Mesle St Unit 1032351P Roseville, MI | 1.0 | 1.0 | 742 | $3,333 | $4.49 | 0d | 1 | 0.34mi |
| 18355 Mesle St Unit 1032347P Roseville, MI | 1.0 | 1.0 | 742 | $3,886 | $5.24 | 0d | 1 | 0.36mi |
| 18377 Sharon Ln Unit 1032363P Roseville, MI | 1.0 | 1.0 | 742 | $3,323 | $4.48 | 0d | 1 | 0.38mi |
| 18377 Sharon Ln Unit 1032361P Roseville, MI | 1.0 | 1.0 | 742 | $3,409 | $4.59 | 0d | 1 | 0.38mi |
| 18389 Sharon Ln Unit 1032350P Roseville, MI | 1.0 | 1.0 | 742 | $3,391 | $4.57 | 0d | 1 | 0.39mi |
| 18365 Sharon Ln Unit 1032339P Roseville, MI | 1.0 | 1.0 | 742 | $3,324 | $4.48 | 0d | 1 | 0.40mi |
| 18423 Sharon Ln Unit 1032349P Roseville, MI | 1.0 | 1.0 | 742 | $3,210 | $4.33 | 3d | 1 | 0.41mi |
| 18423 Sharon Ln Unit 1032353P Roseville, MI | 1.0 | 1.0 | 742 | $3,422 | $4.61 | 0d | 1 | 0.41mi |
| 18431 Sharon Ln Unit 1032346P Roseville, MI | 1.0 | 1.0 | 742 | $3,695 | $4.98 | 16d | 1 | 0.42mi |
| 18443 Sharon Ln Unit 1032345P Roseville, MI | 1.0 | 1.0 | 742 | $3,168 | $4.27 | 0d | 1 | 0.42mi |
| 18447 Sharon Ln Unit 1032337P Roseville, MI | 1.0 | 1.0 | 742 | $3,468 | $4.67 | 18d | 1 | 0.43mi |
| 18451 Sharon Ln Unit 1032334P Roseville, MI | 1.0 | 1.0 | 742 | $3,196 | $4.31 | 0d | 1 | 0.43mi |
| 18459 Sharon Ln Unit 1032344P Roseville, MI | 1.0 | 1.0 | 742 | $3,663 | $4.94 | 0d | 1 | 0.43mi |
| 28368 Rosemont St Roseville, MI | 2.0 | 1.0 | 696 | $1,500 | $2.16 | 23d | 1 | 0.59mi |
| 16435 Twelve Mile Rd Roseville, MI | 1.0 | 1.0 | 600 | $950 | $1.58 | 45d | 1 | 1.14mi |
| 16425 12 Mile Rd Roseville, MI | 1.0 | 1.0 | 600 | $950 | $1.58 | 45d | 1 | 1.17mi |
Listing history 7 events
-
2026-06-18status $59,900 Pending 8 DOM
-
2026-06-18days on market $59,900 Active 8 DOM
-
2026-06-17days on market $59,900 Active 7 DOM
-
2026-06-16days on market $59,900 Active 6 DOM
-
2026-06-15days on market $59,900 Active 5 DOM
-
2026-06-13remarks 681-char remark
-
2026-06-13$59,900 Active 3 DOM
ⓘ Source: listings_history table (triggers on properties + properties_extension) + one-shot
backfill from property_details.listing_events for pre-trigger history.
Climate risk First Street
- Flood 1/10 Low FEMA zone X (unshaded) · 0% chance over 30 yrs
- Wildfire 1/10 Low
- Heat 3/10 Moderate 7 d/yr ≥96°F today · 15 d/yr by 30 yrs out
- Wind 1/10 Low
- Air quality 4/10 Moderate 4 unhealthy d/yr today · 5 by 30 yrs out
Nearby sold comps map
Loading sold comps map…
Walkable amenities ~0.75 mi
Loading nearby amenities…
Taxation est. · year 1
- Rental income
- $35,871
- − Mortgage interest
- −$3,355
- − Property taxes
- −$898
- − Insurance
- −$300
- − Repairs & maintenance
- −$2,870
- − Management
- −$2,870
- − Depreciation
- −$1,743
- Taxable income
- $23,836
- Est. tax owed @ 24.0%
- −$5,721
- After-tax cash flow
- $17,650/yr
For passive investors: Depreciation is non-cash, so a rental often shows a tax loss while cash-flowing — sheltering income. Rental losses are passive: they offset passive income freely, and up to $25,000/yr can offset ordinary (W-2) income if you actively participate and your MAGI is under $100k (phasing out to $0 by $150k); unused losses carry forward. On sale, claimed depreciation is recaptured at up to 25%, and gains may owe capital-gains tax (a 1031 exchange can defer both). Figures are a year-1 estimate at your 24.0% rate — not tax advice; consult a CPA.
Schools (NCES district)
- District
- Roseville Community Schools
- NCES district ID
- 2630210
- Math proficiency
- 11% ▼ -8.00%
- Reading proficiency
- 24% ▼ -7.00%
- Median HH income
- $41,590
- Composite
- 14.98/100
- National rank
- #9363
- State rank
- #483 of 540 in MI
Livability — Roseville
- Score
- 72/100
- State rank
- #258
- US rank
- #6400
Category grades
Schools grade is shown separately in the Schools card above.
Census & demographics
- Census place
- Roseville, MI
- County
- Macomb County · 638,552 people
- City population
- 47,123
- Metro
- Detroit-Warren-Dearborn, MI
- Population (ZIP)
- 47,123
- Household income
- $62,182
- Rent vs Own
- Severe rent burden
- 1712.0
Population outlook (Macomb County) Hauer SSP2
- Today (2025)
- 925,296 people
- By 2030
- 948,226 · +2.5%
- By 2040
- 983,961 · +6.3%
- By 2050
- 1,010,200 · +9.2%
- By 2075
- 1,076,222 · +16.3%
- By 2100
- 1,077,065 · +16.4%
Race, ethnicity, and origin ACS 2023
- Neighborhood character
- Predominantly White (65%)
- Race & ethnicity
- White 65% Black 23% Two or more races 7% Hispanic / Latino 4% Asian 2%
- Common ancestry
- Romanian 12% Lithuanian 4% Slovak 2%
- Foreign-born
- 5% · Canada
- Languages at home
- 93% English-only · Spanish 2% Russian/Polish/Slavic 1% Other Indo-European 1%
Political lean MEDSL · Macomb
- 2024 margin
- R (+13.7) · D 42.2% · R 55.9% · Other 1.9%
- 2008→2024 swing
- -22.3pp toward R · 2008: 8.6pp · 2024: -13.7pp
- All cycles
- 2024: R+13.7 2020: R+8.1 2016: R+11.6 2012: D+4.0 2008: D+8.6
Not yet ingested
- Civics
- —
Market trends
- HPI YoY
- ▼ -232.95%
- Current HPI
- 217.4171
- Rent YoY
- ▲ 0.39%
- Metro
- Detroit-Warren-Dearborn, MI
- State GDP YoY
- ▲ 1.37%
- F500 in state
- 28
Industry mix (Fortune 500 HQ in MI)
| Industry | F500 HQs | Revenue |
|---|---|---|
| Automotive Parts | 3 | $48B |
|
||
| Automotive | 2 | $372B |
|
||
| Chemicals | 1 | $45B |
|
||
| Automotive Retail | 1 | $29B |
|
||
| Healthcare / Medical Devices | 1 | $23B |
|
||
| Automotive Technology | 1 | $20B |
|
||
Price history
-7.1% since first listed35 events — show timeline
- 2026-06-11 Listed $59,900 REALCOMP
- 2026-06-10 Listed $59,900 MiRealSource-MiMLS
- 2026-03-10 Sold (MLS) $30,000 REALCOMP
- 2026-03-10 Sold (MLS) $30,000 MiRealSource-MiMLS
- 2026-03-04 Pending — REALCOMP
- 2026-03-04 Pending — MiRealSource-MiMLS
- 2026-03-04 Listing Removed — REALCOMP
- 2026-01-26 Relisted — REALCOMP
- 2026-01-26 Relisted — MiRealSource-MiMLS
- 2026-01-23 Pending — REALCOMP
- 2026-01-23 Pending — MiRealSource-MiMLS
- 2026-01-16 Listed $95,000 REALCOMP
- 2026-01-16 Listed $95,000 MiRealSource-MiMLS
- 2024-07-11 Rental Removed $1,200 TURBOTENANT
- 2024-07-07 Price Changed $1,200 TURBOTENANT
- 2024-06-18 Price Changed $1,250 TURBOTENANT
- 2024-06-07 Price Changed $1,300 TURBOTENANT
- 2024-05-26 Listed for Rent $1,400 TURBOTENANT
- 2022-08-12 Sold (MLS) $50,000 MiRealSource-MiMLS
- 2022-08-12 Sold (MLS) $50,000 REALCOMP
- 2022-08-01 Pending — MiRealSource-MiMLS
- 2022-08-01 Pending — REALCOMP
- 2022-07-22 Listing Removed — REALCOMP
- 2022-07-21 Listing Removed — MiRealSource-MiMLS
- 2022-07-21 Listed $54,900 MiRealSource-MiMLS
- 2022-07-21 Listed $54,900 REALCOMP
- 2022-06-13 Listed $54,900 MiRealSource-MiMLS
- 2022-06-13 Listed $54,900 REALCOMP
- 2022-06-03 Sold (MLS) $42,000 REALCOMP
- 2022-06-03 Sold (MLS) $42,000 MiRealSource-MiMLS
- 2022-03-23 Pending — MiRealSource-MiMLS
- 2022-03-20 Relisted — MiRealSource-MiMLS
- 2022-03-18 Pending — MiRealSource-MiMLS
- 2022-03-16 Listed $64,500 REALCOMP
- 2022-03-16 Listed $64,500 MiRealSource-MiMLS
Property tax history
+11.2%/yrLatest (2025): $3,102 · -1.4% YoY. Source: county tax records.
Cash-flow waterfall
monthlySold comps — $/sqft
last 12 mo · ≤1 miLoading sold comps…