 🏗️ New Construction
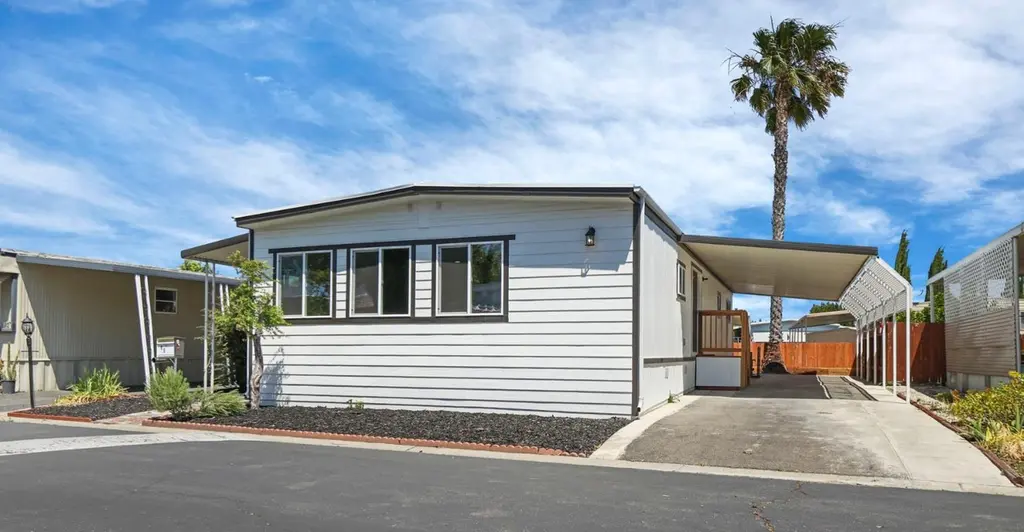
8600 West Ln #69 · Stockton, CA
Flood risk 1/10 · Minimal
- FEMA flood zone
- X
- Chance of flooding over 30 yrs
- 0.0%
- Est. flood insurance / yr
- $507 – $1,088
Fire risk 3/10 · Minor
- Est. fire insurance / yr
- $659 – $1,223
Heat risk 6/10 · Moderate
- Hot days now (above 102°F)
- 6 days/yr
- Hot days in 30 yrs
- 13 days/yr
Wind risk 1/10 · Minimal
- Chance of severe wind over 30 yrs
- —
Air-quality risk 10/10 · Severe
- Unhealthy air days now
- 30 days/yr
- Unhealthy air days in 30 yrs
- 30 days/yr
Risk factors via First Street. Map © Google.
Why this score? — see what drove the B grade
The composite is a weighted blend of 9 inputs, each scored 0–100. Each bar is that input's sub-score; the figure is the points it added to the 100-point composite (weight × sub-score).
- Cash flow +30.0/30.0
- 1% rule +10.0/10.0
- DSCR +10.0/10.0
- ARV discount +7.5/15.0
- Rent growth +4.3/5.0
- Condition / age +4.0/5.0
- Livability +2.9/5.0
- Schools +2.7/10.0
- Appreciation +0.0/10.0
$179,900
🖨 Deal sheet 📄 Offer letter ✓ Due diligence
Listing remarks
Welcome to Friendly Village where safety and security are sacred in this peaceful senior community. This home has undergone a complete transformation in it's lengthy and thorough remodel and reinforcing process. Home has been leveled and reinforced with added pier support. Original skirting replaced with wood , all ceiling and walls done in sheetrock with 2'x4' joists to add support. Entire front of home has been opened up and the kitchen and bathrooms all boast marble countertops and elegant ceramic backsplash tiles. They are also evident backing the wall behind the fireplace. Outside the driveway has been widened with offset support posts which also are used to open up the patio. And a re
Key facts
- 3 parking spots
- Built 1970
- Listed 24 days
Property features AI
Finance
- HOA & community: No homeowners association; Located in a senior community; Land lease: No (listed land lease amount present but land lease flagged as No)
Exterior
- Parking: Covered parking; Guest parking available; Interior access to parking
- Utilities: Individual electric meter and individual gas meter; 220V supply in kitchen and laundry; Natural gas connected; Public sewer and public water (water district); Internet available
- Home design: Manufactured in-park home (double wide); Updated/remodeled; new construction listing status; Built in 1970
- Construction: Wood skirting; Elastomeric and metal roof
- Exterior features: Fenced yard; Patio, carport, and porch awnings
Interior
- Kitchen: Built-in gas oven; Built-in gas range; Breakfast area with island and marble counters
- Bedrooms: 2 bedrooms (3 possible)
- Bathrooms: 2 full bathrooms with double sinks, tile, and shower stalls
- Heating & cooling: Central heating and cooling; Gas heating and fireplace; Multi-unit HVAC
- Interior features: Accessible doors, full accessible bath, and accessible kitchen; Insulation, energy-efficient windows, water heater, and thermostat; Covered patio; Dual-pane partial windows with screens; Electric fireplace in the family room (1)
- Laundry & utility: Inside laundry area with gas hook-up and hookups only
Neighborhood map
What this means for you Summary
Snapshot
- This is a 2-bed/2.0-bath manufactured listed at $180k. Condition is rated good.
Deal economics
- At list price, monthly cash flow is $735 ($9k/yr) — positive.
- The deal already cash-flows at list — no discount required.
- Meets the 1% rule at list price ($2k rent vs $180k).
- Recommended offer: $177k (1.5% below list) — sets the bar for market timing.
- Cap rate 13.5% vs local median 3.6% in Stockton — top-decile yield for the area; either an underpriced asset or a hidden risk that comps aren't pricing in. Stress-test before assuming the spread holds.
Location & tenants
- Location reads 57/100 on livability (#734 in CA) — a working-class tenant base; expect higher turnover. Strengths: housing A+, health & safety A, amenities A-; Watch: employment C-, schools D-, crime F.
- Lodi Unified (urban): math 24% / reading 36% proficiency, ranked #325 of 517 in CA (top 63%) — families likely to look elsewhere, expect single-tenant / working-renter base with shorter leases.
- Market conditions: Rents rising fast (+7.1%/yr); 102 active listings in the ZIP; 18 comparable units currently listed for rent nearby; rentals at typical pace (median 24d on market — plan ~3-4 weeks tenant-placement turnaround); 44% of comp listings sitting > 30 days — soft ceiling on asking rent; 3,779 units permitted in San Joaquin County in 2024 (0 in 5+ unit buildings).
- This rent runs 35% of the median local income ($68k/yr) — at the standard rent-burdened threshold; future hikes will face affordability resistance.
Forward outlook
- Local home prices are declining (-3.0%/yr); year-one equity from $846 of loan paydown is wiped out by about $4k of value loss. Plan a longer hold.
- San Joaquin County population projected at +17% by 2050 — long-run rental-demand tailwind backs the buy-and-hold thesis.
- At projected returns (-3.0% appreciation + 7.1% rent growth), your $34k cash investment doubles in ~5 years — after that, you're playing with house money.
Negotiation context
- It's been on market 24 days — a 2% lower offer ($177k) is reasonable based on typical stale-listing flexibility.
Risks & watch-outs
- Climate carrying-cost: extreme-heat days projected 6→13/yr by 2055 (HVAC capex compounding) — expect insurance premiums to compound above CPI over the hold.
Questions for the listing agent
- Built in 1970 — when were the roof, HVAC, electrical panel, plumbing, and water heater last replaced?
- Is there a deadline driving the sale (1031 exchange, divorce, estate, relocation)? That informs how much negotiation room exists.
- Schools are D-rated, which usually means shorter tenancies and higher turnover. Who's the typical renter profile here, and what's been the actual vacancy rate?
- Crime grade is F in this area — have there been break-ins, vandalism, or insurance claims at this property in the last 3 years? What carrier currently insures it and at what premium?
- What's the average days-on-market for RENTAL listings here right now (not sales)? A rising rental-DOM trend means longer vacancies and softer asking-rent achievability than the comps imply.
- What's the recent tenant-quality profile in this submarket — average credit score on applications, eviction rate, late-payment / NSF rate, and stable-employment percentage? A property-management company in the area should have these aggregated.
- How much new for-sale + rental construction is in the pipeline within 1–3 miles? Heavy new supply typically softens prices + rents 12–24 months out; constrained supply supports both.
Investment metrics
- 1% rule
- 1.63% ✓
- Cap rate
- 13.50%
- Cash-on-cash
- 25.72%
- DSCR
- 2.14
- GRM
- 5.1
CMA / ARV
- ARV (on-the-fly)
- $122,400
- Comps found
- 12
Show comp detail 12 sales within ~0.75 mi
| Address | Dist | Beds/Ba | Sqft | Sold | Price | $/sf | Match |
|---|---|---|---|---|---|---|---|
| 8700 West Ln #279 | 0.17mi | 2/2.0 | 1,440 (0%) | 1mo | $135,000 | $94 | 91 |
| 8700 West Ln #149 | 0.15mi | 2/2.0 | 1,440 (0%) | 4mo | $100,000 | $69 | 90 |
| 8600 West Ln #172 | 0.06mi | 3/2.0 (+1) | 1,416 (-2%) | 2mo | $105,000 | $74 | 88 |
| 8600 West Ln #102 | 0.03mi | 2/2.0 | 1,440 (0%) | 13mo | $95,000 | $66 | 88 |
| 8700 West Ln #57 | 0.15mi | 2/1.5 | 1,440 (0%) | 6mo | $134,000 | $93 | 86 |
| 8700 West Ln #121 | 0.16mi | 2/2.0 | 1,440 (0%) | 11mo | $137,900 | $96 | 84 |
| 8700 West Ln #171 | 0.17mi | 2/2.0 | 1,440 (0%) | 14mo | $133,700 | $93 | 80 |
| 8700 West Ln #174 | 0.17mi | 2/2.0 | 1,568 (+9%) | 1mo | $125,000 | $80 | 76 |
| 8700 West Ln #251 | 0.16mi | 2/2.0 | 1,344 (-7%) | 8mo | $120,000 | $89 | 74 |
| 8700 West Ln #186 | 0.15mi | 2/2.0 | 1,248 (-13%) | 0mo | $85,000 | $68 | 71 |
| 8700 West Ln #67 | 0.16mi | 2/2.0 | 1,536 (+7%) | 14mo | $130,000 | $85 | 70 |
| 8700 N West Ln #166 | 0.19mi | 3/2.0 (+1) | 1,550 (+8%) | 11mo | $125,000 | $81 | 64 |
Match score weights: distance 35% · size 25% · config 20% · recency 20%. Top-matched comps best support the ARV.
Projected returns pro-forma
-3.0% appreciation · 7.09% rent growth · sell at horizon
- IRR
- 23.9%
- Equity multiple
- 2.04×
- Total profit
- $35,559
- Equity at exit
- $18,250
- IRR
- 34.3%
- Equity multiple
- 4.78×
- Total profit
- $129,611
- Equity at exit
- $10,583
Cash invested: $34,272 (down + closing). Projections, not guarantees.
Landlord ↔ Tenant lean methodology
- Overall (STATE)
- 18 Strongly Tenant-Friendly
- State California
- 18 Strongly Tenant-Friendly · D+13
- County
- — inherits STATE
- City
- — inherits STATE
ZIP-level market 95210
- Rents YoY
- 7.1%
- Active inventory
- 102
- Price-to-rent
- 7.5×
Monthly cashflow live
- Estimated rent
- $2,001 high interval (Pro) →
- Mortgage (P&I)
- −$642
- Tax est. 1.5%
- −$153 /mo · $1,836/yr
- Insurance
- −$51
- HOA
- −$0
- Vacancy / Maint / Mgmt
- −$420
- Net cashflow
- $735
Break-even live
UW: 25.0% down · 7.5% · 30yr · 1.5% tax · 5.0% vac · 8.0% maint · 8.0% mgmt
Financing live
Cash to close
- Down payment
- $30,600
- Closing costs
- $3,672
- Reserves months
- —
- Total cash needed
- —
Loan-product check · same deal, 3 products live
Conventional
25% down · 7.5% · 30yr
- Down + closing
- —
- Monthly P&I
- —
- Monthly cashflow
- —
- DSCR
- —
- Eligible?
- —
Personal DTI + credit; lowest rate.
DSCR
20% down · 8.5% · 30yr
- Down + closing
- —
- Monthly P&I
- —
- Monthly cashflow
- —
- DSCR
- —
- Eligible?
- —
No personal income docs; deal must DSCR.
Hard money
10% down · 12.0% · 12mo
- Down + closing
- —
- Monthly P&I
- —
- Monthly cashflow
- —
- DSCR
- —
- Eligible?
- —
Short-term bridge; refi at stabilization.
Rent comps 18 comps
| Address | Beds | Baths | Sqft | Rent | $/sqft | DOM | Units | Dist |
|---|---|---|---|---|---|---|---|---|
| 1857 Crestwood Cir Stockton, CA | 3.0 | 2.0 | 1561 | $2,450 | $1.57 | 43d | 1 | 0.28mi |
| 1768 Crestwood Cir Stockton, CA | 3.0 | 2.0 | 1389 | $2,500 | $1.80 | 43d | 1 | 0.31mi |
| 9211 Dalewood St Stockton, CA | 2.0 | 1.0 | 898 | $1,495 | $1.66 | 3d | 1 | 0.32mi |
| 1031 Fallbrook Dr Stockton, CA | 2.0 | 2.0 | 962 | $1,695 | $1.76 | 43d | 1 | 0.44mi |
| 7936 Montauban Ave Unit Labs Stockton, CA | 2.0 | 2.0 | 1000 | $1,700 | $1.70 | 10d | 1 | 0.50mi |
| 718 Bedlow Dr Stockton, CA | 2.0 | 1.0 | 929 | $1,250 | $1.35 | 43d | 1 | 0.76mi |
| 718 Bedlow Dr Unit 720 Stockton, CA | 2.0 | 1.0 | 929 | $1,250 | $1.35 | 2d | 1 | 0.76mi |
| 7409 Village Green Dr Stockton, CA | 3.0 | 2.0 | 1141 | $2,000 | $1.75 | 43d | 1 | 0.86mi |
| 326 Sue Ct Stockton, CA | 3.0 | 2.0 | 1153 | $2,495 | $2.16 | 23d | 1 | 0.89mi |
| 326 Sue Ct Stockton, CA | 3.0 | 2.0 | 1153 | $2,495 | $2.16 | 21d | 1 | 0.89mi |
| 7926 Diana Marie Dr Unit 7926 Stockton, CA | 2.0 | 1.0 | 900 | $1,800 | $2.00 | 2d | 1 | 1.01mi |
| 6465 West Ln Stockton, CA | 2.0 | 1.0 | 1200 | $1,625 | $1.35 | 44d | 1 | 1.14mi |
| 8446 N El Dorado St Stockton, CA | 3.0 | 2.0 | 1269 | $2,300 | $1.81 | 43d | 1 | 1.31mi |
| 7620 N El Dorado St Stockton, CA | 1.0–3.0 | 1.0–2.0 | 827 | $1,538 | $1.86 | 43d | 1 | 1.36mi |
| 6807 N El Dorado St Stockton, CA | 2.0 | 1.5 | 980 | $1,750 | $1.79 | 23d | 1 | 1.36mi |
| 764 E Swain Rd Stockton, CA | 2.0 | 1.0 | 915 | $1,675 | $1.83 | 10d | 1 | 1.44mi |
| 764 E Swain Rd Unit SW-12 Stockton, CA | 2.0 | 1.0 | 915 | $1,655 | $1.81 | 19d | 1 | 1.44mi |
| 764 E Swain Rd Unit SW-05 Stockton, CA | 2.0 | 1.0 | 915 | $1,675 | $1.83 | 2d | 1 | 1.44mi |
Listing history 14 events
-
2026-06-18days on market $179,900 Active 24 DOM
-
2026-06-17days on market $179,900 Active 23 DOM
-
2026-06-16days on market $179,900 Active 22 DOM
-
2026-06-15days on market $179,900 Active 21 DOM
-
2026-06-14days on market $179,900 Active 19 DOM
-
2026-06-10days on market $179,900 Active 16 DOM
-
2026-06-09days on market $179,900 Active 15 DOM
-
2026-06-08days on market $179,900 Active 14 DOM
-
2026-06-07days on market $179,900 Active 13 DOM
-
2026-06-05days on market $179,900 Active 10 DOM
-
2026-06-03days on market $179,900 Active 9 DOM
-
2026-06-03days on market $179,900 Active 8 DOM
-
2026-06-01days on market $179,900 Active 7 DOM
-
2026-05-31days on market $179,900 Active 6 DOM
ⓘ Source: listings_history table (triggers on properties + properties_extension) + one-shot
backfill from property_details.listing_events for pre-trigger history.
Climate risk First Street
- Flood 1/10 Low FEMA zone X · 0% chance over 30 yrs
- Wildfire 3/10 Moderate
- Heat 6/10 Major 6 d/yr ≥102°F today · 13 d/yr by 30 yrs out
- Wind 1/10 Low
- Air quality 10/10 Extreme 30 unhealthy d/yr today · 30 by 30 yrs out
Nearby sold comps map
Loading sold comps map…
Walkable amenities ~0.75 mi
Loading nearby amenities…
Taxation est. · year 1
- Rental income
- $24,008
- − Mortgage interest
- −$6,856
- − Property taxes
- −$1,836
- − Insurance
- −$612
- − Repairs & maintenance
- −$1,921
- − Management
- −$1,921
- − Depreciation
- −$3,561
- Taxable income
- $7,302
- Est. tax owed @ 24.0%
- −$1,752
- After-tax cash flow
- $7,064/yr
For passive investors: Depreciation is non-cash, so a rental often shows a tax loss while cash-flowing — sheltering income. Rental losses are passive: they offset passive income freely, and up to $25,000/yr can offset ordinary (W-2) income if you actively participate and your MAGI is under $100k (phasing out to $0 by $150k); unused losses carry forward. On sale, claimed depreciation is recaptured at up to 25%, and gains may owe capital-gains tax (a 1031 exchange can defer both). Figures are a year-1 estimate at your 24.0% rate — not tax advice; consult a CPA.
Condition & rehab AI · 8 photos
This manufactured home is in good condition with minimal repairs needed. Painting the exterior and replacing gutters would significantly enhance its curb appeal and value.
Value-add opportunities
- Both Paint exterior — Enhances curb appeal and value
- Both Replace gutters — Improves drainage and aesthetics
Renovation cost estimate screening
Value-add ROI direction
- Both Paint exterior — Enhances curb appeal and value ↑
- Both Replace gutters — Improves drainage and aesthetics ↑
ⓘ Cost ranges are severity-bucket heuristics (US national rule-of-thumb). Get contractor quotes + a written scope before underwriting a rehab budget.
Schools (NCES district)
- District
- Lodi Unified
- NCES district ID
- 0622230
- Math proficiency
- 24% ▼ -8.00%
- Reading proficiency
- 36% ▼ -8.00%
- Median HH income
- $57,165
- Composite
- 26.84/100
- National rank
- #7108
- State rank
- #325 of 517 in CA
Livability — Stockton
- Score
- 57/100
- State rank
- #734
- US rank
- #21638
Category grades
Schools grade is shown separately in the Schools card above.
Census & demographics
- Census place
- Stockton, CA
- County
- San Joaquin County · 729,570 people
- City population
- 332,006
- Metro
- Stockton, CA
- Population (ZIP)
- 41,549
- Household income
- $67,991
- Rent vs Own
- Severe rent burden
- 1817.0
Population outlook (San Joaquin County) Hauer SSP2
- Today (2025)
- 796,965 people
- By 2030
- 828,849 · +4.0%
- By 2040
- 885,611 · +11.1%
- By 2050
- 929,798 · +16.7%
- By 2075
- 994,578 · +24.8%
- By 2100
- 971,291 · +21.9%
Race, ethnicity, and origin ACS 2023
- Neighborhood character
- Highly diverse neighborhood (Simpson 0.73)
- Race & ethnicity
- Hispanic / Latino 38% Asian 31% Two or more races 21% White 13% Black 11% Pacific Islander 1%
- Hispanic origin (detail)
- Mexican 34%
- Common ancestry
- Italian 1% Russian 1%
- Foreign-born
- 27% · Canada, Vietnam, China
- Languages at home
- 49% English-only · Spanish 25% Other Asian/Pacific 12% Other Indo-European 6%
Political lean MEDSL · San Joaquin
- 2024 margin
- Toss-up / Even · D 48.0% · R 48.9% · Other 3.0%
- 2008→2024 swing
- -11.6pp toward R · 2008: 10.7pp · 2024: -0.9pp
- All cycles
- 2024: R+0.9 2020: D+13.9 2016: D+12.9 2012: D+8.9 2008: D+10.7
Not yet ingested
- Civics
- —
Market trends
- HPI YoY
- ▼ -283.31%
- Current HPI
- 349.495
- Rent YoY
- ▲ 7.09%
- Metro
- Stockton, CA
- State GDP YoY
- ▲ 3.21%
- F500 in state
- 116
Industry mix (Fortune 500 HQ in CA)
| Industry | F500 HQs | Revenue |
|---|---|---|
| Technology | 27 | $1,492B |
|
||
| Financial Services | 3 | $174B |
|
||
| Retail | 3 | $44B |
|
||
| Insurance | 3 | $26B |
|
||
| Media / Entertainment | 2 | $115B |
|
||
| Pharmaceuticals / Biotech | 2 | $62B |
|
||
Cash-flow waterfall
monthlySold comps — $/sqft
last 12 mo · ≤1 miLoading sold comps…