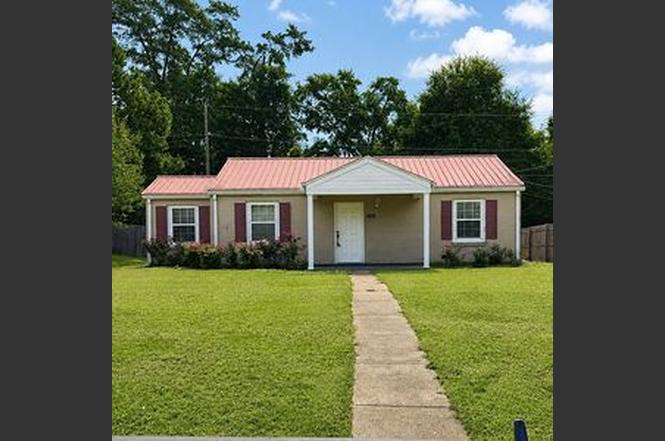
112 Forest Ave · Enterprise, AL
Flood risk 1/10 · Minimal
- FEMA flood zone
- X (unshaded)
- Chance of flooding over 30 yrs
- 0.0%
- Est. flood insurance / yr
- $507 – $1,088
Fire risk 2/10 · Minimal
- Est. fire insurance / yr
- $916 – $1,700
Heat risk 8/10 · Major
- Hot days now (above 106°F)
- 7 days/yr
- Hot days in 30 yrs
- 19 days/yr
Wind risk 8/10 · Major
- Chance of severe wind over 30 yrs
- 99.0%
Air-quality risk 1/10 · Minimal
- Unhealthy air days now
- 0 days/yr
- Unhealthy air days in 30 yrs
- 0 days/yr
Risk factors via First Street. Map © Google.
Why this score? — see what drove the C+ grade
The composite is a weighted blend of 9 inputs, each scored 0–100. Each bar is that input's sub-score; the figure is the points it added to the 100-point composite (weight × sub-score).
- Cash flow +22.4/30.0
- ARV discount +15.0/15.0
- DSCR +7.2/10.0
- 1% rule +5.0/10.0
- Schools +4.3/10.0
- Rent growth +3.5/5.0
- Livability +3.2/5.0
- Condition / age +2.5/5.0
- Appreciation +0.0/10.0
$110,000
🖨 Deal sheet (PDF) 📄 Offer letter ✓ Due diligence
Listing remarks MLS
NICE HOME CLOSE TO SCHOOLS AND CHURCH- NEWER ROOF, TIN ROOF IN 2007- COVERED ATTACHED CARPORT- SINGLE FAMILY HOME FOR LESS THAN A TOWNHOUSE- SEPARATED DINING ROOM- STORAGE SHED. TWO FIG TREES- CULLIGAN WATER SYSTEM,
Key facts
- Laminate flooring
- Wooden privacy fence
- Covered carport
Tags
Neighborhood map
What this means for you Summary
Snapshot
- This is a 2-bed/1.0-bath single-family listed at $110k.
Deal economics
- At list price, monthly cash flow is $183 ($2k/yr) — positive.
- The deal already cash-flows at list — no discount required.
- To meet the 1% rule (rent ≥ 1% of price), the offer needs to be $109k (0.5% below list).
- Recommended offer: $109k (0.5% below list) — sets the bar for 1% rule.
- Cap rate 8.3% vs local median 4.1% in Enterprise — top-decile yield for the area; either an underpriced asset or a hidden risk that comps aren't pricing in. Stress-test before assuming the spread holds.
Location & tenants
- Location reads 65/100 on livability (#127 in AL) — a middle-class / working-renter tenant base. Strengths: cost of living A+, housing A+; Watch: health & safety D, crime F, amenities F.
- Enterprise City (town): math 40% / reading 60% proficiency, ranked #12 of 129 in AL (top 9%) — acceptable for families but not a draw, mixed tenant base, ~2y average lease.
- Market conditions: Rents rising (+3.9%/yr); 444 active listings in the ZIP; 7 comparable units currently listed for rent nearby; rentals lingering (median 46d on market — plan ~5-8 weeks vacancy on turnover, expect pricing pressure); 100% of comp listings sitting > 30 days — soft ceiling on asking rent; solid renter incomes; 137 units permitted in Coffee County in 2024 (0 in 5+ unit buildings).
- This rent is only 17% of the median local income ($76k/yr) — well below the 30% rent-burden line; pricing power to push rent on renewal without tenant pushback.
Forward outlook
- Local home prices are declining (-3.0%/yr); year-one equity from $761 of loan paydown is wiped out by about $3k of value loss. Plan a longer hold.
Negotiation context
- Only 6 days on market — expect competitive offers; lowballing is unlikely to land.
- 5 sale attempts since 21y ago with the ask held roughly flat each time — persistent listings suggest the price (not the market) is what's stuck; bring a comps-based counter.
- Current owner paid $40k; list at $110k implies a 175% gain — meaningful room to come down on a strong offer.
Risks & watch-outs
- Climate carrying-cost: severe wind risk, 99% chance of damaging wind over 30y; extreme-heat days projected 7→19/yr by 2055 (HVAC capex compounding) — expect insurance premiums to compound above CPI over the hold.
Questions for the listing agent
- Is there a deadline driving the sale (1031 exchange, divorce, estate, relocation)? That informs how much negotiation room exists.
- Crime grade is F in this area — have there been break-ins, vandalism, or insurance claims at this property in the last 3 years? What carrier currently insures it and at what premium?
- What's the average days-on-market for RENTAL listings here right now (not sales)? A rising rental-DOM trend means longer vacancies and softer asking-rent achievability than the comps imply.
- What's the recent tenant-quality profile in this submarket — average credit score on applications, eviction rate, late-payment / NSF rate, and stable-employment percentage? A property-management company in the area should have these aggregated.
- How much new for-sale + rental construction is in the pipeline within 1–3 miles? Heavy new supply typically softens prices + rents 12–24 months out; constrained supply supports both.
Investment metrics
- 1% rule
- 1.00% ✗
- Cap rate
- 8.28%
- Cash-on-cash
- 7.11%
- DSCR
- 1.32
- GRM
- 8.4
CMA / ARV
- ARV (on-the-fly)
- $142,197
- Comps found
- 2
Show comp detail 2 sales within ~0.75 mi
| Address | Dist | Beds/Ba | Sqft | Sold | Price | $/sf | Match |
|---|---|---|---|---|---|---|---|
| 108 Pittman St | 0.46mi | 3/2.0 (+1) | 1,092 (+7%) | 11mo | $152,000 | $139 | 50 |
| 306 Heath St | 0.52mi | 3/1.0 (+1) | 1,144 (+12%) | 14mo | $145,000 | $127 | 40 |
Match score weights: distance 35% · size 25% · config 20% · recency 20%. Top-matched comps best support the ARV.
Projected returns pro-forma
-3.0% appreciation · 3.92% rent growth · sell at horizon
- IRR
- -4.5%
- Equity multiple
- 0.83×
- Total profit
- $-5,208
- Equity at exit
- $16,401
- IRR
- 6.1%
- Equity multiple
- 1.47×
- Total profit
- $14,584
- Equity at exit
- $9,511
Cash invested: $30,800 (down + closing). Projections, not guarantees.
Landlord ↔ Tenant lean methodology
- Overall (STATE)
- 90 Strongly Landlord-Friendly
- State Alabama
- 90 Strongly Landlord-Friendly · R+15
- County
- — inherits STATE
- City
- — inherits STATE
ZIP-level market 36330
- Home prices YoY
- -19.4%
- Rents YoY
- 3.9%
- Active inventory
- 444
- Price-to-rent
- 8.4×
Monthly cashflow live
- Estimated rent
- $1,095 high interval (Pro) →
- Mortgage (P&I)
- −$577
- Tax from tax record
- −$60 /mo · $717/yr
- Insurance
- −$46
- HOA
- −$0
- Lot rent
- −$0
- Vacancy / Maint / Mgmt
- −$230
- Net cashflow
- $183
Break-even live
Sensitivity live
| Price | -10% $245 | -5% $214 | +0% $183 | +5% $151 | +10% $120 |
|---|---|---|---|---|---|
| Rent | -10% $96 | -5% $139 | +0% $183 | +5% $226 | +10% $269 |
| Rate | -1.0pp $238 | -0.5pp $211 | base $183 | +0.5pp $154 | +1.0pp $125 |
UW: 25.0% down · 7.5% · 30yr · 1.5% tax · 5.0% vac · 8.0% maint · 8.0% mgmt
Financing live
Cash to close
- Down payment
- $27,500
- Closing costs
- $3,300
- Reserves months
- —
- Total cash needed
- —
Loan-product check · same deal, 3 products live
Conventional
25% down · 7.5% · 30yr
- Down + closing
- —
- Monthly P&I
- —
- Monthly cashflow
- —
- DSCR
- —
- Eligible?
- —
Personal DTI + credit; lowest rate.
DSCR
20% down · 8.5% · 30yr
- Down + closing
- —
- Monthly P&I
- —
- Monthly cashflow
- —
- DSCR
- —
- Eligible?
- —
No personal income docs; deal must DSCR.
Hard money
10% down · 12.0% · 12mo
- Down + closing
- —
- Monthly P&I
- —
- Monthly cashflow
- —
- DSCR
- —
- Eligible?
- —
Short-term bridge; refi at stabilization.
Rent comps 7 comps
| Address | Beds | Baths | Sqft | Rent | $/sqft | DOM | Units | Dist |
|---|---|---|---|---|---|---|---|---|
| 300 E Brunson St Enterprise, AL | 2.0 | 1.0 | 900 | $800 | $0.89 | 46d | 1 | 0.31mi |
| 618 N Rawls St Enterprise, AL | 3.0 | 1.0 | 1140 | $975 | $0.86 | 46d | 1 | 0.44mi |
| 102 Weeks Dr Unit 5 Enterprise, AL | 2.0 | 1.5 | 950 | $1,250 | $1.32 | 46d | 1 | 0.44mi |
| 110 Gibson St Unit 4 Enterprise, AL | 2.0 | 1.0 | 750 | $725 | $0.97 | 46d | 1 | 0.45mi |
| 712 Damascus Rd Enterprise, AL | 1.0 | 1.0 | 725 | $815 | $1.12 | 46d | 1 | 0.86mi |
| 202 Mill Ave Enterprise, AL | 3.0 | 1.0 | 980 | $875 | $0.89 | 46d | 1 | 1.02mi |
| 103 Green St Enterprise, AL | 3.0 | 2.0 | 1075 | $1,300 | $1.21 | 46d | 1 | 1.27mi |
Listing history 6 events
-
2026-06-22days on market $110,000 Active 6 DOM
-
2026-06-21days on market $110,000 Active 5 DOM
-
2026-06-19days on market $110,000 Active 3 DOM
-
2026-06-18days on market $110,000 Active 2 DOM
-
2026-06-17remarks 675-char remark
-
2026-06-17$110,000 Active 1 DOM
ⓘ Source: listings_history table (triggers on properties + properties_extension) + one-shot
backfill from property_details.listing_events for pre-trigger history.
Tax reassessment forecast AL · Resets to sale price
- Current annual tax
- $717 · $60/mo
- Projected year-2 tax
- $717 · $60/mo
- Expected delta
- $0/yr ($0/mo · 0.0%)
ⓘ Screening estimate from a state-policy table — verify with the county assessor before closing.
Climate risk First Street
- Flood 1/10 Low FEMA zone X (unshaded) · 0% chance over 30 yrs
- Wildfire 2/10 Low
- Heat 8/10 Severe 7 d/yr ≥106°F today · 19 d/yr by 30 yrs out
- Wind 8/10 Severe 99% chance of damaging wind over 30 yrs
- Air quality 1/10 Low 0 unhealthy d/yr today · 0 by 30 yrs out
Nearby sold comps map
Loading sold comps map…
Walkable amenities ~0.75 mi
Loading nearby amenities…
Taxation est. · year 1
- Rental income
- $13,139
- − Mortgage interest
- −$6,162
- − Property taxes
- −$717
- − Insurance
- −$550
- − Repairs & maintenance
- −$1,051
- − Management
- −$1,051
- − Depreciation
- −$3,200
- Taxable income
- $408
- Est. tax owed @ 24.0%
- −$98
- After-tax cash flow
- $2,092/yr
For passive investors: Depreciation is non-cash, so a rental often shows a tax loss while cash-flowing — sheltering income. Rental losses are passive: they offset passive income freely, and up to $25,000/yr can offset ordinary (W-2) income if you actively participate and your MAGI is under $100k (phasing out to $0 by $150k); unused losses carry forward. On sale, claimed depreciation is recaptured at up to 25%, and gains may owe capital-gains tax (a 1031 exchange can defer both). Figures are a year-1 estimate at your 24.0% rate — not tax advice; consult a CPA.
Schools (NCES district)
- District
- Enterprise City
- NCES district ID
- 0101320
- Math proficiency
- 40% ▼ -20.00%
- Reading proficiency
- 60% ▲ 4.00%
- Median HH income
- $51,311
- Composite
- 42.83/100
- National rank
- #3136
- State rank
- #12 of 129 in AL
Livability — Enterprise
- Score
- 65/100
- State rank
- #127
- US rank
- #12953
Category grades
Schools grade is shown separately in the Schools card above.
Census & demographics
- Census place
- Enterprise, AL
- County
- Coffee County · 39,557 people
- City population
- 39,557
- Metro
- Enterprise, AL
- Population (ZIP)
- 39,557
- Household income
- $75,765
- Rent vs Own
- Severe rent burden
- 1126.0
Population outlook (Coffee County) Hauer SSP2
- Today (2025)
- 53,133 people
- By 2030
- 53,832 · +1.3%
- By 2040
- 54,504 · +2.6%
- By 2050
- 54,289 · +2.2%
- By 2075
- 51,175 · -3.7%
- By 2100
- 46,793 · -11.9%
Race, ethnicity, and origin ACS 2023
- Neighborhood character
- Diverse neighborhood (Simpson 0.56)
- Race & ethnicity
- White 63% Black 17% Hispanic / Latino 13% Two or more races 9% Asian 1%
- Hispanic origin (detail)
- Mexican 6% Puerto Rican 3%
- Common ancestry
- Italian 3% Lithuanian 2% Serbian 2%
- Foreign-born
- 6% · Canada, Vietnam, South Korea
- Languages at home
- 89% English-only · Spanish 8% German/W. Germanic 2%
Political lean MEDSL · Coffee
- 2024 margin
- Solid R (+57.9) · D 20.7% · R 78.6%
- 2008→2024 swing
- -9.0pp toward R · 2008: -48.9pp · 2024: -57.9pp
- All cycles
- 2024: R+57.9 2020: R+53.1 2016: R+56.7 2012: R+49.4 2008: R+48.9
Not yet ingested
- Civics
- —
Market trends
- HPI YoY
- ▼ -44.44%
- Current HPI
- 184.0163
- Rent YoY
- ▲ 3.92%
- Metro
- Enterprise, AL
- State GDP YoY
- ▲ 2.94%
- F500 in state
- 4
Industry mix (Fortune 500 HQ in AL)
| Industry | F500 HQs | Revenue |
|---|---|---|
| Financial Services | 1 | $8B |
|
||
| Healthcare | 1 | $5B |
|
||
Price history
+84.9% since first listed7 events — show timeline
- 2026-06-17 Listed $110,000 FSBO.com
- 2015-06-22 Listed $52,000 MAAR
- 2015-06-22 Listed $52,000 WBR
- 2012-09-28 Sold (MLS) $40,000 MAAR
- 2011-09-27 Listed $40,000 MAAR
- 2006-06-01 Sold (MLS) $55,000 MAAR
- 2005-10-10 Listed $59,500 MAAR
Property tax history
+11.1%/yrLatest (2025): $717 · +5.4% YoY. Source: county tax records.
Cash-flow waterfall
monthlySold comps — $/sqft
last 12 mo · ≤1 miLoading sold comps…