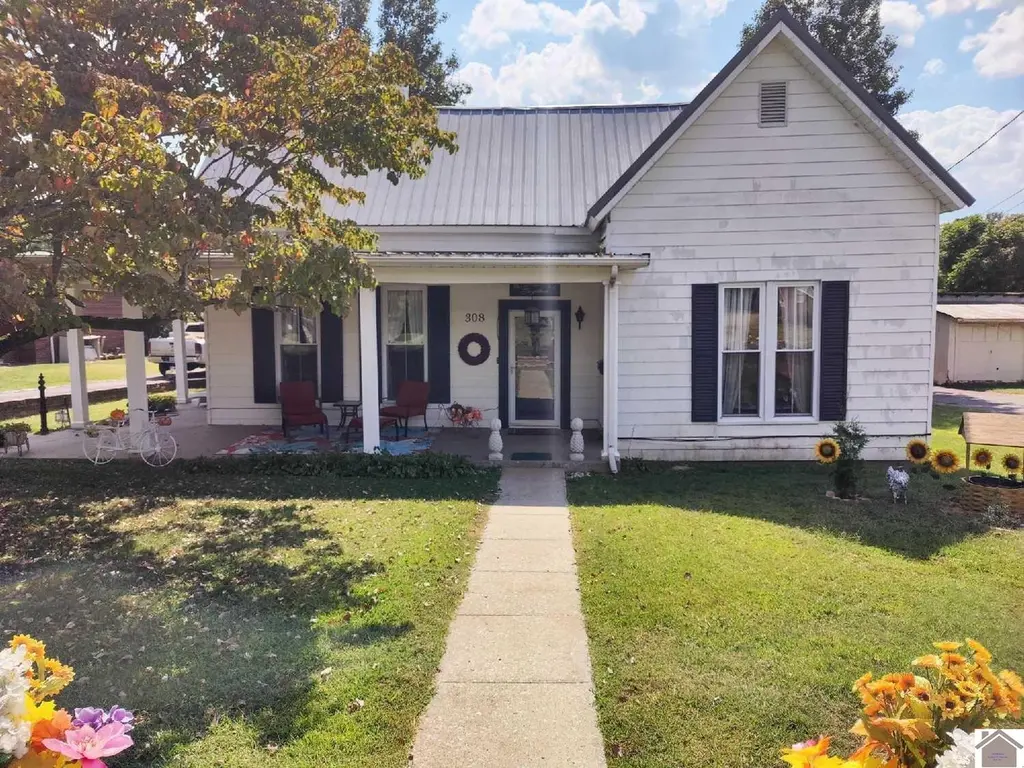
308 W Bellville St · Marion, KY
Flood risk 1/10 · Minimal
- FEMA flood zone
- X (unshaded)
- Chance of flooding over 30 yrs
- 0.0%
- Est. flood insurance / yr
- $507 – $1,088
Fire risk 3/10 · Minor
- Est. fire insurance / yr
- $839 – $1,559
Heat risk 5/10 · Moderate
- Hot days now (above 107°F)
- 7 days/yr
- Hot days in 30 yrs
- 21 days/yr
Wind risk 3/10 · Minor
- Chance of severe wind over 30 yrs
- 6.0%
Air-quality risk 2/10 · Minimal
- Unhealthy air days now
- 0 days/yr
- Unhealthy air days in 30 yrs
- 1 days/yr
Risk factors via First Street. Map © Google.
Why this score? — see what drove the B- grade
The composite is a weighted blend of 9 inputs, each scored 0–100. Each bar is that input's sub-score; the figure is the points it added to the 100-point composite (weight × sub-score).
- Cash flow +28.8/30.0
- DSCR +10.0/10.0
- ARV discount +7.5/15.0
- 1% rule +7.3/10.0
- Livability +3.6/5.0
- Schools +3.1/10.0
- Rent growth +2.5/5.0
- Condition / age +2.5/5.0
- Appreciation +0.0/10.0
$92,000
🖨 Deal sheet (PDF) 📄 Offer letter ✓ Due diligence
Listing remarks
Welcome to 308 W Bellville Street in downtown Marion, KY! This home is full of historic charm with tall ceilings, spacious rooms, and large porches perfect for relaxing or entertaining. Recent improvements include new refrigerator, stove, water heater, & updated heat and air system. The property features a fenced backyard, 2-car carport, and a 20' x 16' workshop for storage or hobbies. Enjoy a great location within walking distance to schools, the library, and downtown shops. This property offers strong potential as a great investment and is being offered for sale at a great price as is. Marion offers small-town charm and the nearby area offers great hunting and fishing, a golf course,
Key facts
- 9,583 sq ft lot
- 2 parking spots
- Listed 53 days
Property features AI
Exterior
- Parking: Carport with 2 spaces; Paved parking
- Security: Smoke detector(s)
- Utilities: Public water; Public sewer; Cable available; Natural gas available
- Home design: Single family residence; One story
- Construction: Frame construction; Aluminum siding; Metal roof
- Exterior features: Patio; Outbuilding; Level lot
Interior
- Kitchen: Dishwasher; Refrigerator; Cooktop
- Flooring: Carpet; Vinyl
- Bathrooms: 1 full bathroom
- Heating & cooling: Natural gas heating; Central air conditioning; Ceiling fan(s)
- Interior features: Dishwasher; Refrigerator; Cooktop; Gas water heater; Carpet flooring; Vinyl flooring; Ceiling fan(s); Smoke detector(s)
- Laundry & utility: Gas water heater
Neighborhood map
What this means for you Summary
Snapshot
- This is a 3-bed/1.0-bath single-family listed at $92k.
Deal economics
- At list price, monthly cash flow is $310 ($4k/yr) — positive.
- The deal already cash-flows at list — no discount required.
- Meets the 1% rule at list price ($1k rent vs $92k).
- Recommended offer: $89k (3.0% below list) — sets the bar for market timing.
Location & tenants
- Location reads 71/100 on livability (#140 in KY) — a middle-class / working-renter tenant base. Strengths: crime A+, cost of living A+, housing A+; Watch: employment D, amenities F, commute F.
- Crittenden County (rural): math 33% / reading 41% proficiency, ranked #56 of 165 in KY (top 34%) — families likely to look elsewhere, expect single-tenant / working-renter base with shorter leases.
- Zoned schools: Crittenden County Elementary School (math 47% / reading 45%, grade D-, #137 of 676 statewide, top 21%, 642 students, 66% FRL); Crittenden County Middle School (math 26% / reading 39%, grade F, #116 of 217 statewide, top 55%, 291 students, 60% FRL); Crittenden County High School (math 22% / reading 37%, grade F, #127 of 254 statewide, top 58%, 429 students, 56% FRL).
- Market conditions: 43 active listings in the ZIP.
Forward outlook
- Local home prices are declining (-3.0%/yr); year-one equity from $636 of loan paydown is wiped out by about $3k of value loss. Plan a longer hold.
- Crittenden County population projected at -11% by 2050 — secular population decline; favor cash flow + early exit over multi-decade hold.
- At projected returns (-3.0% appreciation + 3.0% rent growth), your $26k cash investment doubles in ~9 years — after that, you're playing with house money.
Negotiation context
- It's been on market 54 days — a 3% lower offer ($89k) is reasonable based on typical stale-listing flexibility.
- 2 sale attempts with the ask held roughly flat each time — persistent listings suggest the price (not the market) is what's stuck; bring a comps-based counter.
Risks & watch-outs
- Climate carrying-cost: extreme-heat days projected 7→21/yr by 2055 (HVAC capex compounding) — expect insurance premiums to compound above CPI over the hold.
Questions for the listing agent
- It's been on market 54 days. Have you received any prior offers? Is the seller open to a 3% concession, seller financing, or rate buy-down credit?
- Is there a deadline driving the sale (1031 exchange, divorce, estate, relocation)? That informs how much negotiation room exists.
- Schools are D-rated, which usually means shorter tenancies and higher turnover. Who's the typical renter profile here, and what's been the actual vacancy rate?
- What's the average days-on-market for RENTAL listings here right now (not sales)? A rising rental-DOM trend means longer vacancies and softer asking-rent achievability than the comps imply.
- What's the recent tenant-quality profile in this submarket — average credit score on applications, eviction rate, late-payment / NSF rate, and stable-employment percentage? A property-management company in the area should have these aggregated.
- How much new for-sale + rental construction is in the pipeline within 1–3 miles? Heavy new supply typically softens prices + rents 12–24 months out; constrained supply supports both.
Investment metrics
- 1% rule
- 1.23% ✓
- Cap rate
- 10.33%
- Cash-on-cash
- 14.43%
- DSCR
- 1.64
- GRM
- 6.8
CMA / ARV
No comps found within radius.
Projected returns pro-forma
-3.0% appreciation · 3.0% rent growth · sell at horizon
- IRR
- 4.8%
- Equity multiple
- 1.19×
- Total profit
- $4,810
- Equity at exit
- $13,717
- IRR
- 14.3%
- Equity multiple
- 2.15×
- Total profit
- $29,541
- Equity at exit
- $7,954
Cash invested: $25,760 (down + closing). Projections, not guarantees.
Landlord ↔ Tenant lean methodology
- Overall (STATE)
- 83 Strongly Landlord-Friendly
- State Kentucky
- 83 Strongly Landlord-Friendly · R+16
- County
- — inherits STATE
- City
- — inherits STATE
ZIP-level market 42064
- Home prices YoY
- -17.0%
- Active inventory
- 43
- Price-to-rent
- 6.8×
Monthly cashflow live
- Estimated rent
- $1,134 medium interval (Pro) →
- Mortgage (P&I)
- −$482
- Tax from tax record
- −$65 /mo · $784/yr
- Insurance
- −$38
- HOA
- −$0
- Vacancy / Maint / Mgmt
- −$238
- Net cashflow
- $310
Break-even live
Sensitivity live
| Price | -10% $362 | -5% $336 | +0% $310 | +5% $284 | +10% $258 |
|---|---|---|---|---|---|
| Rent | -10% $220 | -5% $265 | +0% $310 | +5% $355 | +10% $399 |
| Rate | -1.0pp $356 | -0.5pp $333 | base $310 | +0.5pp $286 | +1.0pp $262 |
UW: 25.0% down · 7.5% · 30yr · 1.5% tax · 5.0% vac · 8.0% maint · 8.0% mgmt
Financing live
Cash to close
- Down payment
- $23,000
- Closing costs
- $2,760
- Reserves months
- —
- Total cash needed
- —
Loan-product check · same deal, 3 products live
Conventional
25% down · 7.5% · 30yr
- Down + closing
- —
- Monthly P&I
- —
- Monthly cashflow
- —
- DSCR
- —
- Eligible?
- —
Personal DTI + credit; lowest rate.
DSCR
20% down · 8.5% · 30yr
- Down + closing
- —
- Monthly P&I
- —
- Monthly cashflow
- —
- DSCR
- —
- Eligible?
- —
No personal income docs; deal must DSCR.
Hard money
10% down · 12.0% · 12mo
- Down + closing
- —
- Monthly P&I
- —
- Monthly cashflow
- —
- DSCR
- —
- Eligible?
- —
Short-term bridge; refi at stabilization.
Listing history 23 events
-
2026-06-22days on market $92,000 Active 54 DOM
-
2026-06-21days on market $92,000 Active 53 DOM
-
2026-06-21days on market $92,000 Active 52 DOM
-
2026-06-18days on market $92,000 Active 50 DOM
-
2026-06-17days on market $92,000 Active 49 DOM
-
2026-06-16days on market $92,000 Active 48 DOM
-
2026-06-15days on market $92,000 Active 47 DOM
-
2026-06-13days on market $92,000 Active 45 DOM
-
2026-06-12days on market $92,000 Active 44 DOM
-
2026-06-09days on market $92,000 Active 41 DOM
-
2026-06-08days on market $92,000 Active 40 DOM
-
2026-06-07days on market $92,000 Active 39 DOM
-
2026-06-07days on market $92,000 Active 38 DOM
-
2026-06-04days on market $92,000 Active 35 DOM
-
2026-06-02days on market $92,000 Active 34 DOM
-
2026-06-01days on market $92,000 Active 33 DOM
-
2026-05-31days on market $92,000 Active 32 DOM
-
2026-05-31days on market $92,000 Active 31 DOM
-
2026-04-29$92,000 Active 748-char remark
-
2025-10-14price $120,000
-
2025-09-17$125,000 Active
-
2021-12-01soldstatus $86,900
-
2012-07-03soldstatus $81,000
ⓘ Source: listings_history table (triggers on properties + properties_extension) + one-shot
backfill from property_details.listing_events for pre-trigger history.
Tax reassessment forecast KY · Resets to sale price
- Current annual tax
- $784 · $65/mo
- Projected year-2 tax
- $791 · $66/mo
- Expected delta
- +$7/yr (+$1/mo · 0.9%)
ⓘ Screening estimate from a state-policy table — verify with the county assessor before closing.
Climate risk First Street
- Flood 1/10 Low FEMA zone X (unshaded) · 0% chance over 30 yrs
- Wildfire 3/10 Moderate
- Heat 5/10 Major 7 d/yr ≥107°F today · 21 d/yr by 30 yrs out
- Wind 3/10 Moderate 6% chance of damaging wind over 30 yrs
- Air quality 2/10 Low 0 unhealthy d/yr today · 1 by 30 yrs out
Nearby sold comps map
Loading sold comps map…
Walkable amenities ~0.75 mi
Loading nearby amenities…
Taxation est. · year 1
- Rental income
- $13,609
- − Mortgage interest
- −$5,153
- − Property taxes
- −$784
- − Insurance
- −$460
- − Repairs & maintenance
- −$1,089
- − Management
- −$1,089
- − Depreciation
- −$2,676
- Taxable income
- $2,358
- Est. tax owed @ 24.0%
- −$566
- After-tax cash flow
- $3,152/yr
For passive investors: Depreciation is non-cash, so a rental often shows a tax loss while cash-flowing — sheltering income. Rental losses are passive: they offset passive income freely, and up to $25,000/yr can offset ordinary (W-2) income if you actively participate and your MAGI is under $100k (phasing out to $0 by $150k); unused losses carry forward. On sale, claimed depreciation is recaptured at up to 25%, and gains may owe capital-gains tax (a 1031 exchange can defer both). Figures are a year-1 estimate at your 24.0% rate — not tax advice; consult a CPA.
Schools (NCES district)
- District
- Crittenden County
- NCES district ID
- 2101380
- Math proficiency
- 33% ▼ -10.00%
- Reading proficiency
- 41% ▼ -9.00%
- Median HH income
- $36,316
- Composite
- 30.67/100
- National rank
- #6181
- State rank
- #56 of 165 in KY
Livability — Marion
- Score
- 71/100
- State rank
- #140
- US rank
- #6738
Category grades
Schools grade is shown separately in the Schools card above.
Census & demographics
- Census place
- Marion, KY
- Population (ZIP)
- 8,020
Population outlook (Crittenden County) Hauer SSP2
- Today (2025)
- 8,874 people
- By 2030
- 8,634 · -2.7%
- By 2040
- 8,244 · -7.1%
- By 2050
- 7,884 · -11.2%
- By 2075
- 7,033 · -20.7%
- By 2100
- 5,847 · -34.1%
Race, ethnicity, and origin ACS 2023
- Neighborhood character
- Predominantly White (95%)
- Race & ethnicity
- White 95% Hispanic / Latino 3% Two or more races 2%
- Common ancestry
- Italian 6% Iranian 2% Serbian 2%
- Foreign-born
- 1%
- Languages at home
- 92% English-only · German/W. Germanic 6% Spanish 1%
Political lean MEDSL · Crittenden
- 2024 margin
- Solid R (+68.4) · D 15.2% · R 83.6% · Other 1.3%
- 2008→2024 swing
- -34.0pp toward R · 2008: -34.4pp · 2024: -68.4pp
- All cycles
- 2024: R+68.4 2020: R+64.1 2016: R+66.2 2012: R+48.8 2008: R+34.4
Not yet ingested
- Civics
- —
Market trends
- HPI YoY
- ▼ -34.91%
- Current HPI
- 170.1117
- Rent YoY
- —
- Metro
- —
- State GDP YoY
- ▲ 1.81%
- F500 in state
- 4
Industry mix (Fortune 500 HQ in KY)
| Industry | F500 HQs | Revenue |
|---|---|---|
| Healthcare | 1 | $118B |
|
||
| Food / Beverage | 1 | $7B |
|
||
Price history
+13.6% since first listed5 events — show timeline
- 2026-04-29 Listed $92,000 WKRMLS
- 2025-10-14 Price Changed $120,000 WKRMLS
- 2025-09-17 Listed $125,000 WKRMLS
- 2021-12-01 Sold (Public Records) $86,900 Public Records
- 2012-07-03 Sold (Public Records) $81,000 Public Records
Property tax history
+0.6%/yrLatest (2025): $784 · +103.6% YoY. Source: county tax records.
Cash-flow waterfall
monthlySold comps — $/sqft
last 12 mo · ≤1 miLoading sold comps…