 🏗️ New Construction
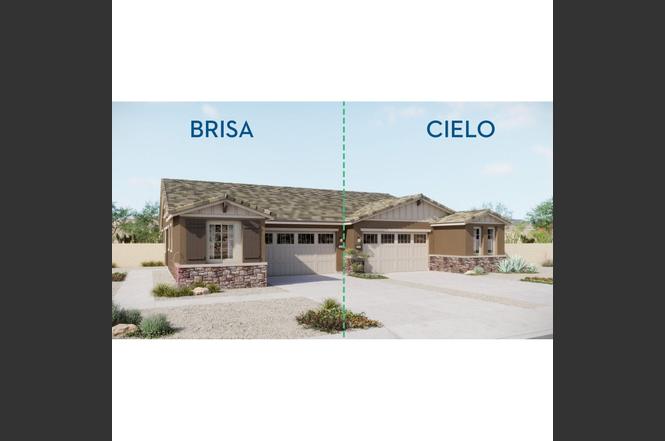
Cielo Plan · Buckeye, AZ
Flood risk 1/10 · Minimal
- FEMA flood zone
- X (shaded)
- Chance of flooding over 30 yrs
- 0.0%
- Est. flood insurance / yr
- $507 – $1,088
Fire risk 6/10 · Moderate
- Est. fire insurance / yr
- $610 – $1,132
Heat risk 9/10 · Severe
- Hot days now (above 113°F)
- 7 days/yr
- Hot days in 30 yrs
- 19 days/yr
Wind risk 1/10 · Minimal
- Chance of severe wind over 30 yrs
- —
Air-quality risk 1/10 · Minimal
- Unhealthy air days now
- 0 days/yr
- Unhealthy air days in 30 yrs
- 0 days/yr
Risk factors via First Street. Map © Google.
Why this score? — see what drove the C- grade
The composite is a weighted blend of 9 inputs, each scored 0–100. Each bar is that input's sub-score; the figure is the points it added to the 100-point composite (weight × sub-score).
- Cash flow +19.4/30.0
- ARV discount +7.5/15.0
- DSCR +6.1/10.0
- 1% rule +5.2/10.0
- Schools +3.9/10.0
- Rent growth +3.4/5.0
- Livability +3.4/5.0
- Condition / age +2.5/5.0
- Appreciation +0.0/10.0
$367,990
🖨 Deal sheet 📄 Offer letter ✓ Due diligence
Listing remarks
Introducing the Cielo plan, a beautifully designed 2-bedroom, 2.5-bathroom duplex-style home offering 1,324 square feet of living space. . This thoughtfully crafted floorplan combines comfort, style, and convenience to create a home you'll love to call your own. Every aspect of the Cielo floorplan is thoughtfully designed to provide a low-maintenance lifestyle, giving you more time to enjoy the social and recreational opportunities in the Victory community.
Key facts
- 2 garage spots
- Listed 196 days
Property features AI
Finance
- Financial info: List price $367,990
Exterior
- Parking: 2 total parking spaces; 2-car garage
- Home design: Plan name: Cielo; New-construction plan
- Exterior features: Living area approximately 1,324
Interior
- Bedrooms: 2 bedrooms
- Bathrooms: 2 full bathrooms
- Interior features: Active new-construction plan (Cielo)
Neighborhood map
What this means for you Summary
Snapshot
- This is a 2 × 2-bed/2.0-bath units multifamily listed at $368k.
Deal economics
- At list price, monthly cash flow is $410 ($5k/yr) — positive. Per door: $205/mo.
- The deal already cash-flows at list — no discount required.
- Meets the 1% rule at list price ($4k rent vs $368k).
- Recommended offer: $324k (12.0% below list) — sets the bar for market timing.
- Cap rate 7.6% vs local median 3.1% in Buckeye — top-decile yield for the area; either an underpriced asset or a hidden risk that comps aren't pricing in. Stress-test before assuming the spread holds.
Location & tenants
- Location reads 68/100 on livability (#53 in AZ) — a middle-class / working-renter tenant base. Strengths: employment A+, housing A+, crime A; Watch: schools D+, amenities F, commute F.
- Litchfield Elementary District (4281) (suburban): math 36% / reading 48% proficiency, ranked #55 of 249 in AZ (top 22%) — families likely to look elsewhere, expect single-tenant / working-renter base with shorter leases.
- Market conditions: Rents rising (+3.4%/yr); 939 active listings in the ZIP; 12 comparable units currently listed for rent nearby; rentals leasing fast (median 2d on market — plan ~1-2 weeks tenant-placement turnaround); high-income renter base; 36,011 units permitted in Maricopa County in 2024 (12,801 in 5+ unit buildings).
- This rent runs 39% of the median local income ($114k/yr) — at the standard rent-burdened threshold; future hikes will face affordability resistance.
Forward outlook
- Local home prices are declining (-3.0%/yr); year-one equity from $3k of loan paydown is wiped out by about $11k of value loss. Plan a longer hold.
- Maricopa County population projected at +38% by 2050 — long-run rental-demand tailwind backs the buy-and-hold thesis.
Negotiation context
- It's been on market 197 days — a 12% lower offer ($324k) is reasonable based on typical stale-listing flexibility.
Risks & watch-outs
- Climate carrying-cost: major wildfire risk; extreme-heat days projected 7→19/yr by 2055 (HVAC capex compounding) — expect insurance premiums to compound above CPI over the hold.
Questions for the listing agent
- It's been on market 197 days. Have you received any prior offers? Is the seller open to a 12% concession, seller financing, or rate buy-down credit?
- Can we see the unit-by-unit rent roll, current vacancy, and any below-market leases? What's the average tenancy length?
- What capital expenditures (roof, boiler, parking lot, exteriors) have been made in the last 5 years, and what's planned in the next 2?
- Why hasn't it sold? Are there any deal-killer items the seller is aware of (foundation, flood, title, zoning, code violations)?
- Is there a deadline driving the sale (1031 exchange, divorce, estate, relocation)? That informs how much negotiation room exists.
- Schools are D-rated, which usually means shorter tenancies and higher turnover. Who's the typical renter profile here, and what's been the actual vacancy rate?
- What's the average days-on-market for RENTAL listings here right now (not sales)? A rising rental-DOM trend means longer vacancies and softer asking-rent achievability than the comps imply.
- What's the recent tenant-quality profile in this submarket — average credit score on applications, eviction rate, late-payment / NSF rate, and stable-employment percentage? A property-management company in the area should have these aggregated.
- How much new apartment / multifamily construction is in the pipeline within 1–3 miles? Heavy new supply (>2% of stock underway) typically softens rents 12–24 months out; light construction supports rent growth.
Investment metrics
- 1% rule
- 1.02% ✓
- Cap rate
- 7.63%
- Cash-on-cash
- 4.77%
- DSCR
- 1.21
- GRM
- 8.2
CMA / ARV
No comps found within radius.
Projected returns pro-forma
-3.0% appreciation · 3.41% rent growth · sell at horizon
- IRR
- -8.4%
- Equity multiple
- 0.69×
- Total profit
- $-31,917
- Equity at exit
- $54,869
- IRR
- 1.7%
- Equity multiple
- 1.12×
- Total profit
- $12,461
- Equity at exit
- $31,817
Cash invested: $103,037 (down + closing). Projections, not guarantees.
Landlord ↔ Tenant lean methodology
- Overall (STATE)
- 87 Strongly Landlord-Friendly
- State Arizona
- 87 Strongly Landlord-Friendly · R+3
- County
- — inherits STATE
- City
- — inherits STATE
ZIP-level market 85396
- Home prices YoY
- -18.8%
- Rents YoY
- 3.4%
- Active inventory
- 939
- Price-to-rent
- 16.4×
Monthly cashflow live
- Estimated rent
- $3,738 medium interval (Pro) →
- Mortgage (P&I)
- −$1,930
- Tax est. 1.5%
- −$460 /mo · $5,520/yr
- Insurance
- −$153
- HOA
- −$0
- Vacancy / Maint / Mgmt
- −$785
- Net cashflow
- $410
Break-even live
2-unit breakdown (identical units grouped — click to expand)
| Units | Beds | Baths | Est. rent |
|---|---|---|---|
| 2× units | 2 | 2 | $3,738 |
| #1 | 2 | 2 | $1,869 |
| #2 | 2 | 2 | $1,869 |
| Total (2 units) | $3,738 | ||
UW: 25.0% down · 7.5% · 30yr · 1.5% tax · 5.0% vac · 8.0% maint · 8.0% mgmt
Financing live
Cash to close
- Down payment
- $91,998
- Closing costs
- $11,040
- Reserves months
- —
- Total cash needed
- —
Loan-product check · same deal, 3 products live
Conventional
25% down · 7.5% · 30yr
- Down + closing
- —
- Monthly P&I
- —
- Monthly cashflow
- —
- DSCR
- —
- Eligible?
- —
Personal DTI + credit; lowest rate.
DSCR
20% down · 8.5% · 30yr
- Down + closing
- —
- Monthly P&I
- —
- Monthly cashflow
- —
- DSCR
- —
- Eligible?
- —
No personal income docs; deal must DSCR.
Hard money
10% down · 12.0% · 12mo
- Down + closing
- —
- Monthly P&I
- —
- Monthly cashflow
- —
- DSCR
- —
- Eligible?
- —
Short-term bridge; refi at stabilization.
Rent comps 12 comps
| Address | Beds | Baths | Sqft | Rent | $/sqft | DOM | Units | Dist |
|---|---|---|---|---|---|---|---|---|
| 4454 N 199th Ln Buckeye, AZ | 3.0 | 2.5 | 1772 | $2,500 | $1.41 | 1d | 1 | 0.48mi |
| 19958 W Badgett Ln Litchfield Park, AZ | 4.0 | 2.0 | 1831 | $2,500 | $1.37 | 1d | 1 | 0.49mi |
| 5922 N 199th Ln Litchfield Park, AZ | 4.0 | 2.0 | 1831 | $2,495 | $1.36 | 1d | 1 | 0.53mi |
| 19839 W Annika Dr Litchfield Park, AZ | 3.0 | 2.0 | 1729 | $2,100 | $1.21 | 10d | 1 | 0.65mi |
| 19725 W Rancho Dr Litchfield Park, AZ | 3.0 | 2.0 | 1872 | $2,095 | $1.12 | 1d | 1 | 0.75mi |
| 19577 W Palo Verde Dr Litchfield Park, AZ | 3.0 | 2.0 | 1662 | $1,875 | $1.13 | 1d | 1 | 0.95mi |
| 20363 W Sells Dr Buckeye, AZ | 3.0 | 2.0 | 1328 | $2,425 | $1.83 | 1d | 1 | 1.19mi |
| 4454 N 199th Ln Litchfield Park, AZ | 3.0 | 2.5 | 1772 | $2,500 | $1.41 | 18d | 1 | 1.25mi |
| 4412 N 203rd Dr Buckeye, AZ | 3.0 | 2.0 | 1670 | $2,500 | $1.50 | 10d | 1 | 1.26mi |
| 19420 W Highland Ave Litchfield Park, AZ | 3.0 | 2.0 | 1400 | $3,000 | $2.14 | 1d | 1 | 1.43mi |
| 19420 W Coolidge St Litchfield Park, AZ | 3.0 | 2.0 | 1402 | $1,995 | $1.42 | 17d | 1 | 1.48mi |
| 21017 W Glen St Buckeye, AZ | 3.0 | 2.0 | 1531 | $1,790 | $1.17 | 10d | 1 | 1.49mi |
Listing history 13 events
-
2026-06-18days on market $367,990 Active 197 DOM
-
2026-06-17days on market $367,990 Active 196 DOM
-
2026-06-16days on market $367,990 Active 195 DOM
-
2026-06-15days on market $367,990 Active 194 DOM
-
2026-06-13days on market $367,990 Active 192 DOM
-
2026-06-09days on market $367,990 Active 188 DOM
-
2026-06-08days on market $367,990 Active 187 DOM
-
2026-06-07days on market $367,990 Active 186 DOM
-
2026-06-04days on market $367,990 Active 183 DOM
-
2026-06-03days on market $367,990 Active 182 DOM
-
2026-06-02days on market $367,990 Active 181 DOM
-
2026-06-01days on market $367,990 Active 180 DOM
-
2026-05-31days on market $367,990 Active 179 DOM
ⓘ Source: listings_history table (triggers on properties + properties_extension) + one-shot
backfill from property_details.listing_events for pre-trigger history.
Climate risk First Street
- Flood 1/10 Low FEMA zone X (shaded) · 0% chance over 30 yrs
- Wildfire 6/10 Major
- Heat 9/10 Extreme 7 d/yr ≥113°F today · 19 d/yr by 30 yrs out
- Wind 1/10 Low
- Air quality 1/10 Low 0 unhealthy d/yr today · 0 by 30 yrs out
Nearby sold comps map
Loading sold comps map…
Walkable amenities ~0.75 mi
Loading nearby amenities…
Taxation est. · year 1
- Rental income
- $44,856
- − Mortgage interest
- −$20,613
- − Property taxes
- −$5,520
- − Insurance
- −$1,840
- − Repairs & maintenance
- −$3,588
- − Management
- −$3,588
- − Depreciation
- −$10,705
- Taxable loss
- −$999
- Est. tax savings @ 24.0%
- +$240
- After-tax cash flow
- $5,159/yr
For passive investors: Depreciation is non-cash, so a rental often shows a tax loss while cash-flowing — sheltering income. Rental losses are passive: they offset passive income freely, and up to $25,000/yr can offset ordinary (W-2) income if you actively participate and your MAGI is under $100k (phasing out to $0 by $150k); unused losses carry forward. On sale, claimed depreciation is recaptured at up to 25%, and gains may owe capital-gains tax (a 1031 exchange can defer both). Figures are a year-1 estimate at your 24.0% rate — not tax advice; consult a CPA.
Schools (NCES district)
- District
- Litchfield Elementary District (4281)
- NCES district ID
- 0404380
- Math proficiency
- 36% ▼ -20.00%
- Reading proficiency
- 48% ▼ -9.00%
- Median HH income
- $75,649
- Composite
- 38.56/100
- National rank
- #4169
- State rank
- #55 of 249 in AZ
Livability — Buckeye
- Score
- 68/100
- State rank
- #53
- US rank
- #9428
Category grades
Schools grade is shown separately in the Schools card above.
Census & demographics
- Census place
- Buckeye, AZ
- County
- Maricopa County · 4,537,380 people
- City population
- 117,540
- Metro
- Phoenix-Mesa-Chandler, AZ
- Population (ZIP)
- 42,181
- Household income
- $114,056
- Rent vs Own
- Severe rent burden
- 156.0
Population outlook (Maricopa County) Hauer SSP2
- Today (2025)
- 4,979,203 people
- By 2030
- 5,378,229 · +8.0%
- By 2040
- 6,156,598 · +23.6%
- By 2050
- 6,872,376 · +38.0%
- By 2075
- 8,401,270 · +68.7%
- By 2100
- 9,247,439 · +85.7%
Race, ethnicity, and origin ACS 2023
- Neighborhood character
- Diverse neighborhood (Simpson 0.56)
- Race & ethnicity
- White 59% Hispanic / Latino 31% Two or more races 18% Black 4% Asian 2% Native American 1%
- Hispanic origin (detail)
- Mexican 25%
- Common ancestry
- Slovak 4% Portuguese 2% Italian 2%
- Foreign-born
- 8% · Canada, Vietnam
- Languages at home
- 85% English-only · Spanish 12% German/W. Germanic 1% Other Indo-European 1%
Political lean MEDSL · Maricopa
- 2024 margin
- Toss-up / Even · D 47.7% · R 51.2% · Other 1.1%
- 2008→2024 swing
- +7.1pp toward D · 2008: -10.6pp · 2024: -3.5pp
- All cycles
- 2024: R+3.5 2020: D+2.2 2016: R+3.5 2012: R+12.0 2008: R+10.6
Not yet ingested
- Civics
- —
Market trends
- HPI YoY
- ▼ -56.97%
- Current HPI
- 246.4705
- Rent YoY
- ▲ 3.41%
- Metro
- Phoenix-Mesa-Chandler, AZ
- State GDP YoY
- ▲ 4.54%
- F500 in state
- 20
Industry mix (Fortune 500 HQ in AZ)
| Industry | F500 HQs | Revenue |
|---|---|---|
| Technology | 2 | $13B |
|
||
| Mining / Metals | 1 | $23B |
|
||
| Environmental Services | 1 | $16B |
|
||
| Metals / Steel | 1 | $14B |
|
||
| Technology Distribution | 1 | $9B |
|
||
| Homebuilding | 1 | $8B |
|
||
Cash-flow waterfall
monthlySold comps — $/sqft
last 12 mo · ≤1 miLoading sold comps…