 🌊 Lakefront
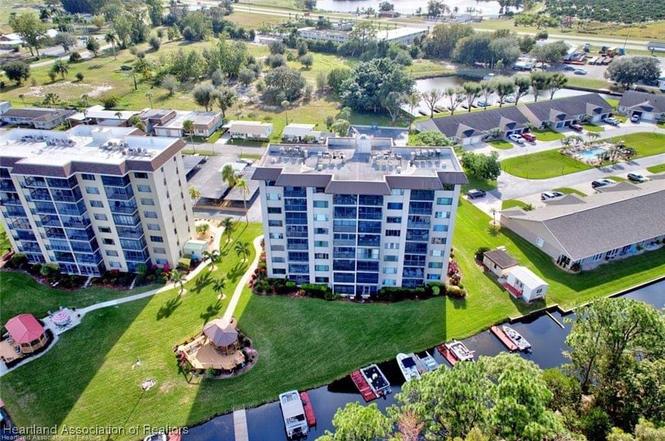
117 Country Club Dr #301 · Lake Placid, FL
Flood risk No data
- FEMA flood zone
- —
- Chance of flooding over 30 yrs
- %
- Est. flood insurance / yr
- —
Fire risk No data
- Est. fire insurance / yr
- —
Heat risk No data
- Hot days now (above °F)
- days/yr
- Hot days in 30 yrs
- days/yr
Wind risk No data
- Chance of severe wind over 30 yrs
- %
Air-quality risk No data
- Unhealthy air days now
- days/yr
- Unhealthy air days in 30 yrs
- days/yr
Risk factors via First Street. Map © Google.
Why this score? — see what drove the C grade
The composite is a weighted blend of 9 inputs, each scored 0–100. Each bar is that input's sub-score; the figure is the points it added to the 100-point composite (weight × sub-score).
- Cash flow +21.6/30.0
- 1% rule +10.0/10.0
- ARV discount +7.5/15.0
- DSCR +6.9/10.0
- Schools +3.6/10.0
- Livability +3.4/5.0
- Rent growth +2.7/5.0
- Condition / age +2.5/5.0
- Appreciation +0.0/10.0
$74,900
🖨 Deal sheet 📄 Offer letter ✓ Due diligence
Listing remarks
Furnished Condo on 3rd floor overlooking Lake Grassy, What a view. Convenient Location , only 10 minute drive to Downtown Lake Placid and 1 hr. 20 minute drive to the Ocean. 2 Bedroom 1 bath Condo in Tower One with your own Carport and Community Pickleball Courts and boat launch located one mile away. Laundry Room on 2nd floor. Building Security Entry Code at night , Community Gazebo, & only Thirty Two Condos in your Building , Four on each floor. . NOTE: * * * Added value $6600 AC Unit installed on roof and unit in 2024 by Miller AC. * * *
Key facts
- Community gazebo
- Laundry room
- Boat launch
Tags
Neighborhood map
What this means for you Summary
Snapshot
- This is a 2-bed/1.0-bath condo listed at $75k.
Deal economics
- At list price, monthly cash flow is $113 ($1k/yr) — positive.
- The deal already cash-flows at list — no discount required.
- Meets the 1% rule at list price ($1k rent vs $75k).
- Recommended offer: $68k (9.0% below list) — sets the bar for market timing.
- Cap rate 8.1% vs local median 3.7% in Lake Placid — top-decile yield for the area; either an underpriced asset or a hidden risk that comps aren't pricing in. Stress-test before assuming the spread holds.
Location & tenants
- Location reads 68/100 on livability (#525 in FL) — a middle-class / working-renter tenant base. Strengths: crime A+, cost of living A+, health & safety A+; Watch: schools D+, amenities F, commute F.
- Highlands (other): math 45% / reading 43% proficiency, ranked #54 of 73 in FL (top 74%) — families likely to look elsewhere, expect single-tenant / working-renter base with shorter leases; 68% free/reduced lunch — lower-income household profile, screen leases tightly.
- Market conditions: Rents flat; 1488 active listings in the ZIP; 980 units permitted in Highlands County in 2024 (80 in 5+ unit buildings).
- This rent runs 32% of the median local income ($54k/yr) — at the standard rent-burdened threshold; future hikes will face affordability resistance.
Forward outlook
- Local home prices are declining (-3.0%/yr); year-one equity from $518 of loan paydown is wiped out by about $2k of value loss. Plan a longer hold.
Negotiation context
- It's been on market 93 days — a 9% lower offer ($68k) is reasonable based on typical stale-listing flexibility.
Risks & watch-outs
- Watch-outs: HOA is 35% of rent.
Questions for the listing agent
- It's been on market 93 days. Have you received any prior offers? Is the seller open to a 9% concession, seller financing, or rate buy-down credit?
- Built in 1973 — when were the roof, HVAC, electrical panel, plumbing, and water heater last replaced?
- What does the HOA fee cover, when was the last increase, and are there any pending special assessments or reserve-fund shortfalls?
- Any open or pending special assessments — roof, HVAC, plumbing, elevator, façade? What's the per-unit balance and payoff schedule, and is the seller paying it off at close or rolling it to the buyer?
- Why hasn't it sold? Are there any deal-killer items the seller is aware of (foundation, flood, title, zoning, code violations)?
- Is there a deadline driving the sale (1031 exchange, divorce, estate, relocation)? That informs how much negotiation room exists.
- Schools are D-rated, which usually means shorter tenancies and higher turnover. Who's the typical renter profile here, and what's been the actual vacancy rate?
- This sits on a lake — are riparian / water-frontage rights deeded with the parcel? Any dock permits, shoreline easements, or HOA water-use restrictions?
- What's the documented flood / surge / shoreline-erosion history here (FEMA AND non-FEMA — e.g., storm surge, creek backup, septic-field saturation)?
- Any water-quality or seasonal algae-bloom issues that affect tenant satisfaction or short-term-rental demand?
- What's the average days-on-market for RENTAL listings here right now (not sales)? A rising rental-DOM trend means longer vacancies and softer asking-rent achievability than the comps imply.
- What's the recent tenant-quality profile in this submarket — average credit score on applications, eviction rate, late-payment / NSF rate, and stable-employment percentage? A property-management company in the area should have these aggregated.
- How much new apartment / multifamily construction is in the pipeline within 1–3 miles? Heavy new supply (>2% of stock underway) typically softens rents 12–24 months out; light construction supports rent growth.
Investment metrics
- 1% rule
- 1.91% ✓
- Cap rate
- 8.11%
- Cash-on-cash
- 6.48%
- DSCR
- 1.29
- GRM
- 4.4
CMA / ARV
No comps found within radius.
Projected returns pro-forma
-3.0% appreciation · 0.82% rent growth · sell at horizon
- IRR
- -10.4%
- Equity multiple
- 0.63×
- Total profit
- $-7,672
- Equity at exit
- $11,168
- IRR
- -7.4%
- Equity multiple
- 0.61×
- Total profit
- $-8,132
- Equity at exit
- $6,476
Cash invested: $20,972 (down + closing). Projections, not guarantees.
Landlord ↔ Tenant lean methodology
- Overall (STATE)
- 87 Strongly Landlord-Friendly
- State Florida
- 87 Strongly Landlord-Friendly · R+3
- County
- — inherits STATE
- City
- — inherits STATE
ZIP-level market 33852
- Rents YoY
- 0.8%
- Active inventory
- 1488
- Price-to-rent
- 4.4×
Monthly cashflow live
- Estimated rent
- $1,431 medium interval (Pro) →
- Mortgage (P&I)
- −$393
- Tax est. 1.5%
- −$94 /mo · $1,124/yr
- Insurance
- −$31
- HOA
- −$500
- Vacancy / Maint / Mgmt
- −$301
- Net cashflow
- $113
Break-even live
UW: 25.0% down · 7.5% · 30yr · 1.5% tax · 5.0% vac · 8.0% maint · 8.0% mgmt
Financing live
Cash to close
- Down payment
- $18,725
- Closing costs
- $2,247
- Reserves months
- —
- Total cash needed
- —
Loan-product check · same deal, 3 products live
Conventional
25% down · 7.5% · 30yr
- Down + closing
- —
- Monthly P&I
- —
- Monthly cashflow
- —
- DSCR
- —
- Eligible?
- —
Personal DTI + credit; lowest rate.
DSCR
20% down · 8.5% · 30yr
- Down + closing
- —
- Monthly P&I
- —
- Monthly cashflow
- —
- DSCR
- —
- Eligible?
- —
No personal income docs; deal must DSCR.
Hard money
10% down · 12.0% · 12mo
- Down + closing
- —
- Monthly P&I
- —
- Monthly cashflow
- —
- DSCR
- —
- Eligible?
- —
Short-term bridge; refi at stabilization.
HOA detail condo
- Monthly dues
- $500 · $6,000/yr
- Likely covers
- security
- Assessments
- None detected in remarks — confirm with the listing agent.
Listing history 7 events
-
2026-06-19days on market $74,900 Active 93 DOM
-
2026-06-18days on market $74,900 Active 92 DOM
-
2026-06-17days on market $74,900 Active 91 DOM
-
2026-06-16days on market $74,900 Active 90 DOM
-
2026-06-15days on market $74,900 Active 89 DOM
-
2026-06-14remarks 555-char remark
-
2026-06-14$74,900 Active 87 DOM
ⓘ Source: listings_history table (triggers on properties + properties_extension) + one-shot
backfill from property_details.listing_events for pre-trigger history.
Nearby sold comps map
Loading sold comps map…
Walkable amenities ~0.75 mi
Loading nearby amenities…
Taxation est. · year 1
- Rental income
- $17,177
- − Mortgage interest
- −$4,196
- − Property taxes
- −$1,124
- − Insurance
- −$374
- − Repairs & maintenance
- −$1,374
- − Management
- −$1,374
- − HOA
- −$6,000
- − Depreciation
- −$2,179
- Taxable income
- $556
- Est. tax owed @ 24.0%
- −$133
- After-tax cash flow
- $1,225/yr
For passive investors: Depreciation is non-cash, so a rental often shows a tax loss while cash-flowing — sheltering income. Rental losses are passive: they offset passive income freely, and up to $25,000/yr can offset ordinary (W-2) income if you actively participate and your MAGI is under $100k (phasing out to $0 by $150k); unused losses carry forward. On sale, claimed depreciation is recaptured at up to 25%, and gains may owe capital-gains tax (a 1031 exchange can defer both). Figures are a year-1 estimate at your 24.0% rate — not tax advice; consult a CPA.
Schools (NCES district)
- District
- Highlands
- NCES district ID
- 1200840
- Math proficiency
- 45% ▼ -7.00%
- Reading proficiency
- 43% ▼ -3.00%
- Median HH income
- $35,276
- Composite
- 36.42/100
- National rank
- #4672
- State rank
- #54 of 73 in FL
Livability — Lake Placid
- Score
- 68/100
- State rank
- #525
- US rank
- #9813
Category grades
Schools grade is shown separately in the Schools card above.
Census & demographics
- County
- Highlands County · 98,898 people
- City population
- 22,600
- Metro
- Sebring-Avon Park, FL
- Population (ZIP)
- 22,600
- Household income
- $54,284
- Rent vs Own
- Severe rent burden
- 439.0
Population outlook (Highlands County) Hauer SSP2
- Today (2025)
- 99,674 people
- By 2030
- 99,615 · -0.1%
- By 2040
- 99,342 · -0.3%
- By 2050
- 98,242 · -1.4%
- By 2075
- 93,291 · -6.4%
- By 2100
- 79,894 · -19.8%
Race, ethnicity, and origin ACS 2023
- Neighborhood character
- Predominantly White (68%)
- Race & ethnicity
- White 68% Hispanic / Latino 22% Two or more races 11% Black 6% Asian 1%
- Hispanic origin (detail)
- Mexican 11% Puerto Rican 3% Cuban 3%
- Common ancestry
- Lithuanian 2% Slovak 2% Iranian 1%
- Foreign-born
- 14% · Canada, Dominican Republic
- Languages at home
- 79% English-only · Spanish 19% Tagalog/Filipino 1%
Political lean MEDSL · Highlands
- 2024 margin
- Solid R (+40.8) · D 29.3% · R 70.1%
- 2008→2024 swing
- -22.7pp toward R · 2008: -18.1pp · 2024: -40.8pp
- All cycles
- 2024: R+40.8 2020: R+34.4 2016: R+32.0 2012: R+23.0 2008: R+18.1
Not yet ingested
- Civics
- —
Market trends
- HPI YoY
- ▼ -203.31%
- Current HPI
- 224.8693
- Rent YoY
- ▲ 0.82%
- Metro
- Sebring-Avon Park, FL
- State GDP YoY
- ▲ 3.28%
- F500 in state
- 36
Industry mix (Fortune 500 HQ in FL)
| Industry | F500 HQs | Revenue |
|---|---|---|
| Industrial Technology | 2 | $29B |
|
||
| Insurance | 2 | $17B |
|
||
| Retail | 1 | $60B |
|
||
| Technology Distribution | 1 | $58B |
|
||
| Homebuilding | 1 | $35B |
|
||
| Technology Manufacturing | 1 | $35B |
|
||
Cash-flow waterfall
monthlySold comps — $/sqft
last 12 mo · ≤1 miLoading sold comps…