 🔨 Auction
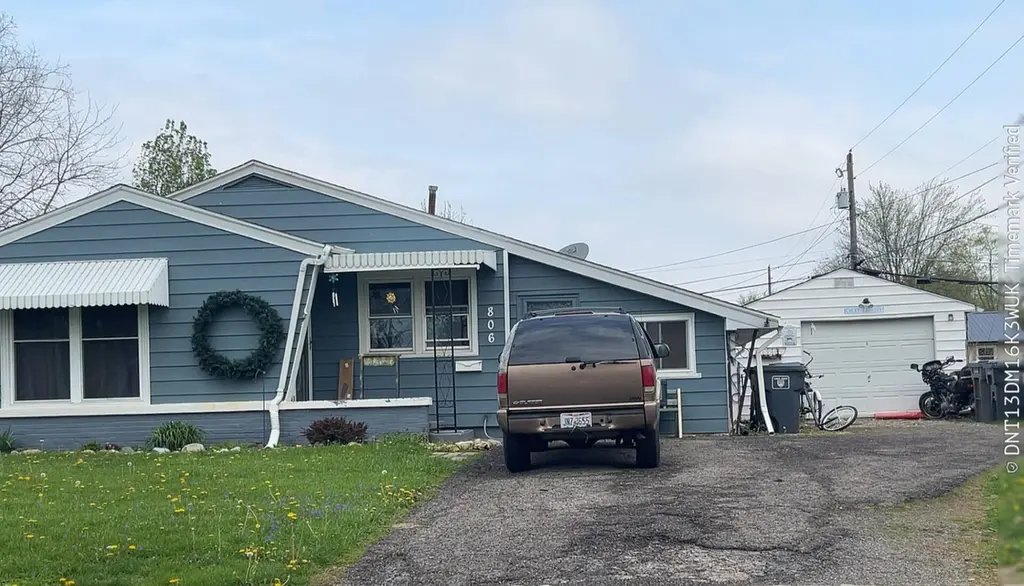
806 Ewing Ave · Lima, OH
Flood risk 1/10 · Minimal
- FEMA flood zone
- X (unshaded)
- Chance of flooding over 30 yrs
- 0.0%
- Est. flood insurance / yr
- $473 – $860
Fire risk 1/10 · Minimal
- Est. fire insurance / yr
- $713 – $1,323
Heat risk 3/10 · Minor
- Hot days now (above 100°F)
- 7 days/yr
- Hot days in 30 yrs
- 18 days/yr
Wind risk 2/10 · Minimal
- Chance of severe wind over 30 yrs
- —
Air-quality risk 2/10 · Minimal
- Unhealthy air days now
- 1 days/yr
- Unhealthy air days in 30 yrs
- 2 days/yr
Risk factors via First Street. Map © Google.
Why this score? — see what drove the D- grade
The composite is a weighted blend of 9 inputs, each scored 0–100. Each bar is that input's sub-score; the figure is the points it added to the 100-point composite (weight × sub-score).
- Cash flow +13.5/30.0
- ARV discount +7.5/15.0
- DSCR +4.1/10.0
- 1% rule +3.8/10.0
- Livability +3.2/5.0
- Schools +2.6/10.0
- Rent growth +2.5/5.0
- Condition / age +2.5/5.0
- Appreciation +0.0/10.0
$1
🖨 Deal sheet 📄 Offer letter ✓ Due diligence
Listing remarks MLS
The list price is not indicative of seller's final reserve amount. This property is part of an online bidding event; please visit Auction.com to place bids. Inspections of this property and contact with occupants are strictly prohibited. Property is sold 'as is' and no for sale sign allowed.
Key facts
- 8,712 sq ft lot
- Garage
- Built 1956
Neighborhood map
What this means for you Summary
Snapshot
- This is a 3-bed/1.0-bath single-family listed at $1.
Deal economics
- At list price, monthly cash flow is $5 ($56/yr) — positive.
- The deal already cash-flows at list — no discount required.
- Meets the 1% rule at list price ($1k rent vs $1).
Location & tenants
- Location reads 64/100 on livability (#787 in OH) — a middle-class / working-renter tenant base. Strengths: cost of living A+, housing A+, health & safety A-; Watch: crime F, amenities F, commute F.
- Lima City (urban): math 29% / reading 36% proficiency, ranked #575 of 656 in OH (top 88%) — families likely to look elsewhere, expect single-tenant / working-renter base with shorter leases; 83% free/reduced lunch — lower-income household profile, screen leases tightly.
- Market conditions: 74 active listings in the ZIP; 3 comparable units currently listed for rent nearby; rentals lingering (median 44d on market — plan ~5-8 weeks vacancy on turnover, expect pricing pressure); 100% of comp listings sitting > 30 days — soft ceiling on asking rent; 88 units permitted in Allen County in 2024 (0 in 5+ unit buildings).
Forward outlook
- Local home prices are declining (-3.0%/yr); year-one equity from $1k of loan paydown is wiped out by about $4k of value loss. Plan a longer hold.
- Allen County population projected at -14% by 2050 — secular population decline; favor cash flow + early exit over multi-decade hold.
Negotiation context
- It's been on market 26 days — a 2% lower offer ($0) is reasonable based on typical stale-listing flexibility.
Risks & watch-outs
- Watch-outs: property tax is 217669.9% of price; built in 1956 — expect roof / HVAC / electrical / plumbing capex.
Questions for the listing agent
- Built in 1956 — when were the roof, HVAC, electrical panel, plumbing, and water heater last replaced?
- Property tax is high relative to price — has the assessment been appealed recently, and will the sale trigger a re-assessment?
- Is there a deadline driving the sale (1031 exchange, divorce, estate, relocation)? That informs how much negotiation room exists.
- Crime grade is F in this area — have there been break-ins, vandalism, or insurance claims at this property in the last 3 years? What carrier currently insures it and at what premium?
- The area grade is low — what's the realistic commute time and amenity access for the typical tenant pool here? Any planned neighborhood developments (good or bad) we should know about?
- What's the average days-on-market for RENTAL listings here right now (not sales)? A rising rental-DOM trend means longer vacancies and softer asking-rent achievability than the comps imply.
- What's the recent tenant-quality profile in this submarket — average credit score on applications, eviction rate, late-payment / NSF rate, and stable-employment percentage? A property-management company in the area should have these aggregated.
- How much new for-sale + rental construction is in the pipeline within 1–3 miles? Heavy new supply typically softens prices + rents 12–24 months out; constrained supply supports both.
Investment metrics
- 1% rule
- 0.88% ✗
- Cap rate
- 6.33%
- Cash-on-cash
- 0.14%
- DSCR
- 1.01
- GRM
- 9.5
CMA / ARV
- ARV (median comp)
- $145,113
- List price
- $1
- Delta
- -100.00%
- Verdict
- UNDERPRICED
- Comps
- 20 within 1.0 mi
Show comp detail 12 sales within ~0.75 mi
| Address | Dist | Beds/Ba | Sqft | Sold | Price | $/sf | Match |
|---|---|---|---|---|---|---|---|
| 806 Ewing Ave | 0.00mi | 3/1.0 | 992 (0%) | 1mo | $31,000 | $31 | 99 |
| 1120 Melrose St | 0.13mi | 3/1.0 | 1,040 (+5%) | 2mo | $165,000 | $159 | 85 |
| 638 Hazel Ave | 0.28mi | 2/1.5 (-1) | 960 (-3%) | 1mo | $130,000 | $135 | 74 |
| 1027 Sherman Ave | 0.30mi | 3/1.0 | 1,052 (+6%) | 4mo | $130,000 | $124 | 73 |
| 809 Rice Ave | 0.38mi | 2/1.0 (-1) | 936 (-6%) | 1mo | $60,000 | $64 | 67 |
| 760 W O'connor Ave | 0.39mi | 3/1.5 | 920 (-7%) | 2mo | $125,000 | $136 | 66 |
| 923 Burch Ave | 0.49mi | 2/1.0 (-1) | 1,029 (+4%) | 0mo | $142,000 | $138 | 66 |
| 1245 Latham Ave | 0.48mi | 3/1.0 | 1,066 (+8%) | 1mo | $145,000 | $136 | 64 |
| 1407 Latham Ave | 0.55mi | 3/1.0 | 1,066 (+8%) | 2mo | $130,000 | $122 | 60 |
| 608 W O'connor Ave | 0.51mi | 2/1.0 (-1) | 896 (-10%) | 3mo | $79,500 | $89 | 53 |
| 753 Brice Ave | 0.58mi | 3/1.5 | 1,108 (+12%) | 3mo | $85,000 | $77 | 49 |
| 1317 Virginia Ave | 0.73mi | 2/1.0 (-1) | 920 (-7%) | 3mo | $144,000 | $157 | 46 |
Match score weights: distance 35% · size 25% · config 20% · recency 20%. Top-matched comps best support the ARV.
Projected returns pro-forma
-3.0% appreciation · 3.0% rent growth · sell at horizon
- IRR
- -16.1%
- Equity multiple
- 0.43×
- Total profit
- $-23,200
- Equity at exit
- $21,637
- IRR
- -7.7%
- Equity multiple
- 0.51×
- Total profit
- $-19,744
- Equity at exit
- $12,547
Cash invested: $40,632 (down + closing). Projections, not guarantees.
Landlord ↔ Tenant lean methodology
- Overall (STATE)
- 73 Landlord-Friendly
- State Ohio
- 73 Landlord-Friendly · R+6
- County
- — inherits STATE
- City
- — inherits STATE
ZIP-level market 45801
- Active inventory
- 74
Monthly cashflow live
- Estimated rent
- $1,275 medium interval (Pro) →
- Mortgage (P&I)
- −$761
- Tax est. 1.5%
- −$181 /mo · $2,177/yr
- Insurance
- −$60
- HOA
- −$0
- Vacancy / Maint / Mgmt
- −$268
- Net cashflow
- $5
Break-even live
UW: 25.0% down · 7.5% · 30yr · 1.5% tax · 5.0% vac · 8.0% maint · 8.0% mgmt
Financing live
Cash to close
- Down payment
- $36,278
- Closing costs
- $4,353
- Reserves months
- —
- Total cash needed
- —
Loan-product check · same deal, 3 products live
Conventional
25% down · 7.5% · 30yr
- Down + closing
- —
- Monthly P&I
- —
- Monthly cashflow
- —
- DSCR
- —
- Eligible?
- —
Personal DTI + credit; lowest rate.
DSCR
20% down · 8.5% · 30yr
- Down + closing
- —
- Monthly P&I
- —
- Monthly cashflow
- —
- DSCR
- —
- Eligible?
- —
No personal income docs; deal must DSCR.
Hard money
10% down · 12.0% · 12mo
- Down + closing
- —
- Monthly P&I
- —
- Monthly cashflow
- —
- DSCR
- —
- Eligible?
- —
Short-term bridge; refi at stabilization.
Rent comps 3 comps
| Address | Beds | Baths | Sqft | Rent | $/sqft | DOM | Units | Dist |
|---|---|---|---|---|---|---|---|---|
| 1014 W Market St Apt 3 Lima, OH | 2.0 | 1.0 | 800 | $1,400 | $1.75 | 43d | 1 | 0.84mi |
| 545 W Market St Unit 340 1/2 Mcpheron Lima, OH | 2.0 | 1.0 | 900 | $800 | $0.89 | 43d | 1 | 0.96mi |
| 43 Town Sq Lima, OH | 2.0–3.0 | 1.0–2.0 | 1100 | $1,413 | $1.28 | 43d | 9 | 1.15mi |
Listing history 3 events
-
2026-05-11status Pending 292-char remark
Show marketing remark (292 chars)
The list price is not indicative of seller's final reserve amount. This property is part of an online bidding event; please visit Auction.com to place bids. Inspections of this property and contact with occupants are strictly prohibited. Property is sold 'as is' and no for sale sign allowed.
-
2026-04-01$1 Active 292-char remark
Show marketing remark (292 chars)
The list price is not indicative of seller's final reserve amount. This property is part of an online bidding event; please visit Auction.com to place bids. Inspections of this property and contact with occupants are strictly prohibited. Property is sold 'as is' and no for sale sign allowed.
-
2000-04-17soldstatus $53,500
ⓘ Source: listings_history table (triggers on properties + properties_extension) + one-shot
backfill from property_details.listing_events for pre-trigger history.
Climate risk First Street
- Flood 1/10 Low FEMA zone X (unshaded) · 0% chance over 30 yrs
- Wildfire 1/10 Low
- Heat 3/10 Moderate 7 d/yr ≥100°F today · 18 d/yr by 30 yrs out
- Wind 2/10 Low
- Air quality 2/10 Low 1 unhealthy d/yr today · 2 by 30 yrs out
Nearby sold comps map
Loading sold comps map…
Walkable amenities ~0.75 mi
Loading nearby amenities…
Taxation est. · year 1
- Rental income
- $15,303
- − Mortgage interest
- −$8,129
- − Property taxes
- −$2,177
- − Insurance
- −$726
- − Repairs & maintenance
- −$1,224
- − Management
- −$1,224
- − Depreciation
- −$4,221
- Taxable loss
- −$2,397
- Est. tax savings @ 24.0%
- +$575
- After-tax cash flow
- $631/yr
For passive investors: Depreciation is non-cash, so a rental often shows a tax loss while cash-flowing — sheltering income. Rental losses are passive: they offset passive income freely, and up to $25,000/yr can offset ordinary (W-2) income if you actively participate and your MAGI is under $100k (phasing out to $0 by $150k); unused losses carry forward. On sale, claimed depreciation is recaptured at up to 25%, and gains may owe capital-gains tax (a 1031 exchange can defer both). Figures are a year-1 estimate at your 24.0% rate — not tax advice; consult a CPA.
Schools (NCES district)
- District
- Lima City
- NCES district ID
- 3904422
- Math proficiency
- 29% ▼ -13.00%
- Reading proficiency
- 36% ▼ -6.00%
- Median HH income
- $29,685
- Composite
- 26.31/100
- National rank
- #7243
- State rank
- #575 of 656 in OH
Livability — Lima
- Score
- 64/100
- State rank
- #787
- US rank
- #14288
Category grades
Schools grade is shown separately in the Schools card above.
Census & demographics
- Census place
- Lima, OH
- County
- Allen County · 21,739 people
- City population
- 21,739
- Metro
- Lima, OH
- Population (ZIP)
- 21,739
- Household income
- $51,731
- Rent vs Own
- Severe rent burden
- 1141.0
Population outlook (Allen County) Hauer SSP2
- Today (2025)
- 100,321 people
- By 2030
- 97,693 · -2.6%
- By 2040
- 91,802 · -8.5%
- By 2050
- 86,152 · -14.1%
- By 2075
- 73,659 · -26.6%
- By 2100
- 58,716 · -41.5%
Race, ethnicity, and origin ACS 2023
- Neighborhood character
- Predominantly White (71%)
- Race & ethnicity
- White 71% Black 14% Two or more races 8% Hispanic / Latino 6% Asian 1%
- Hispanic origin (detail)
- Mexican 5%
- Common ancestry
- Lithuanian 2% Italian 1% Iranian 1%
- Foreign-born
- 2% · Canada, China
- Languages at home
- 96% English-only · Spanish 2%
Political lean MEDSL · Allen
- 2024 margin
- Solid R (+44.1) · D 27.5% · R 71.6%
- 2008→2024 swing
- -23.4pp toward R · 2008: -20.7pp · 2024: -44.1pp
- All cycles
- 2024: R+44.1 2020: R+39.5 2016: R+38.2 2012: R+25.7 2008: R+20.7
Not yet ingested
- Civics
- —
Market trends
- HPI YoY
- ▼ -164.79%
- Current HPI
- 219.5329
- Rent YoY
- —
- Metro
- Lima, OH
- State GDP YoY
- ▲ 1.98%
- F500 in state
- 48
Industry mix (Fortune 500 HQ in OH)
| Industry | F500 HQs | Revenue |
|---|---|---|
| Insurance | 3 | $145B |
|
||
| Industrial Machinery | 3 | $49B |
|
||
| Financial Services | 3 | $24B |
|
||
| Consumer Goods | 2 | $93B |
|
||
| Aerospace / Defense | 2 | $47B |
|
||
| Utilities | 2 | $33B |
|
||
Price history
3 events — show timeline
- 2026-05-11 Pending — WRIST
- 2026-04-01 Listed $1 WRIST
- 2000-04-17 Sold (Public Records) $53,500 Public Records
Property tax history
+1.0%/yrLatest (2025): $1,136 · +0.0% YoY. Source: county tax records.
Cash-flow waterfall
monthlySold comps — $/sqft
last 12 mo · ≤1 miLoading sold comps…