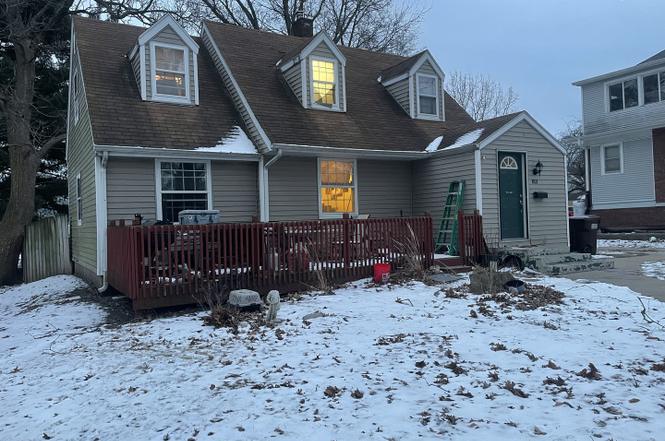
821 N 8th St · Rochelle, IL
Flood risk 1/10 · Minimal
- FEMA flood zone
- X (unshaded)
- Chance of flooding over 30 yrs
- 0.0%
- Est. flood insurance / yr
- $473 – $860
Fire risk 1/10 · Minimal
- Est. fire insurance / yr
- $804 – $1,492
Heat risk 3/10 · Minor
- Hot days now (above 102°F)
- 7 days/yr
- Hot days in 30 yrs
- 15 days/yr
Wind risk 2/10 · Minimal
- Chance of severe wind over 30 yrs
- 0.0%
Air-quality risk 2/10 · Minimal
- Unhealthy air days now
- 1 days/yr
- Unhealthy air days in 30 yrs
- 2 days/yr
Risk factors via First Street. Map © Google.
Why this score? — see what drove the C- grade
The composite is a weighted blend of 9 inputs, each scored 0–100. Each bar is that input's sub-score; the figure is the points it added to the 100-point composite (weight × sub-score).
- Cash flow +15.5/30.0
- ARV discount +15.0/15.0
- 1% rule +5.5/10.0
- DSCR +4.8/10.0
- Livability +3.3/5.0
- Rent growth +2.5/5.0
- Schools +2.5/10.0
- Condition / age +2.5/5.0
- Appreciation +0.0/10.0
$147,500
🖨 Deal sheet (PDF) 📄 Offer letter ✓ Due diligence
Listing remarks
Steal of a deal in Rochelle! 821 N 8th St is the perfect blend of affordability and opportunity. Investors can capitalize on a light cosmetic value-add, while homeowners can secure a discounted home without major renovations. Solid bones, great potential, and priced to attract serious buyers looking for instant equity.
Key facts
- 8,712 sq ft lot
- Garage
- Built 1940
Property features AI
Finance
- Other: Directions: Hwy. 251 to 5th Ave to 8th St; Township: Flagg; Corporate limits: Rochelle
- HOA & community: No master association fee required; Community features include curbs, sidewalks, street lights and paved streets
Exterior
- Parking: Detached garage (garage owned) with approximately 1.5 garage/total parking spaces
- Security: CO detectors
- Utilities: Public water; Public sewer
- Home design: Detached single-family home; 1.5-story; Fee simple ownership; Built before 1978
- Construction: Vinyl siding; Asphalt roof; Estimated living area; Property age: approximately 81–90 years
- Exterior features: Deck; Patio; Fenced yard
Interior
- Kitchen: Range; Microwave; Dishwasher; Refrigerator; Disposal
- Bedrooms: Master bedroom on main level (includes full bath); Three additional bedrooms on second level (11 x 14; 10 x 12; 9 x 9)
- Flooring: Hardwood flooring in living room, dining room and three second-floor bedrooms; Carpet in family room and master bedroom; Vinyl in kitchen and enclosed porch
- Bathrooms: Two full bathrooms
- Heating & cooling: Natural gas heating; Central air conditioning; CO detectors; Ceiling fans
- Interior features: Partially finished basement with crawl space; Separate dining room; 8 total rooms; Enclosed porch
- Laundry & utility: Laundry room; Owned water softener
Neighborhood map
What this means for you Summary
Snapshot
- This is a 4-bed/2.0-bath single-family listed at $148k.
Deal economics
- At list price, monthly cash flow is $58 ($698/yr) — positive.
- The deal already cash-flows at list — no discount required.
- Meets the 1% rule at list price ($2k rent vs $148k).
- Recommended offer: $134k (9.0% below list) — sets the bar for market timing.
Location & tenants
- Location reads 66/100 on livability (#588 in IL) — a middle-class / working-renter tenant base. Strengths: cost of living A+, housing A+, health & safety A+; Watch: amenities F, commute F, employment D-.
- Rochelle Twp Hsd 212 (rural): math 25% / reading 25% proficiency, ranked #608 of 919 in IL (top 66%) — low school quality limits family demand, transient renter base, plan for 1-2y turnover.
- Zoned schools: Rochelle Middle School (math 12% / reading 24%, grade F, #444 of 665 statewide, top 67%, 474 students, 0% FRL); Rochelle Twp High School (math 22% / reading 22%, grade F, #319 of 693 statewide, top 50%, 863 students, 0% FRL).
- Market conditions: 44 active listings in the ZIP; 113 units permitted in Ogle County in 2024 (67 in 5+ unit buildings).
Forward outlook
- Local home prices are declining (-3.0%/yr); year-one equity from $1k of loan paydown is wiped out by about $4k of value loss. Plan a longer hold.
- Ogle County population projected at -24% by 2050 — secular population decline; favor cash flow + early exit over multi-decade hold.
Negotiation context
- It's been on market 91 days — a 9% lower offer ($134k) is reasonable based on typical stale-listing flexibility.
- Current owner paid $127k; 16% above their basis — modest negotiation headroom, anchor on the comps not their cost.
Risks & watch-outs
- Watch-outs: property tax is 2.7% of price; built in 1940 — expect roof / HVAC / electrical / plumbing capex.
Questions for the listing agent
- It's been on market 91 days. Have you received any prior offers? Is the seller open to a 9% concession, seller financing, or rate buy-down credit?
- Built in 1940 — when were the roof, HVAC, electrical panel, plumbing, and water heater last replaced?
- Property tax is high relative to price — has the assessment been appealed recently, and will the sale trigger a re-assessment?
- Why hasn't it sold? Are there any deal-killer items the seller is aware of (foundation, flood, title, zoning, code violations)?
- Is there a deadline driving the sale (1031 exchange, divorce, estate, relocation)? That informs how much negotiation room exists.
- Schools are F-rated, which usually means shorter tenancies and higher turnover. Who's the typical renter profile here, and what's been the actual vacancy rate?
- What's the average days-on-market for RENTAL listings here right now (not sales)? A rising rental-DOM trend means longer vacancies and softer asking-rent achievability than the comps imply.
- What's the recent tenant-quality profile in this submarket — average credit score on applications, eviction rate, late-payment / NSF rate, and stable-employment percentage? A property-management company in the area should have these aggregated.
- How much new for-sale + rental construction is in the pipeline within 1–3 miles? Heavy new supply typically softens prices + rents 12–24 months out; constrained supply supports both.
Investment metrics
- 1% rule
- 1.05% ✓
- Cap rate
- 6.77%
- Cash-on-cash
- 1.69%
- DSCR
- 1.08
- GRM
- 8.0
CMA / ARV
- ARV (on-the-fly)
- $179,322
- Comps found
- 12
Show comp detail 12 sales within ~0.75 mi
| Address | Dist | Beds/Ba | Sqft | Sold | Price | $/sf | Match |
|---|---|---|---|---|---|---|---|
| 826 N 3rd St | 0.29mi | 4/1.5 | 1,499 (+1%) | 4mo | $170,000 | $113 | 79 |
| 817 N 7th St | 0.07mi | 3/1.5 (-1) | 1,387 (-6%) | 5mo | $168,500 | $121 | 75 |
| 620 N 9th St | 0.16mi | 4/1.5 | 1,396 (-6%) | 8mo | $187,000 | $134 | 75 |
| 500 Woolf Ct | 0.42mi | 3/1.0 (-1) | 1,464 (-1%) | 3mo | $164,900 | $113 | 67 |
| 1116 Carrie Ave | 0.65mi | 3/2.0 (-1) | 1,488 (+0%) | 3mo | $255,000 | $171 | 61 |
| 1255 Westview Dr | 0.43mi | 3/1.0 (-1) | 1,386 (-6%) | 0mo | $197,500 | $142 | 60 |
| 128 S 8th St | 0.62mi | 3/1.0 (-1) | 1,446 (-2%) | 0mo | $162,000 | $112 | 58 |
| 1002 W 1st Ave | 0.59mi | 3/2.0 (-1) | 1,526 (+3%) | 6mo | $148,470 | $97 | 57 |
| 1210 Lincoln Ave | 0.51mi | 3/1.5 (-1) | 1,545 (+4%) | 8mo | $165,000 | $107 | 56 |
| 206 Joanne Ln | 0.55mi | 3/2.0 (-1) | 1,554 (+5%) | 7mo | $257,900 | $166 | 55 |
| 1170 Westview Dr | 0.45mi | 3/1.0 (-1) | 1,368 (-8%) | 4mo | $190,000 | $139 | 54 |
| 221 N 9th St | 0.43mi | 3/1.0 (-1) | 1,282 (-14%) | 2mo | $130,000 | $101 | 47 |
Match score weights: distance 35% · size 25% · config 20% · recency 20%. Top-matched comps best support the ARV.
Projected returns pro-forma
-3.0% appreciation · 3.0% rent growth · sell at horizon
- IRR
- -13.5%
- Equity multiple
- 0.51×
- Total profit
- $-20,087
- Equity at exit
- $21,993
- IRR
- -4.5%
- Equity multiple
- 0.70×
- Total profit
- $-12,270
- Equity at exit
- $12,753
Cash invested: $41,300 (down + closing). Projections, not guarantees.
Landlord ↔ Tenant lean methodology
- Overall (STATE)
- 43 Moderately Tenant-Leaning
- State Illinois
- 43 Moderately Tenant-Leaning · D+7
- County
- — inherits STATE
- City
- — inherits STATE
ZIP-level market 61068
- Active inventory
- 44
- Price-to-rent
- 8.0×
Monthly cashflow live
- Estimated rent
- $1,545 medium interval (Pro) →
- Mortgage (P&I)
- −$774
- Tax from tax record
- −$328 /mo · $3,933/yr
- Insurance
- −$61
- HOA
- −$0
- Vacancy / Maint / Mgmt
- −$325
- Net cashflow
- $58
Break-even live
Sensitivity live
| Price | -10% $142 | -5% $100 | +0% $58 | +5% $16 | +10% $-25 |
|---|---|---|---|---|---|
| Rent | -10% $-64 | -5% $-3 | +0% $58 | +5% $119 | +10% $180 |
| Rate | -1.0pp $132 | -0.5pp $96 | base $58 | +0.5pp $20 | +1.0pp $-19 |
UW: 25.0% down · 7.5% · 30yr · 1.5% tax · 5.0% vac · 8.0% maint · 8.0% mgmt
Financing live
Cash to close
- Down payment
- $36,875
- Closing costs
- $4,425
- Reserves months
- —
- Total cash needed
- —
Loan-product check · same deal, 3 products live
Conventional
25% down · 7.5% · 30yr
- Down + closing
- —
- Monthly P&I
- —
- Monthly cashflow
- —
- DSCR
- —
- Eligible?
- —
Personal DTI + credit; lowest rate.
DSCR
20% down · 8.5% · 30yr
- Down + closing
- —
- Monthly P&I
- —
- Monthly cashflow
- —
- DSCR
- —
- Eligible?
- —
No personal income docs; deal must DSCR.
Hard money
10% down · 12.0% · 12mo
- Down + closing
- —
- Monthly P&I
- —
- Monthly cashflow
- —
- DSCR
- —
- Eligible?
- —
Short-term bridge; refi at stabilization.
Listing history 6 events
-
2026-05-22status Pending
-
2026-03-17price $147,500
-
2026-02-26price $153,500
-
2026-02-20$155,000 Active
-
2017-09-12soldstatus $126,650
-
2014-11-22historical
ⓘ Source: listings_history table (triggers on properties + properties_extension) + one-shot
backfill from property_details.listing_events for pre-trigger history.
Tax reassessment forecast IL · Partial reset (capped growth)
- Current annual tax
- $3,933 · $328/mo
- Projected year-2 tax
- $3,933 · $328/mo
- Expected delta
- $0/yr ($0/mo · 0.0%)
ⓘ Screening estimate from a state-policy table — verify with the county assessor before closing.
Climate risk First Street
- Flood 1/10 Low FEMA zone X (unshaded) · 0% chance over 30 yrs
- Wildfire 1/10 Low
- Heat 3/10 Moderate 7 d/yr ≥102°F today · 15 d/yr by 30 yrs out
- Wind 2/10 Low 0% chance of damaging wind over 30 yrs
- Air quality 2/10 Low 1 unhealthy d/yr today · 2 by 30 yrs out
Nearby sold comps map
Loading sold comps map…
Walkable amenities ~0.75 mi
Loading nearby amenities…
Taxation est. · year 1
- Rental income
- $18,544
- − Mortgage interest
- −$8,262
- − Property taxes
- −$3,933
- − Insurance
- −$738
- − Repairs & maintenance
- −$1,484
- − Management
- −$1,484
- − Depreciation
- −$4,291
- Taxable loss
- −$1,646
- Est. tax savings @ 24.0%
- +$395
- After-tax cash flow
- $1,093/yr
For passive investors: Depreciation is non-cash, so a rental often shows a tax loss while cash-flowing — sheltering income. Rental losses are passive: they offset passive income freely, and up to $25,000/yr can offset ordinary (W-2) income if you actively participate and your MAGI is under $100k (phasing out to $0 by $150k); unused losses carry forward. On sale, claimed depreciation is recaptured at up to 25%, and gains may owe capital-gains tax (a 1031 exchange can defer both). Figures are a year-1 estimate at your 24.0% rate — not tax advice; consult a CPA.
Schools (NCES district)
- District
- Rochelle Twp Hsd 212
- NCES district ID
- 1734290
- Math proficiency
- 25% ▬ 0.00%
- Reading proficiency
- 25% ▼ -5.00%
- Median HH income
- $48,343
- Composite
- 24.94/100
- National rank
- #12981
- State rank
- #608 of 919 in IL
Livability — Rochelle
- Score
- 66/100
- State rank
- #588
- US rank
- #12244
Category grades
Schools grade is shown separately in the Schools card above.
Census & demographics
- Census place
- Rochelle, IL
- Population (ZIP)
- 15,076
Population outlook (Ogle County) Hauer SSP2
- Today (2025)
- 48,390 people
- By 2030
- 46,346 · -4.2%
- By 2040
- 41,772 · -13.7%
- By 2050
- 36,911 · -23.7%
- By 2075
- 27,130 · -43.9%
- By 2100
- 18,627 · -61.5%
Race, ethnicity, and origin ACS 2023
- Neighborhood character
- Predominantly White (68%)
- Race & ethnicity
- White 68% Hispanic / Latino 26% Two or more races 15% Black 3% Native American 1%
- Hispanic origin (detail)
- Mexican 23% Puerto Rican 2%
- Common ancestry
- Portuguese 3% Romanian 2% Slovak 2%
- Foreign-born
- 9% · Canada
- Languages at home
- 83% English-only · Spanish 17%
Political lean MEDSL · Ogle
- 2024 margin
- Strong R (+29.4) · D 34.5% · R 63.9% · Other 1.6%
- 2008→2024 swing
- -21.8pp toward R · 2008: -7.6pp · 2024: -29.4pp
- All cycles
- 2024: R+29.4 2020: R+25.9 2016: R+26.6 2012: R+16.7 2008: R+7.6
Not yet ingested
- Civics
- —
Market trends
- HPI YoY
- ▼ -150.85%
- Current HPI
- 150.4419
- Rent YoY
- —
- Metro
- —
- State GDP YoY
- ▲ 1.59%
- F500 in state
- 60
Industry mix (Fortune 500 HQ in IL)
| Industry | F500 HQs | Revenue |
|---|---|---|
| Insurance | 4 | $201B |
|
||
| Consumer Goods | 4 | $87B |
|
||
| Industrial Machinery | 3 | $64B |
|
||
| Healthcare | 2 | $55B |
|
||
| Retail / Pharmacy | 1 | $148B |
|
||
| Agriculture / Food | 1 | $86B |
|
||
Price history
+16.5% since first listed6 events — show timeline
- 2026-05-22 Pending — MRED as Distributed by MLS Grid
- 2026-03-17 Price Changed $147,500 MRED as Distributed by MLS Grid
- 2026-02-26 Price Changed $153,500 MRED as Distributed by MLS Grid
- 2026-02-20 Listed $155,000 MRED as Distributed by MLS Grid
- 2017-09-12 Sold (Public Records) $126,650 Public Records
- 2014-11-22 Listing Removed — MRED as Distributed by MLS Grid
Property tax history
+2.8%/yrLatest (2024): $3,933 · +7.8% YoY. Source: county tax records.
Cash-flow waterfall
monthlySold comps — $/sqft
last 12 mo · ≤1 miLoading sold comps…