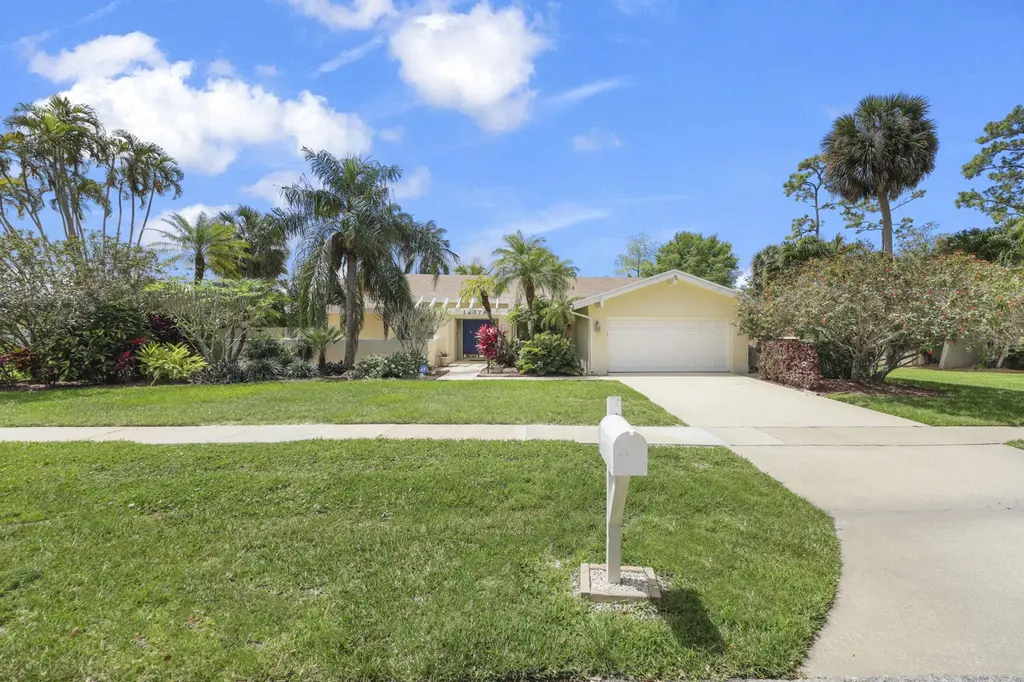
12378 Sawgrass Ct · Wellington, FL
Flood risk 3/10 · Minor
- FEMA flood zone
- X (unshaded)
- Chance of flooding over 30 yrs
- 0.12%
- Est. flood insurance / yr
- $507 – $1,088
Fire risk 1/10 · Minimal
- Est. fire insurance / yr
- $947 – $1,759
Heat risk 10/10 · Severe
- Hot days now (above 107°F)
- 7 days/yr
- Hot days in 30 yrs
- 25 days/yr
Wind risk 10/10 · Severe
- Chance of severe wind over 30 yrs
- 99.0%
Air-quality risk 2/10 · Minimal
- Unhealthy air days now
- 0 days/yr
- Unhealthy air days in 30 yrs
- 1 days/yr
Risk factors via First Street. Map © Google.
Why this score? — see what drove the D- grade
The composite is a weighted blend of 9 inputs, each scored 0–100. Each bar is that input's sub-score; the figure is the points it added to the 100-point composite (weight × sub-score).
- ARV discount +9.3/15.0
- Cash flow +8.5/30.0
- Schools +4.3/10.0
- Livability +3.7/5.0
- Rent growth +3.1/5.0
- Condition / age +2.5/5.0
- DSCR +2.3/10.0
- 1% rule +1.6/10.0
- Appreciation +0.0/10.0
$745,000
🖨 Deal sheet 📄 Offer letter ✓ Due diligence
Listing remarks
CORNER LOT POOL HOME GENERATOR MOVE-IN READY Welcome to 12378 Sawgrass Court in the heart of Wellingtona home filled with warmth, character, and lasting memories. This beautiful 45 bedroom residence sits on a spacious corner lot in the highly desirable Avondale Woods community, where tree-lined streets and a peaceful atmosphere create the perfect place to call home. Inside, youll find soaring vaulted ceilings and a bright, open layout that makes the home feel both expansive and inviting. The recently upgraded kitchen is a true centerpiece, offering modern finishes and ample space for cooking, gathering, and entertaining. This is the one buyers have been waiting for in Wellingtons sough
Key facts
- Screened pool
- Upgraded kitchen
- Covered patio
Tags
Property features AI
Finance
- Other: Pets allowed (cats and dogs OK)
- HOA & community: Part of Avondale Woods HOA; HOA provides tennis courts; HOA fees cover trash and common areas
Exterior
- Parking: Attached 2-car garage with garage door opener; Driveway with two additional open parking spaces; Concrete parking
- Security: Security system
- Utilities: Public water; Public sewer; Generator for electric service; Cable available; Water connected; Sewer available
- Home design: Single family residence; One story; Resale property, updated/remodeled; Faces north; Standby generator
- Construction: Concrete construction; Shingle roof
- Exterior features: Open patio; Screened patio; Patio; Back yard fencing; Full fenced yard with privacy and security wood fencing; Corner lot with sidewalks and landscaping; Oversized lot; Private in-ground pool with screen enclosure
Interior
- Kitchen: Disposal; Dishwasher; Microwave; Refrigerator; Electric cooktop; Freezer
- Bedrooms: Five bedrooms on the main level; Accessible bedroom and accessible closets
- Flooring: Carpet; Laminate; Tile
- Bathrooms: Three full bathrooms on the main level; Adaptable and accessible full bath features
- Heating & cooling: Electric heating; Central air conditioning; Ceiling fans
- Interior features: High ceilings; Kitchen island; Fireplace (wood burning); Shutters on windows
- Laundry & utility: Indoor laundry room
Neighborhood map
What this means for you Summary
Snapshot
- This is a 5-bed/2.0-bath single-family listed at $745k.
Deal economics
- At list price, monthly cash flow is $-649 ($-8k/yr) — negative.
- To cash-flow at today's rent, offer at most $630k (15.4% below list).
- To meet the 1% rule (rent ≥ 1% of price), the offer needs to be $492k (33.9% below list).
- Recommended offer: $492k (33.9% below list) — sets the bar for 1% rule.
- Cap rate 5.2% vs local median 3.4% in Wellington — top-decile yield for the area; either an underpriced asset or a hidden risk that comps aren't pricing in. Stress-test before assuming the spread holds.
Location & tenants
- Location reads 73/100 on livability (#294 in FL, #4,986 nationally) — a middle-class / working-renter tenant base. Strengths: crime A+, employment A+, housing A+; Watch: amenities F, commute F, cost of living F.
- Palm Beach (suburban): math 46% / reading 53% proficiency, ranked #34 of 73 in FL (top 47%) — families likely to look elsewhere, expect single-tenant / working-renter base with shorter leases.
- Zoned schools: Wellington Elementary School (math 60% / reading 64%, grade B, #608 of 2,144 statewide, top 29%, 950 students, 38% FRL); Wellington Landings Middle (math 70% / reading 72%, grade A, #59 of 571 statewide, top 11%, 1,230 students, 29% FRL); Wellington High School (math 57% / reading 65%, grade C+, #102 of 667 statewide, top 15%, 2,688 students, 29% FRL) — zoned schools average 32% FRL vs 52% district-wide (20 pts lower); this property's tenant base skews higher-income than the district average.
- Zoned-school proficiency averages 65% at this address vs 50% district-wide (+15 pts) — the actual schools serving this property are materially stronger than the Palm Beach average implies; a family-tenant draw the district grade alone would hide.
- Market conditions: Rents rising (+2.3%/yr); 616 active listings in the ZIP; 36 comparable units currently listed for rent nearby; rentals at typical pace (median 25d on market — plan ~3-4 weeks tenant-placement turnaround); high-income renter base; 3,974 units permitted in Palm Beach County in 2024 (1,012 in 5+ unit buildings).
- At $4,921/mo this rent would consume 53% of the median local household income ($112k/yr) (locally 1566% of renters already pay >50% of income on rent) — very limited rent-growth headroom before tenants either downsize or default.
Forward outlook
- Local home prices are declining (-3.0%/yr); year-one equity from $5k of loan paydown is wiped out by about $22k of value loss. Plan a longer hold.
- Palm Beach County population projected at +30% by 2050 — long-run rental-demand tailwind backs the buy-and-hold thesis.
Negotiation context
- Only 14 days on market — expect competitive offers; lowballing is unlikely to land.
Risks & watch-outs
- Climate carrying-cost: severe wind risk, 99% chance of damaging wind over 30y; extreme-heat days projected 7→25/yr by 2055 (HVAC capex compounding) — expect insurance premiums to compound above CPI over the hold.
Questions for the listing agent
- What do current leases actually rent for vs. the listed asking? Can we see a recent rent roll and the last 12 months of T-12 income?
- Is there a deadline driving the sale (1031 exchange, divorce, estate, relocation)? That informs how much negotiation room exists.
- Schools are A-rated — typically a magnet for longer-tenancy family renters. What's the average tenant stay here, and is there a school-zone premium baked into asking?
- The area grade is low — what's the realistic commute time and amenity access for the typical tenant pool here? Any planned neighborhood developments (good or bad) we should know about?
- What's the average days-on-market for RENTAL listings here right now (not sales)? A rising rental-DOM trend means longer vacancies and softer asking-rent achievability than the comps imply.
- What's the recent tenant-quality profile in this submarket — average credit score on applications, eviction rate, late-payment / NSF rate, and stable-employment percentage? A property-management company in the area should have these aggregated.
- How much new for-sale + rental construction is in the pipeline within 1–3 miles? Heavy new supply typically softens prices + rents 12–24 months out; constrained supply supports both.
Investment metrics
- 1% rule
- 0.66% ✗
- Cap rate
- 5.25%
- Cash-on-cash
- -3.73%
- DSCR
- 0.83
- GRM
- 12.6
CMA / ARV
- ARV (on-the-fly)
- $776,889
- Comps found
- 1
Show comp detail 1 sale within ~0.75 mi
| Address | Dist | Beds/Ba | Sqft | Sold | Price | $/sf | Match |
|---|---|---|---|---|---|---|---|
| 12180 Sugar Pine Trl | 0.42mi | 4/2.5 (-1) | 2,146 (-8%) | 16mo | $715,000 | $333 | 46 |
Match score weights: distance 35% · size 25% · config 20% · recency 20%. Top-matched comps best support the ARV.
Projected returns pro-forma
-3.0% appreciation · 2.31% rent growth · sell at horizon
- IRR
- -23.3%
- Equity multiple
- 0.21×
- Total profit
- $-165,764
- Equity at exit
- $111,082
- IRR
- -19.8%
- Equity multiple
- -0.02×
- Total profit
- $-212,543
- Equity at exit
- $64,414
Cash invested: $208,600 (down + closing). Projections, not guarantees.
Landlord ↔ Tenant lean methodology
- Overall (STATE)
- 87 Strongly Landlord-Friendly
- State Florida
- 87 Strongly Landlord-Friendly · R+3
- County
- — inherits STATE
- City
- — inherits STATE
ZIP-level market 33414
- Home prices YoY
- -30.2%
- Rents YoY
- 2.3%
- Active inventory
- 616
- Price-to-rent
- 12.6×
Monthly cashflow live
- Estimated rent
- $4,921 high interval (Pro) →
- Mortgage (P&I)
- −$3,907
- Tax from tax record
- −$320 /mo · $3,835/yr
- Insurance
- −$310
- HOA
- −$0
- Vacancy / Maint / Mgmt
- −$1,033
- Net cashflow
- $-649
Break-even live
UW: 25.0% down · 7.5% · 30yr · 1.5% tax · 5.0% vac · 8.0% maint · 8.0% mgmt
Financing live
Cash to close
- Down payment
- $186,250
- Closing costs
- $22,350
- Reserves months
- —
- Total cash needed
- —
Loan-product check · same deal, 3 products live
Conventional
25% down · 7.5% · 30yr
- Down + closing
- —
- Monthly P&I
- —
- Monthly cashflow
- —
- DSCR
- —
- Eligible?
- —
Personal DTI + credit; lowest rate.
DSCR
20% down · 8.5% · 30yr
- Down + closing
- —
- Monthly P&I
- —
- Monthly cashflow
- —
- DSCR
- —
- Eligible?
- —
No personal income docs; deal must DSCR.
Hard money
10% down · 12.0% · 12mo
- Down + closing
- —
- Monthly P&I
- —
- Monthly cashflow
- —
- DSCR
- —
- Eligible?
- —
Short-term bridge; refi at stabilization.
Rent comps 36 comps
| Address | Beds | Baths | Sqft | Rent | $/sqft | DOM | Units | Dist |
|---|---|---|---|---|---|---|---|---|
| 12351 Gingerwood Ln Wellington, FL | 4.0 | 2.0 | 2053 | $3,600 | $1.75 | 7d | 1 | 0.17mi |
| 12351 Gingerwood Ln Wellington, FL | 4.0 | 2.0 | 2053 | $3,856 | $1.88 | 24d | 1 | 0.17mi |
| 280 Sulky Way Wellington, FL | 4.0 | 2.0 | 2278 | $4,500 | $1.98 | 17d | 1 | 0.30mi |
| 12327 Quercus Ln Wellington, FL | 4.0 | 2.5 | 3058 | $10,000 | $3.27 | 24d | 1 | 0.38mi |
| 12775 Guilford Cir Wellington, FL | 4.0 | 3.0 | 2212 | $7,000 | $3.16 | 24d | 1 | 0.67mi |
| 1342 Essex Dr Wellington, FL | 4.0 | 2.0 | 2652 | $8,000 | $3.02 | 24d | 1 | 0.72mi |
| 1251 Rowayton Cir Wellington, FL | 4.0 | 2.5 | 2290 | $3,495 | $1.53 | 24d | 1 | 0.72mi |
| 101 Mill Pond Ln Royal Palm Beach, FL | 5.0 | 2.5 | 3210 | $4,650 | $1.45 | 15d | 1 | 0.74mi |
| 101 Mill Pond Ln Royal Palm Beach, FL | 5.0 | 2.5 | 3210 | $4,650 | $1.45 | 17d | 1 | 0.74mi |
| 13302 Doubletree Cir Wellington, FL | 5.0 | 5.5 | 3200 | $15,000 | $4.69 | 12d | 1 | 0.86mi |
| 1243 Kinglet Ter Wellington, FL | 5.0 | 2.5 | 1920 | $5,000 | $2.60 | 24d | 1 | 0.86mi |
| 1027 Aviary Rd Wellington, FL | 4.0 | 2.5 | 2376 | $3,455 | $1.45 | 2d | 1 | 0.98mi |
| 11647 Anhinga Dr Wellington, FL | 5.0 | 3.0 | 2279 | $9,900 | $4.34 | 13d | 1 | 0.99mi |
| 11647 Anhinga Dr Wellington, FL | 5.0 | 3.0 | 2279 | $9,900 | $4.34 | 24d | 1 | 0.99mi |
| 1248 Lake Breeze Dr Wellington, FL | 4.0 | 3.0 | 2324 | $4,400 | $1.89 | 20d | 1 | 1.01mi |
| 1256 Lake Breeze Dr Wellington, FL | 4.0 | 2.0 | 1707 | $5,000 | $2.93 | 12d | 1 | 1.03mi |
| 1352 Wyndcliff Dr Wellington, FL | 4.0 | 2.0 | 1740 | $5,000 | $2.87 | 24d | 1 | 1.03mi |
| 12828 Meadowbreeze Dr Wellington, FL | 4.0 | 2.5 | 2377 | $4,500 | $1.89 | 24d | 1 | 1.05mi |
| 106 Fernwood Cres Royal Palm Beach, FL | 4.0 | 2.0 | 2088 | $3,500 | $1.68 | 15d | 1 | 1.05mi |
| 1401 Hideaway Bnd Wellington, FL | 4.0 | 2.0 | 2122 | $3,950 | $1.86 | 24d | 1 | 1.07mi |
| 1019 Larch Way Wellington, FL | 4.0 | 2.0 | 2125 | $4,000 | $1.88 | 24d | 1 | 1.10mi |
| 1123 Northumberland Ct Wellington, FL | 5.0 | 3.0 | 2487 | $6,000 | $2.41 | 24d | 1 | 1.13mi |
| 1734 Harborside Cir Wellington, FL | 4.0 | 3.5 | 1998 | $3,825 | $1.91 | 24d | 1 | 1.19mi |
| 1750 Harborside Cir Wellington, FL | 4.0 | 2.0 | 1672 | $3,400 | $2.03 | 18d | 1 | 1.19mi |
| 1900 Lakes Blvd Wellington, FL | 4.0 | 1.5 | 1900 | $3,200 | $1.68 | 24d | 1 | 1.21mi |
| 13484 Jonquil Ct Wellington, FL | 4.0 | 2.0 | 2383 | $4,500 | $1.89 | 7d | 1 | 1.23mi |
| 13484 Jonquil Ct Wellington, FL | 4.0 | 2.0 | 2383 | $4,500 | $1.89 | 17d | 1 | 1.23mi |
| 12915 Collecting Canal Rd Loxahatchee, FL | 4.0 | 3.0 | 3296 | $10,000 | $3.03 | 24d | 1 | 1.23mi |
| 1779 Harborside Cir Wellington, FL | 4.0 | 2.5 | 1920 | $8,500 | $4.43 | 24d | 1 | 1.26mi |
| 1760 Shoreside Cir Wellington, FL | 4.0 | 2.5 | 1920 | $3,400 | $1.77 | 17d | 1 | 1.31mi |
| 13647 Barberry Dr Wellington, FL | 4.0 | 2.5 | 2421 | $7,000 | $2.89 | 24d | 1 | 1.32mi |
| 1637 Farmington Cir Wellington, FL | 4.0 | 2.0 | 2212 | $5,500 | $2.49 | 24d | 1 | 1.34mi |
| 1637 Farmington Cir Wellington, FL | 4.0 | 2.0 | 2212 | $5,500 | $2.49 | 15d | 1 | 1.34mi |
| 1654 Farmington Cir Wellington, FL | 4.0 | 2.5 | 2539 | $6,900 | $2.72 | 4d | 1 | 1.34mi |
| 13557 Northumberland Cir Wellington, FL | 5.0 | 3.5 | 2821 | $7,000 | $2.48 | 22d | 1 | 1.45mi |
| 10690 Old Hammock Way Wellington, FL | 5.0 | 3.0 | 3065 | $6,000 | $1.96 | 24d | 1 | 1.45mi |
Listing history 13 events
-
2026-06-18days on market $745,000 Active 14 DOM
-
2026-06-17days on market $745,000 Active 13 DOM
-
2026-06-16days on market $745,000 Active 12 DOM
-
2026-06-15days on market $745,000 Active 11 DOM
-
2026-06-13days on market $745,000 Active 9 DOM
-
2026-06-09days on market $745,000 Active 5 DOM
-
2026-06-07days on market $745,000 Active 3 DOM
-
2026-06-04pricedays on market $745,000 Active 1 DOM
-
2026-06-03days on market $699,000 Active 47 DOM
-
2026-06-02days on market $699,000 Active 46 DOM
-
2026-06-01days on market $699,000 Active 45 DOM
-
2026-05-31days on market $699,000 Active 44 DOM
-
2026-04-15$699,000 Active
ⓘ Source: listings_history table (triggers on properties + properties_extension) + one-shot
backfill from property_details.listing_events for pre-trigger history.
Tax reassessment forecast FL · Resets to sale price
- Current annual tax
- $3,835 · $320/mo
- Projected year-2 tax
- $6,184 · $515/mo
- Expected delta
- +$2,349/yr (+$196/mo · 61.3%)
ⓘ Screening estimate from a state-policy table — verify with the county assessor before closing.
Climate risk First Street
- Flood 3/10 Moderate FEMA zone X (unshaded) · 12% chance over 30 yrs
- Wildfire 1/10 Low
- Heat 10/10 Extreme 7 d/yr ≥107°F today · 25 d/yr by 30 yrs out
- Wind 10/10 Extreme 99% chance of damaging wind over 30 yrs
- Air quality 2/10 Low 0 unhealthy d/yr today · 1 by 30 yrs out
Nearby sold comps map
Loading sold comps map…
Walkable amenities ~0.75 mi
Loading nearby amenities…
Taxation est. · year 1
- Rental income
- $59,053
- − Mortgage interest
- −$41,732
- − Property taxes
- −$3,835
- − Insurance
- −$3,725
- − Repairs & maintenance
- −$4,724
- − Management
- −$4,724
- − Depreciation
- −$21,673
- Taxable loss
- −$21,360
- Est. tax savings @ 24.0%
- +$5,126
- After-tax cash flow
- $-2,664/yr
For passive investors: Depreciation is non-cash, so a rental often shows a tax loss while cash-flowing — sheltering income. Rental losses are passive: they offset passive income freely, and up to $25,000/yr can offset ordinary (W-2) income if you actively participate and your MAGI is under $100k (phasing out to $0 by $150k); unused losses carry forward. On sale, claimed depreciation is recaptured at up to 25%, and gains may owe capital-gains tax (a 1031 exchange can defer both). Figures are a year-1 estimate at your 24.0% rate — not tax advice; consult a CPA.
Schools (NCES district)
- District
- Palm Beach
- NCES district ID
- 1201500
- Math proficiency
- 46% ▼ -16.00%
- Reading proficiency
- 53% ▼ -4.00%
- Median HH income
- $53,943
- Composite
- 42.72/100
- National rank
- #3160
- State rank
- #34 of 73 in FL
Livability — Wellington
- Score
- 73/100
- State rank
- #294
- US rank
- #4986
Category grades
Schools grade is shown separately in the Schools card above.
Census & demographics
- Census place
- Wellington, FL
- County
- Palm Beach County · 1,438,312 people
- City population
- 60,184
- Metro
- Miami-Fort Lauderdale-Pompano Beach, FL
- Population (ZIP)
- 60,184
- Household income
- $112,241
- Rent vs Own
- Severe rent burden
- 1566.0
Population outlook (Palm Beach County) Hauer SSP2
- Today (2025)
- 1,637,487 people
- By 2030
- 1,743,255 · +6.5%
- By 2040
- 1,948,712 · +19.0%
- By 2050
- 2,132,979 · +30.3%
- By 2075
- 2,530,027 · +54.5%
- By 2100
- 2,706,979 · +65.3%
Race, ethnicity, and origin ACS 2023
- Neighborhood character
- Diverse neighborhood (Simpson 0.67)
- Race & ethnicity
- White 47% Hispanic / Latino 29% Two or more races 20% Black 13% Asian 6%
- Hispanic origin (detail)
- Mexican 4% Puerto Rican 5% Cuban 6% Dominican 1% Salvadoran 1%
- Common ancestry
- Hispanic 4% Romanian 3% Lithuanian 2%
- Foreign-born
- 26% · Canada, Jamaica, China
- Languages at home
- 67% English-only · Spanish 23% French/Haitian/Cajun 3% Other Indo-European 3%
Political lean MEDSL · Palm Beach
- 2024 margin
- Toss-up / Even · D 50.0% · R 49.2%
- 2008→2024 swing
- -22.1pp toward R · 2008: 22.9pp · 2024: 0.8pp
- All cycles
- 2024: D+0.8 2020: D+12.8 2016: D+15.3 2012: D+17.0 2008: D+22.9
Not yet ingested
- Civics
- —
Market trends
- HPI YoY
- ▼ -152.58%
- Current HPI
- 352.9366
- Rent YoY
- ▲ 2.31%
- Metro
- Miami-Fort Lauderdale-Pompano Beach, FL
- State GDP YoY
- ▲ 3.28%
- F500 in state
- 36
Industry mix (Fortune 500 HQ in FL)
| Industry | F500 HQs | Revenue |
|---|---|---|
| Industrial Technology | 2 | $29B |
|
||
| Insurance | 2 | $17B |
|
||
| Retail | 1 | $60B |
|
||
| Technology Distribution | 1 | $58B |
|
||
| Homebuilding | 1 | $35B |
|
||
| Technology Manufacturing | 1 | $35B |
|
||
Price history
1 event — show timeline
- 2026-04-15 Listed $699,000 Beaches MLS
Property tax history
+1.8%/yrLatest (2025): $3,835 · +3.7% YoY. Source: county tax records.
Cash-flow waterfall
monthlySold comps — $/sqft
last 12 mo · ≤1 miLoading sold comps…