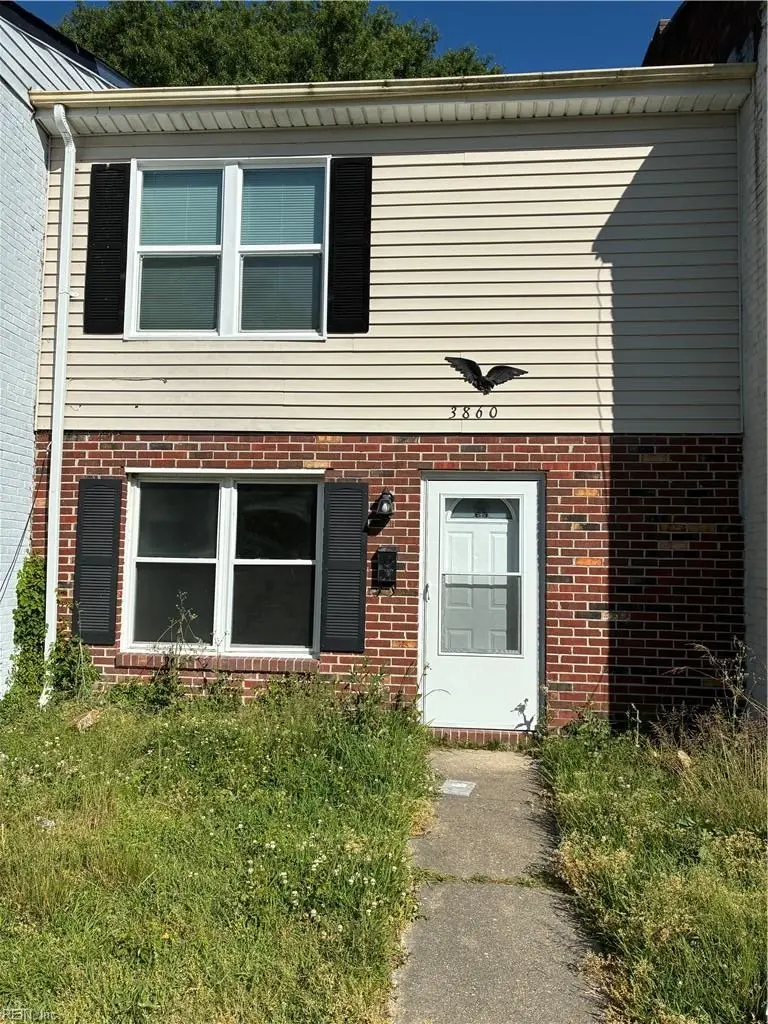
3860 Schooner Trl · Chesapeake, VA
Flood risk 6/10 · Moderate
- FEMA flood zone
- X (unshaded)
- Chance of flooding over 30 yrs
- 0.67%
- Est. flood insurance / yr
- $507 – $1,088
Fire risk 2/10 · Minimal
- Est. fire insurance / yr
- $666 – $1,236
Heat risk 9/10 · Severe
- Hot days now (above 106°F)
- 7 days/yr
- Hot days in 30 yrs
- 16 days/yr
Wind risk 8/10 · Major
- Chance of severe wind over 30 yrs
- 80.0%
Air-quality risk 2/10 · Minimal
- Unhealthy air days now
- 2 days/yr
- Unhealthy air days in 30 yrs
- 2 days/yr
Risk factors via First Street. Map © Google.
Why this score? — see what drove the C grade
The composite is a weighted blend of 9 inputs, each scored 0–100. Each bar is that input's sub-score; the figure is the points it added to the 100-point composite (weight × sub-score).
- Cash flow +20.4/30.0
- ARV discount +8.3/15.0
- DSCR +6.5/10.0
- Schools +5.8/10.0
- 1% rule +4.5/10.0
- Rent growth +4.4/5.0
- Livability +3.5/5.0
- Condition / age +2.5/5.0
- Appreciation +0.0/10.0
$187,000
🖨 Deal sheet 📄 Offer letter ✓ Due diligence
Listing remarks
Come see this one first—it won’t last long at this price. This Chesapeake townhome is vacant and move-in ready, offering a great opportunity for both first-time buyers and investors. Featuring a new roof, new HVAC, and new appliances, this home has major updates already completed. Easy to rent and a strong addition to any investment portfolio. Conveniently located with access to Western Branch High School and no HOA or condo fees. Sold as-is.
Key facts
- No hoa or condo fees
- New hvac
- New appliances
Tags
Property features AI
Finance
- HOA & community: No HOA fees listed
Exterior
- Parking: Driveway space; Street parking
- Utilities: City/County water; City/County sewer; Electric water heater
- Home design: Attached townhouse; 2 stories; 2 living levels; Simple ownership
- Construction: Shingle siding; Asphalt shingle roof; Slab foundation
- Exterior features: Back fenced yard; City view
Interior
- Kitchen: Electric range; Microwave; Refrigerator
- Bedrooms: No bedroom with full bathroom on the first floor
- Flooring: Ceramic; Vinyl
- Bathrooms: 1 full bathroom; 1 half bathroom
- Heating & cooling: Electric heating; Central air conditioning
- Interior features: Cable hookup; Ceiling fan; Attic
- Laundry & utility: Washer hookup; Dryer hookup
Neighborhood map
What this means for you Summary
Snapshot
- This is a 3-bed/2.0-bath townhouse listed at $187k.
Deal economics
- At list price, monthly cash flow is $242 ($3k/yr) — positive.
- The deal already cash-flows at list — no discount required.
- To meet the 1% rule (rent ≥ 1% of price), the offer needs to be $178k (5.0% below list).
- Recommended offer: $178k (5.0% below list) — sets the bar for 1% rule.
- Cap rate 7.8% vs local median 3.7% in Chesapeake — top-decile yield for the area; either an underpriced asset or a hidden risk that comps aren't pricing in. Stress-test before assuming the spread holds.
Location & tenants
- Location reads 70/100 on livability (#236 in VA) — a middle-class / working-renter tenant base. Strengths: employment A+, housing A+; Watch: crime C-, cost of living C-, amenities F.
- Chesapeake City Public School District (suburban): math 58% / reading 74% proficiency, ranked #31 of 131 in VA (top 24%) — acceptable for families but not a draw, mixed tenant base, ~2y average lease.
- Zoned schools: Southeastern Elementary (math 80% / reading 83%, grade A+, #120 of 1,108 statewide, top 11%, 837 students, 17% FRL); Western Branch High (math 71% / reading 84%, grade A-, #83 of 319 statewide, top 28%, 2,121 students, 37% FRL) — zoned schools at 27% FRL track the district average.
- Zoned-school proficiency averages 80% at this address vs 66% district-wide (+14 pts) — the actual schools serving this property are materially stronger than the Chesapeake City Public School District average implies; a family-tenant draw the district grade alone would hide.
- Market conditions: Rents rising fast (+7.6%/yr); 231 active listings in the ZIP; 6 comparable units currently listed for rent nearby; rentals at typical pace (median 17d on market — plan ~3-4 weeks tenant-placement turnaround); solid renter incomes; 597 units permitted in Chesapeake city in 2024 (0 in 5+ unit buildings).
Forward outlook
- Local home prices are declining (-3.0%/yr); year-one equity from $1k of loan paydown is wiped out by about $6k of value loss. Plan a longer hold.
- Chesapeake County population projected at +21% by 2050 — long-run rental-demand tailwind backs the buy-and-hold thesis.
- At projected returns (-3.0% appreciation + 7.6% rent growth), your $52k cash investment doubles in ~10 years — after that, you're playing with house money.
Negotiation context
- It's been on market 47 days — a 3% lower offer ($181k) is reasonable based on typical stale-listing flexibility.
- 4 sale attempts with the ask held roughly flat each time — persistent listings suggest the price (not the market) is what's stuck; bring a comps-based counter.
- Current owner paid $135k; 39% above their basis — modest negotiation headroom, anchor on the comps not their cost.
Risks & watch-outs
- Climate carrying-cost: major flood risk; severe wind risk, 80% chance of damaging wind over 30y; extreme-heat days projected 7→16/yr by 2055 (HVAC capex compounding) — expect insurance premiums to compound above CPI over the hold.
Questions for the listing agent
- It's been on market 47 days. Have you received any prior offers? Is the seller open to a 5% concession, seller financing, or rate buy-down credit?
- Built in 1970 — when were the roof, HVAC, electrical panel, plumbing, and water heater last replaced?
- Is there a deadline driving the sale (1031 exchange, divorce, estate, relocation)? That informs how much negotiation room exists.
- Schools are A-rated — typically a magnet for longer-tenancy family renters. What's the average tenant stay here, and is there a school-zone premium baked into asking?
- What's the average days-on-market for RENTAL listings here right now (not sales)? A rising rental-DOM trend means longer vacancies and softer asking-rent achievability than the comps imply.
- What's the recent tenant-quality profile in this submarket — average credit score on applications, eviction rate, late-payment / NSF rate, and stable-employment percentage? A property-management company in the area should have these aggregated.
- How much new for-sale + rental construction is in the pipeline within 1–3 miles? Heavy new supply typically softens prices + rents 12–24 months out; constrained supply supports both.
Investment metrics
- 1% rule
- 0.95% ✗
- Cap rate
- 7.84%
- Cash-on-cash
- 5.54%
- DSCR
- 1.25
- GRM
- 8.8
CMA / ARV
- ARV (on-the-fly)
- $190,400
- Comps found
- 4
Show comp detail 4 sales within ~0.75 mi
| Address | Dist | Beds/Ba | Sqft | Sold | Price | $/sf | Match |
|---|---|---|---|---|---|---|---|
| 4008 Sloop Trl | 0.05mi | 3/1.5 | 1,120 (0%) | 2mo | $190,000 | $170 | 94 |
| 3857 Schooner Trl | 0.02mi | 3/1.5 | 1,280 (+14%) | 1mo | $170,000 | $133 | 72 |
| 4157 Holly Cove Dr | 0.17mi | 3/1.5 | 1,280 (+14%) | 10mo | $115,000 | $90 | 58 |
| 3958 Rex Cir | 0.43mi | 2/2.0 (-1) | 1,257 (+12%) | 2mo | $259,000 | $206 | 53 |
Match score weights: distance 35% · size 25% · config 20% · recency 20%. Top-matched comps best support the ARV.
Projected returns pro-forma
-3.0% appreciation · 7.59% rent growth · sell at horizon
- IRR
- -3.1%
- Equity multiple
- 0.88×
- Total profit
- $-6,377
- Equity at exit
- $27,882
- IRR
- 10.8%
- Equity multiple
- 2.01×
- Total profit
- $52,781
- Equity at exit
- $16,168
Cash invested: $52,360 (down + closing). Projections, not guarantees.
Landlord ↔ Tenant lean methodology
- Overall (STATE)
- 55 Moderately Landlord-Leaning
- State Virginia
- 55 Moderately Landlord-Leaning · D+2
- County
- — inherits STATE
- City
- — inherits STATE
ZIP-level market 23321
- Rents YoY
- 7.6%
- Active inventory
- 231
- Price-to-rent
- 8.8×
Monthly cashflow live
- Estimated rent
- $1,776 high interval (Pro) →
- Mortgage (P&I)
- −$981
- Tax from tax record
- −$103 /mo · $1,235/yr
- Insurance
- −$78
- HOA
- −$0
- Vacancy / Maint / Mgmt
- −$373
- Net cashflow
- $242
Break-even live
UW: 25.0% down · 7.5% · 30yr · 1.5% tax · 5.0% vac · 8.0% maint · 8.0% mgmt
Financing live
Cash to close
- Down payment
- $46,750
- Closing costs
- $5,610
- Reserves months
- —
- Total cash needed
- —
Loan-product check · same deal, 3 products live
Conventional
25% down · 7.5% · 30yr
- Down + closing
- —
- Monthly P&I
- —
- Monthly cashflow
- —
- DSCR
- —
- Eligible?
- —
Personal DTI + credit; lowest rate.
DSCR
20% down · 8.5% · 30yr
- Down + closing
- —
- Monthly P&I
- —
- Monthly cashflow
- —
- DSCR
- —
- Eligible?
- —
No personal income docs; deal must DSCR.
Hard money
10% down · 12.0% · 12mo
- Down + closing
- —
- Monthly P&I
- —
- Monthly cashflow
- —
- DSCR
- —
- Eligible?
- —
Short-term bridge; refi at stabilization.
Rent comps 6 comps
| Address | Beds | Baths | Sqft | Rent | $/sqft | DOM | Units | Dist |
|---|---|---|---|---|---|---|---|---|
| 4100 Sail Ct Unit 4124 Chesapeake, VA | 3.0 | 2.0 | 1100 | $1,595 | $1.45 | 14d | 1 | 0.17mi |
| 4100 Sail Ct Unit 4105 Chesapeake, VA | 3.0 | 2.0 | 1100 | $1,495 | $1.36 | 17d | 1 | 0.17mi |
| 4100 Sail Ct Unit 4118 Chesapeake, VA | 3.0 | 2.0 | 1100 | $1,500 | $1.36 | 7d | 1 | 0.17mi |
| 1217 Lakeview Dr Portsmouth, VA | 4.0 | 2.0 | 1425 | $2,550 | $1.79 | 7d | 1 | 1.38mi |
| 840 Lancer Dr Unit 615 Portsmouth, VA | 2.0 | 1.5 | 1002 | $1,288 | $1.29 | 23d | 1 | 1.41mi |
| 840 Lancer Dr Unit 694 Portsmouth, VA | 3.0 | 1.5 | 1202 | $1,480 | $1.23 | 17d | 1 | 1.41mi |
Listing history 31 events
-
2026-06-18days on market $187,000 Active 47 DOM
-
2026-06-17days on market $187,000 Active 46 DOM
-
2026-06-16days on market $187,000 Active 45 DOM
-
2026-06-15days on market $187,000 Active 44 DOM
-
2026-06-13days on market $187,000 Active 42 DOM
-
2026-06-09days on market $187,000 Active 38 DOM
-
2026-06-08days on market $187,000 Active 37 DOM
-
2026-06-07days on market $187,000 Active 36 DOM
-
2026-06-03days on market $187,000 Active 32 DOM
-
2026-06-02days on market $187,000 Active 31 DOM
-
2026-06-01days on market $187,000 Active 30 DOM
-
2026-05-31days on market $187,000 Active 29 DOM
-
2026-05-20status Under Contract
-
2026-05-12historical Active Under Contract
-
2026-04-23$187,000 Active
-
2026-03-06status Under Contract
-
2026-03-05historical
-
2026-02-26historical Active Under Contract
-
2026-02-05price $179,900
-
2026-01-01$189,000 Active
-
2025-04-18soldstatus $135,000
-
2025-04-01status Under Contract
-
2025-03-27historical Active Under Contract
-
2025-03-26price $150,000
-
2025-03-26status Active
-
2025-03-17historical Active Under Contract
-
2025-03-14price $140,000
-
2025-03-12$160,000 Active
-
1998-10-14soldstatus $32,000
-
1983-09-06soldstatus $33,900
-
1978-02-09soldstatus $24,900
ⓘ Source: listings_history table (triggers on properties + properties_extension) + one-shot
backfill from property_details.listing_events for pre-trigger history.
Tax reassessment forecast VA · Resets to sale price
- Current annual tax
- $1,235 · $103/mo
- Projected year-2 tax
- $1,533 · $128/mo
- Expected delta
- +$298/yr (+$25/mo · 24.1%)
ⓘ Screening estimate from a state-policy table — verify with the county assessor before closing.
Climate risk First Street
- Flood 6/10 Major FEMA zone X (unshaded) · 67% chance over 30 yrs
- Wildfire 2/10 Low
- Heat 9/10 Extreme 7 d/yr ≥106°F today · 16 d/yr by 30 yrs out
- Wind 8/10 Severe 80% chance of damaging wind over 30 yrs
- Air quality 2/10 Low 2 unhealthy d/yr today · 2 by 30 yrs out
Nearby sold comps map
Loading sold comps map…
Walkable amenities ~0.75 mi
Loading nearby amenities…
Taxation est. · year 1
- Rental income
- $21,315
- − Mortgage interest
- −$10,475
- − Property taxes
- −$1,235
- − Insurance
- −$935
- − Repairs & maintenance
- −$1,705
- − Management
- −$1,705
- − Depreciation
- −$5,440
- Taxable loss
- −$181
- Est. tax savings @ 24.0%
- +$43
- After-tax cash flow
- $2,944/yr
For passive investors: Depreciation is non-cash, so a rental often shows a tax loss while cash-flowing — sheltering income. Rental losses are passive: they offset passive income freely, and up to $25,000/yr can offset ordinary (W-2) income if you actively participate and your MAGI is under $100k (phasing out to $0 by $150k); unused losses carry forward. On sale, claimed depreciation is recaptured at up to 25%, and gains may owe capital-gains tax (a 1031 exchange can defer both). Figures are a year-1 estimate at your 24.0% rate — not tax advice; consult a CPA.
Schools (NCES district)
- District
- Chesapeake City Public School District
- NCES district ID
- 5100810
- Math proficiency
- 58% ▼ -29.00%
- Reading proficiency
- 74% ▼ -7.00%
- Median HH income
- $69,356
- Composite
- 57.84/100
- National rank
- #1047
- State rank
- #31 of 131 in VA
Livability — Chesapeake
- Score
- 70/100
- State rank
- #236
- US rank
- #7942
Category grades
Schools grade is shown separately in the Schools card above.
Census & demographics
- Census place
- Chesapeake, VA
- County
- Chesapeake City · 253,091 people
- City population
- 253,091
- Metro
- Virginia Beach-Norfolk-Newport News, VA-NC
- Population (ZIP)
- 40,176
- Household income
- $101,568
- Rent vs Own
- Severe rent burden
- 839.0
Population outlook (Chesapeake County) Hauer SSP2
- Today (2025)
- 263,804 people
- By 2030
- 276,798 · +4.9%
- By 2040
- 299,906 · +13.7%
- By 2050
- 318,284 · +20.7%
- By 2075
- 362,137 · +37.3%
- By 2100
- 372,225 · +41.1%
Race, ethnicity, and origin ACS 2023
- Neighborhood character
- Diverse neighborhood (Simpson 0.63)
- Race & ethnicity
- White 49% Black 37% Two or more races 8% Hispanic / Latino 5% Asian 3%
- Common ancestry
- Romanian 3% Italian 2% Lithuanian 2%
- Foreign-born
- 6% · Canada, Vietnam, South Korea
- Languages at home
- 92% English-only · Spanish 4% Vietnamese 1% Korean 1%
Political lean MEDSL · Chesapeake
- 2024 margin
- Toss-up / Even · D 51.3% · R 47.5% · Other 1.2%
- 2008→2024 swing
- +2.5pp toward D · 2008: 1.3pp · 2024: 3.8pp
- All cycles
- 2024: D+3.8 2020: D+6.5 2016: R+1.3 2012: D+1.1 2008: D+1.3
Not yet ingested
- Civics
- —
Market trends
- HPI YoY
- ▼ -256.23%
- Current HPI
- 295.6473
- Rent YoY
- ▲ 7.59%
- Metro
- Virginia Beach-Norfolk-Newport News, VA-NC
- State GDP YoY
- ▲ 2.40%
- F500 in state
- 50
Industry mix (Fortune 500 HQ in VA)
| Industry | F500 HQs | Revenue |
|---|---|---|
| Aerospace / Defense | 4 | $236B |
|
||
| Technology / Defense | 3 | $32B |
|
||
| Financial Services | 2 | $176B |
|
||
| Utilities | 2 | $27B |
|
||
| Insurance | 2 | $25B |
|
||
| Technology | 2 | $15B |
|
||
Price history
+651.0% since first listed19 events — show timeline
- 2026-05-20 Pending — REINMLS
- 2026-05-12 Contingent — REINMLS
- 2026-04-23 Listed $187,000 REINMLS
- 2026-03-06 Pending — REINMLS
- 2026-03-05 Listing Removed — REINMLS
- 2026-02-26 Contingent — REINMLS
- 2026-02-05 Price Changed $179,900 REINMLS
- 2026-01-01 Listed $189,000 REINMLS
- 2025-04-18 Sold (Public Records) $135,000 Public Records
- 2025-04-01 Pending — REINMLS
- 2025-03-27 Contingent — REINMLS
- 2025-03-26 Price Changed $150,000 REINMLS
- 2025-03-26 Relisted — REINMLS
- 2025-03-17 Contingent — REINMLS
- 2025-03-14 Price Changed $140,000 REINMLS
- 2025-03-12 Listed $160,000 REINMLS
- 1998-10-14 Sold (Public Records) $32,000 Public Records
- 1983-09-06 Sold (Public Records) $33,900 Public Records
- 1978-02-09 Sold (Public Records) $24,900 Public Records
Property tax history
+5.2%/yrLatest (2025): $1,235 · +12.3% YoY. Source: county tax records.
Cash-flow waterfall
monthlySold comps — $/sqft
last 12 mo · ≤1 miLoading sold comps…