 Multi-family
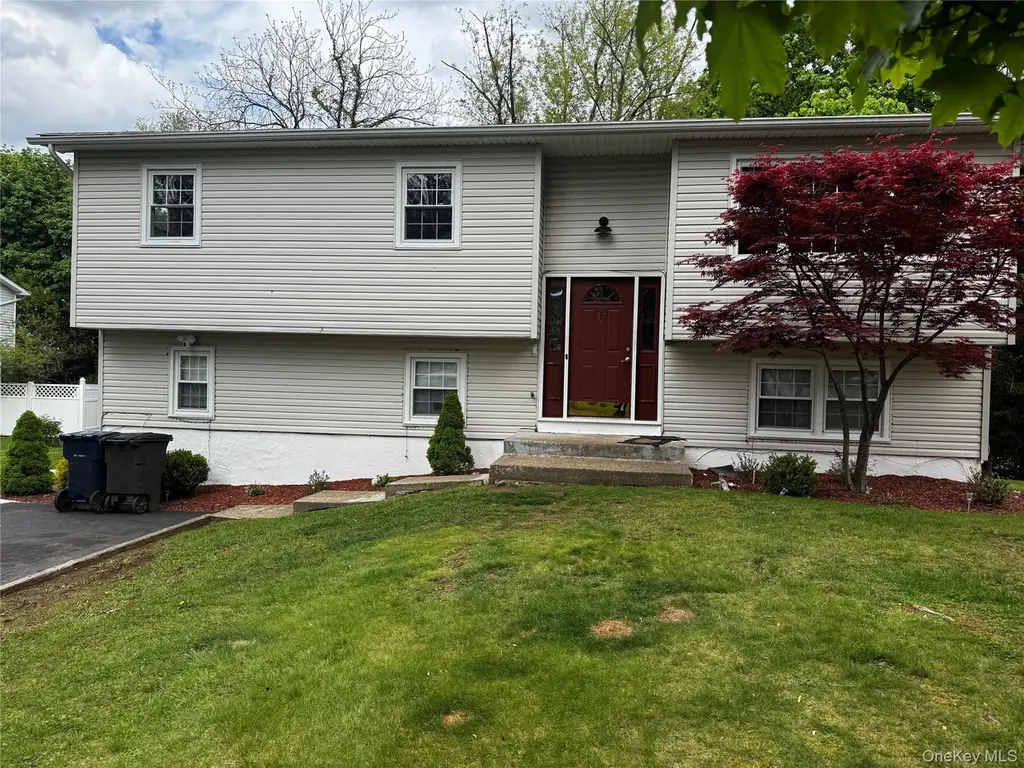
23 Frederick St · Thiells, NY
Flood risk 1/10 · Minimal
- FEMA flood zone
- X (unshaded)
- Chance of flooding over 30 yrs
- 0.0%
- Est. flood insurance / yr
- $473 – $860
Fire risk 3/10 · Minor
- Est. fire insurance / yr
- $691 – $1,283
Heat risk 5/10 · Moderate
- Hot days now (above 99°F)
- 7 days/yr
- Hot days in 30 yrs
- 15 days/yr
Wind risk 4/10 · Minor
- Chance of severe wind over 30 yrs
- 23.0%
Air-quality risk 3/10 · Minor
- Unhealthy air days now
- 2 days/yr
- Unhealthy air days in 30 yrs
- 3 days/yr
Risk factors via First Street. Map © Google.
Why this score? — see what drove the C+ grade
The composite is a weighted blend of 9 inputs, each scored 0–100. Each bar is that input's sub-score; the figure is the points it added to the 100-point composite (weight × sub-score).
- Cash flow +23.0/30.0
- ARV discount +12.3/15.0
- DSCR +7.4/10.0
- 1% rule +6.0/10.0
- Schools +4.1/10.0
- Livability +3.5/5.0
- Rent growth +2.5/5.0
- Condition / age +2.5/5.0
- Appreciation +0.0/10.0
$659,000
🖨 Deal sheet 📄 Offer letter ✓ Due diligence
Multi-family units
County records classify this as Multi-Family (2-4 Unit). Listing-text estimate: 1 unit. estimate disagrees with records
Listing remarks
Welcome to 23 Frederick Street a charming Hi-Ranch residence offering comfort, convenience, and classic suburban appeal. Nested in on a quiet residential street, this home provides a warm and inviting atmosphere with flexible living space and abundant natural light throughout. The home features 6 bedrooms and 3 full baths. Hardwood floors in the Living Room and bedrooms. Ceramic floors in the kitchen. New roof, Newer furnace and hot water heater, deck has been reinforced. The thoughtfully designed layout is ideal for everyday living, entertaining, or working from home. Conveniently located near parks, schools, shopping, and major roadways, this home combines neighborhood tranquility and eas
Key facts
- 0.33 acre lot
- 4 parking spots
- Built 1971
Property features AI
Exterior
- Parking: Driveway with parking for 4 cars
- Utilities: Public sewer; Electricity connected; Natural gas connected; Water connected
- Home design: Single family residence; Property condition: Actual
- Construction: Frame construction; Vinyl siding
- Exterior features: Vinyl siding; Frame construction; Not waterfront
Interior
- Kitchen: Convection oven; Range; Indirect water heater
- Bedrooms: Total rooms: 10
- Bathrooms: 3 full bathrooms
- Heating & cooling: Baseboard heating; Hot water heating; Natural gas heating; Wall/window air conditioning units
- Interior features: Ceiling fans; Formal dining room; Finished full walk-out basement; Full attic with pull-down stairs
- Laundry & utility: No basement (finished full walk-out noted above)
Neighborhood map
What this means for you Summary
Snapshot
- This is a 6-bed/3.0-bath multifamily listed at $659k.
Deal economics
- At list price, monthly cash flow is $1k ($14k/yr) — positive.
- The deal already cash-flows at list — no discount required.
- Meets the 1% rule at list price ($7k rent vs $659k).
- Recommended offer: $639k (3.0% below list) — sets the bar for market timing.
- Cap rate 8.4% vs local median 3.3% in Thiells — top-decile yield for the area; either an underpriced asset or a hidden risk that comps aren't pricing in. Stress-test before assuming the spread holds.
Location & tenants
- Location reads 70/100 on livability (#432 in NY) — a middle-class / working-renter tenant base. Strengths: crime A+, employment A+, housing A+; Watch: amenities F, commute F, cost of living F.
- Haverstraw-Stony Point CSD (North Rockland) (suburban): math 41% / reading 47% proficiency, ranked #427 of 590 in NY (top 72%) — families likely to look elsewhere, expect single-tenant / working-renter base with shorter leases.
- Zoned schools: Thiells Elementary School (math 37% / reading 52%, grade F, #1,277 of 2,108 statewide, top 64%, 645 students, 18% FRL); Fieldstone Middle School (math 18% / reading 46%, grade F, #511 of 729 statewide, top 71%, 1,247 students, 0% FRL); North Rockland High School (math 86% / reading 67%, grade A-, #612 of 1,100 statewide, top 56%, 2,687 students, 0% FRL) — zoned schools average 6% FRL vs 40% district-wide (34 pts lower); this property's tenant base skews higher-income than the district average.
- Market conditions: 37 active listings in the ZIP; 1 comparable units currently listed for rent nearby; 429 units permitted in Rockland County in 2024 (231 in 5+ unit buildings).
Forward outlook
- Local home prices are declining (-3.0%/yr); year-one equity from $5k of loan paydown is wiped out by about $20k of value loss. Plan a longer hold.
- Rockland County population projected at +7% by 2050 — modest demand growth; plan on rents tracking national, not racing it.
Negotiation context
- It's been on market 45 days — a 3% lower offer ($639k) is reasonable based on typical stale-listing flexibility.
- 2 sale attempts since 15y ago; this cycle's ask has dropped $41k (6%) from the opening price — seller is motivated, your offer sets the floor, not the list.
- Current owner paid $374k; list at $659k implies a 76% gain — meaningful room to come down on a strong offer.
Risks & watch-outs
- Climate carrying-cost: extreme-heat days projected 7→15/yr by 2055 (HVAC capex compounding) — expect insurance premiums to compound above CPI over the hold.
Questions for the listing agent
- It's been on market 45 days. Have you received any prior offers? Is the seller open to a 3% concession, seller financing, or rate buy-down credit?
- Built in 1971 — when were the roof, HVAC, electrical panel, plumbing, and water heater last replaced?
- Is there a deadline driving the sale (1031 exchange, divorce, estate, relocation)? That informs how much negotiation room exists.
- Schools are B-rated — typically a magnet for longer-tenancy family renters. What's the average tenant stay here, and is there a school-zone premium baked into asking?
- What's the average days-on-market for RENTAL listings here right now (not sales)? A rising rental-DOM trend means longer vacancies and softer asking-rent achievability than the comps imply.
- What's the recent tenant-quality profile in this submarket — average credit score on applications, eviction rate, late-payment / NSF rate, and stable-employment percentage? A property-management company in the area should have these aggregated.
- How much new apartment / multifamily construction is in the pipeline within 1–3 miles? Heavy new supply (>2% of stock underway) typically softens rents 12–24 months out; light construction supports rent growth.
Investment metrics
- 1% rule
- 1.10% ✓
- Cap rate
- 8.43%
- Cash-on-cash
- 7.63%
- DSCR
- 1.34
- GRM
- 7.6
CMA / ARV
- ARV (median comp)
- $737,433
- List price
- $659,000
- Delta
- -10.64%
- Verdict
- UNDERPRICED
- Comps
- 20 within 1.0 mi
Show comp detail 1 sale within ~0.75 mi
| Address | Dist | Beds/Ba | Sqft | Sold | Price | $/sf | Match |
|---|---|---|---|---|---|---|---|
| 142 W Railroad Ave | 0.65mi | 5/2.0 (-1) | 2,012 (-13%) | 16mo | $550,000 | $273 | 27 |
Match score weights: distance 35% · size 25% · config 20% · recency 20%. Top-matched comps best support the ARV.
Projected returns pro-forma
-3.0% appreciation · 3.0% rent growth · sell at horizon
- IRR
- -4.6%
- Equity multiple
- 0.83×
- Total profit
- $-31,949
- Equity at exit
- $98,259
- IRR
- 5.1%
- Equity multiple
- 1.37×
- Total profit
- $68,848
- Equity at exit
- $56,978
Cash invested: $184,520 (down + closing). Projections, not guarantees.
Landlord ↔ Tenant lean methodology
- Overall (STATE)
- 15 Strongly Tenant-Friendly
- State New York
- 15 Strongly Tenant-Friendly · D+10
- County
- — inherits STATE
- City
- — inherits STATE
ZIP-level market 10923
- Home prices YoY
- -30.6%
- Active inventory
- 37
- Price-to-rent
- 7.6×
Monthly cashflow live
- Estimated rent
- $7,250 medium interval (Pro) →
- Mortgage (P&I)
- −$3,456
- Tax est. 1.5%
- −$824 /mo · $9,885/yr
- Insurance
- −$275
- HOA
- −$0
- Vacancy / Maint / Mgmt
- −$1,522
- Net cashflow
- $1,173
Break-even live
UW: 25.0% down · 7.5% · 30yr · 1.5% tax · 5.0% vac · 8.0% maint · 8.0% mgmt
Financing live
Cash to close
- Down payment
- $164,750
- Closing costs
- $19,770
- Reserves months
- —
- Total cash needed
- —
Loan-product check · same deal, 3 products live
Conventional
25% down · 7.5% · 30yr
- Down + closing
- —
- Monthly P&I
- —
- Monthly cashflow
- —
- DSCR
- —
- Eligible?
- —
Personal DTI + credit; lowest rate.
DSCR
20% down · 8.5% · 30yr
- Down + closing
- —
- Monthly P&I
- —
- Monthly cashflow
- —
- DSCR
- —
- Eligible?
- —
No personal income docs; deal must DSCR.
Hard money
10% down · 12.0% · 12mo
- Down + closing
- —
- Monthly P&I
- —
- Monthly cashflow
- —
- DSCR
- —
- Eligible?
- —
Short-term bridge; refi at stabilization.
Rent comps 1 comps
| Address | Beds | Baths | Sqft | Rent | $/sqft | DOM | Units | Dist |
|---|---|---|---|---|---|---|---|---|
| 31 Gleason Dr Thiells, NY | 5.0 | 2.5 | 2008 | $7,250 | $3.61 | 1d | 1 | 1.50mi |
Listing history 18 events
-
2026-06-18days on market $659,000 Active 45 DOM
-
2026-06-17days on market $659,000 Active 44 DOM
-
2026-06-16days on market $659,000 Active 43 DOM
-
2026-06-15days on market $659,000 Active 42 DOM
-
2026-06-13pricedays on market $659,000 Active 40 DOM
-
2026-06-10days on market $685,000 Active 36 DOM
-
2026-06-08days on market $685,000 Active 35 DOM
-
2026-06-07days on market $685,000 Active 34 DOM
-
2026-06-04days on market $685,000 Active 31 DOM
-
2026-06-03days on market $685,000 Active 30 DOM
-
2026-06-02days on market $685,000 Active 29 DOM
-
2026-06-01days on market $685,000 Active 28 DOM
-
2026-05-31days on market $685,000 Active 27 DOM
-
2026-05-05$699,900 Active 867-char remark
-
2026-04-27historical $699,900 867-char remark
-
2012-07-13historical
-
2011-07-13
-
2004-02-05soldstatus $373,500
ⓘ Source: listings_history table (triggers on properties + properties_extension) + one-shot
backfill from property_details.listing_events for pre-trigger history.
Climate risk First Street
- Flood 1/10 Low FEMA zone X (unshaded) · 0% chance over 30 yrs
- Wildfire 3/10 Moderate
- Heat 5/10 Major 7 d/yr ≥99°F today · 15 d/yr by 30 yrs out
- Wind 4/10 Moderate 23% chance of damaging wind over 30 yrs
- Air quality 3/10 Moderate 2 unhealthy d/yr today · 3 by 30 yrs out
Nearby sold comps map
Loading sold comps map…
Walkable amenities ~0.75 mi
Loading nearby amenities…
Taxation est. · year 1
- Rental income
- $87,000
- − Mortgage interest
- −$36,914
- − Property taxes
- −$9,885
- − Insurance
- −$3,295
- − Repairs & maintenance
- −$6,960
- − Management
- −$6,960
- − Depreciation
- −$19,171
- Taxable income
- $3,815
- Est. tax owed @ 24.0%
- −$916
- After-tax cash flow
- $13,164/yr
For passive investors: Depreciation is non-cash, so a rental often shows a tax loss while cash-flowing — sheltering income. Rental losses are passive: they offset passive income freely, and up to $25,000/yr can offset ordinary (W-2) income if you actively participate and your MAGI is under $100k (phasing out to $0 by $150k); unused losses carry forward. On sale, claimed depreciation is recaptured at up to 25%, and gains may owe capital-gains tax (a 1031 exchange can defer both). Figures are a year-1 estimate at your 24.0% rate — not tax advice; consult a CPA.
Schools (NCES district)
- District
- Haverstraw-Stony Point CSD (North Rockland)
- NCES district ID
- 3614010
- Math proficiency
- 41% ▼ -7.00%
- Reading proficiency
- 47% ▼ -1.00%
- Median HH income
- $80,218
- Composite
- 40.68/100
- National rank
- #3672
- State rank
- #427 of 590 in NY
Livability — Thiells
- Score
- 70/100
- State rank
- #432
- US rank
- #7476
Category grades
Schools grade is shown separately in the Schools card above.
Census & demographics
- Census place
- Thiells, NY
- City population
- 2,760
- Population (ZIP)
- 9,188
Population outlook (Rockland County) Hauer SSP2
- Today (2025)
- 339,642 people
- By 2030
- 345,987 · +1.9%
- By 2040
- 357,178 · +5.2%
- By 2050
- 362,456 · +6.7%
- By 2075
- 367,281 · +8.1%
- By 2100
- 328,211 · -3.4%
Race, ethnicity, and origin ACS 2023
- Neighborhood character
- Diverse neighborhood (Simpson 0.60)
- Race & ethnicity
- Hispanic / Latino 56% White 27% Two or more races 19% Black 10% Asian 5%
- Hispanic origin (detail)
- Mexican 3% Puerto Rican 12% Dominican 19%
- Common ancestry
- Romanian 2% Hispanic 2% Scotch-Irish 1%
- Foreign-born
- 26% · Canada, Jamaica, China
- Languages at home
- 50% English-only · Spanish 40% Tagalog/Filipino 3% French/Haitian/Cajun 3%
Political lean MEDSL · Rockland
- 2024 margin
- R (+11.8) · D 44.1% · R 55.9%
- 2008→2024 swing
- -17.7pp toward R · 2008: 5.9pp · 2024: -11.8pp
- All cycles
- 2024: R+11.8 2020: D+1.7 2016: D+5.1 2012: D+6.6 2008: D+5.9
Not yet ingested
- Civics
- —
Market trends
- HPI YoY
- ▼ -126.27%
- Current HPI
- 285.9496
- Rent YoY
- —
- Metro
- —
- State GDP YoY
- ▲ 2.60%
- F500 in state
- 92
Industry mix (Fortune 500 HQ in NY)
| Industry | F500 HQs | Revenue |
|---|---|---|
| Financial Services | 10 | $950B |
|
||
| Consumer Goods | 9 | $162B |
|
||
| Insurance | 4 | $225B |
|
||
| Telecommunications | 2 | $144B |
|
||
| Pharmaceuticals | 2 | $112B |
|
||
| Media / Entertainment | 2 | $69B |
|
||
Price history
+76.4% since first listed7 events — show timeline
- 2026-06-13 Price Changed $659,000 OneKey® MLS as Distributed by MLS Grid
- 2026-05-20 Price Changed $685,000 OneKey® MLS as Distributed by MLS Grid
- 2026-05-05 Listed $699,900 OneKey® MLS as Distributed by MLS Grid
- 2026-04-27 Coming Soon $699,900 OneKey® MLS as Distributed by MLS Grid
- 2012-07-13 Delisted — HGMLS
- 2011-07-13 Listed — HGMLS
- 2004-02-05 Sold (Public Records) $373,500 Public Records
Property tax history
+8.5%/yrLatest (2025): $33,567 · +25.1% YoY. Source: county tax records.
Cash-flow waterfall
monthlySold comps — $/sqft
last 12 mo · ≤1 miLoading sold comps…