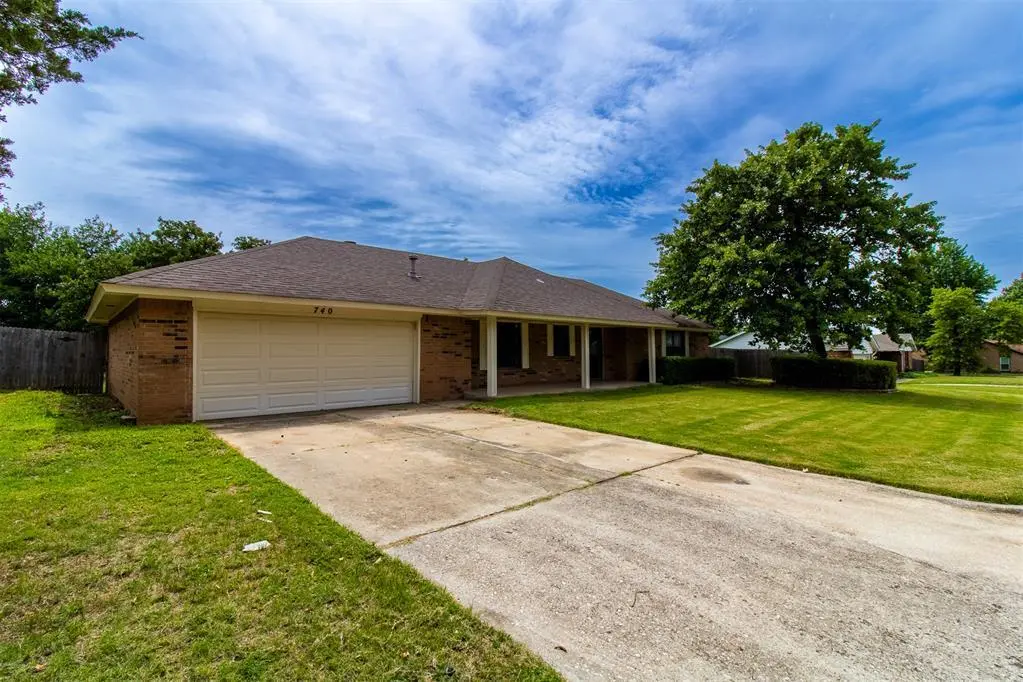
740 Buckwood Dr · Choctaw, OK
Flood risk 1/10 · Minimal
- FEMA flood zone
- X (unshaded)
- Chance of flooding over 30 yrs
- 0.0%
- Est. flood insurance / yr
- $507 – $1,088
Fire risk 5/10 · Moderate
- Est. fire insurance / yr
- $2,463 – $4,575
Heat risk 6/10 · Moderate
- Hot days now (above 108°F)
- 7 days/yr
- Hot days in 30 yrs
- 20 days/yr
Wind risk 2/10 · Minimal
- Chance of severe wind over 30 yrs
- 3.0%
Air-quality risk 2/10 · Minimal
- Unhealthy air days now
- 1 days/yr
- Unhealthy air days in 30 yrs
- 2 days/yr
Risk factors via First Street. Map © Google.
Why this score? — see what drove the D grade
The composite is a weighted blend of 9 inputs, each scored 0–100. Each bar is that input's sub-score; the figure is the points it added to the 100-point composite (weight × sub-score).
- Cash flow +12.9/30.0
- ARV discount +9.5/15.0
- DSCR +3.9/10.0
- 1% rule +3.7/10.0
- Livability +3.6/5.0
- Schools +2.8/10.0
- Rent growth +2.5/5.0
- Condition / age +2.5/5.0
- Appreciation +0.0/10.0
$214,900
🖨 Deal sheet (PDF) 📄 Offer letter ✓ Due diligence
Listing remarks MLS
ABSOLUTLY OUTSTANDING! SUPER CLEAN! READY TO MOVE IN. SELLER HAS HAD ROOF REPLACED, EXTRA INSULATION PUT IN ATTIC! OVERSIZED 2 CAR GARAGE! YOU HAVE TO SEE IT TO BELEIVE IT!
Key facts
- New water tank
- Large lot
- Painted interior
Tags
Property features AI
Finance
- Other: Occupied by owner; No home warranty
- Financial info: Not assumable
- HOA & community: No mandatory association dues
Exterior
- Parking: 2-car garage
- Utilities: No storm shelter; Homestead exempt (yes)
- Home design: Single-family residence; One-story; Residential property
- Construction: Brick and frame construction; Composition roof; Slab foundation
- Exterior features: Covered porch; Outbuildings; Interior lot
Interior
- Kitchen: Free-standing electric range and oven; Breakfast bar
- Bedrooms: 3 bedrooms; Primary bedroom with built-ins, ceiling fan, full bath, shower and walk-in closet
- Bathrooms: 2 full bathrooms
- Interior features: Built-in bookcase in living room; Ceiling fans; Fireplace (masonry); Inside utility room; Smoke alarm; Garage door opener
- Laundry & utility: Inside utility
Neighborhood map
What this means for you Summary
Snapshot
- This is a 3-bed/2.0-bath single-family listed at $215k.
Deal economics
- At list price, monthly cash flow is $-16 ($-189/yr) — negative.
- To cash-flow at today's rent, offer at most $213k (1.1% below list).
- To meet the 1% rule (rent ≥ 1% of price), the offer needs to be $186k (13.4% below list).
- Recommended offer: $186k (13.4% below list) — sets the bar for 1% rule.
- Cap rate 6.2% vs local median 3.1% in Choctaw — top-decile yield for the area; either an underpriced asset or a hidden risk that comps aren't pricing in. Stress-test before assuming the spread holds.
Location & tenants
- Location reads 71/100 on livability (#31 in OK) — a middle-class / working-renter tenant base. Strengths: employment A+, cost of living A+, housing A+; Watch: amenities F, commute F, health & safety F.
- Choctaw-Nicoma Park (suburban): math 28% / reading 32% proficiency, ranked #48 of 270 in OK (top 18%) — families likely to look elsewhere, expect single-tenant / working-renter base with shorter leases.
- Zoned schools: L. W. Westfall Es (math 52% / reading 47%, grade D, #42 of 845 statewide, top 5%, 448 students, 0% FRL); Choctaw Hs (math 26% / reading 37%, grade F, #73 of 447 statewide, top 16%, 1,811 students, 0% FRL) — zoned schools average 0% FRL vs 34% district-wide (34 pts lower); this property's tenant base skews higher-income than the district average.
- Market conditions: 326 active listings in the ZIP; 1 comparable units currently listed for rent nearby; solid renter incomes; 5,365 units permitted in Oklahoma County in 2024 (569 in 5+ unit buildings).
Forward outlook
- Local home prices are declining (-3.0%/yr); year-one equity from $1k of loan paydown is wiped out by about $6k of value loss. Plan a longer hold.
- Oklahoma County population projected at +41% by 2050 — long-run rental-demand tailwind backs the buy-and-hold thesis.
Negotiation context
- Only 14 days on market — expect competitive offers; lowballing is unlikely to land.
- 2 sale attempts since 22y ago with the ask held roughly flat each time — persistent listings suggest the price (not the market) is what's stuck; bring a comps-based counter.
- Current owner paid $96k; list at $215k implies a 124% gain — meaningful room to come down on a strong offer.
Risks & watch-outs
- Climate carrying-cost: moderate wildfire risk; extreme-heat days projected 7→20/yr by 2055 (HVAC capex compounding) — expect insurance premiums to compound above CPI over the hold.
Questions for the listing agent
- What do current leases actually rent for vs. the listed asking? Can we see a recent rent roll and the last 12 months of T-12 income?
- Built in 1979 — when were the roof, HVAC, electrical panel, plumbing, and water heater last replaced?
- Is there a deadline driving the sale (1031 exchange, divorce, estate, relocation)? That informs how much negotiation room exists.
- Schools are D-rated, which usually means shorter tenancies and higher turnover. Who's the typical renter profile here, and what's been the actual vacancy rate?
- The area grade is low — what's the realistic commute time and amenity access for the typical tenant pool here? Any planned neighborhood developments (good or bad) we should know about?
- What's the average days-on-market for RENTAL listings here right now (not sales)? A rising rental-DOM trend means longer vacancies and softer asking-rent achievability than the comps imply.
- What's the recent tenant-quality profile in this submarket — average credit score on applications, eviction rate, late-payment / NSF rate, and stable-employment percentage? A property-management company in the area should have these aggregated.
- How much new for-sale + rental construction is in the pipeline within 1–3 miles? Heavy new supply typically softens prices + rents 12–24 months out; constrained supply supports both.
Investment metrics
- 1% rule
- 0.87% ✗
- Cap rate
- 6.20%
- Cash-on-cash
- -0.31%
- DSCR
- 0.99
- GRM
- 9.6
CMA / ARV
- ARV (on-the-fly)
- $225,078
- Comps found
- 12
Show comp detail 12 sales within ~0.75 mi
| Address | Dist | Beds/Ba | Sqft | Sold | Price | $/sf | Match |
|---|---|---|---|---|---|---|---|
| 540 Oak Park Dr | 0.20mi | 3/2.0 | 1,340 (-4%) | 3mo | $212,000 | $158 | 81 |
| 905 Sandy Ln | 0.13mi | 3/1.0 | 1,258 (-10%) | 1mo | $162,000 | $129 | 73 |
| 855 Twisted Oak Dr | 0.13mi | 3/2.0 | 1,584 (+13%) | 1mo | $215,000 | $136 | 71 |
| 687 Oak Park Dr | 0.19mi | 3/2.0 | 1,511 (+8%) | 12mo | $273,000 | $181 | 68 |
| 14580 NE 6th St | 0.06mi | 3/2.0 | 1,580 (+13%) | 10mo | $235,000 | $149 | 67 |
| 14516 Park Cir | 0.41mi | 3/2.0 | 1,450 (+4%) | 12mo | $249,900 | $172 | 65 |
| 600 Oak Park Dr | 0.17mi | 3/1.5 | 1,201 (-14%) | 11mo | $213,000 | $177 | 57 |
| 14313 Redvine Rd | 0.50mi | 3/2.0 | 1,581 (+13%) | 3mo | $254,000 | $161 | 52 |
| 13801 NE 8th St | 0.65mi | 3/2.0 | 1,284 (-8%) | 8mo | $220,000 | $171 | 49 |
| 14214 NE 5th St | 0.37mi | 2/1.5 (-1) | 1,188 (-15%) | 11mo | $180,000 | $152 | 42 |
| 805 Thomas Ln | 0.71mi | 3/2.0 | 1,515 (+8%) | 14mo | $213,000 | $141 | 41 |
| 13801 NE 9th St | 0.68mi | 4/2.0 (+1) | 1,538 (+10%) | 10mo | $255,000 | $166 | 38 |
Match score weights: distance 35% · size 25% · config 20% · recency 20%. Top-matched comps best support the ARV.
Projected returns pro-forma
-3.0% appreciation · 3.0% rent growth · sell at horizon
- IRR
- -16.8%
- Equity multiple
- 0.41×
- Total profit
- $-35,798
- Equity at exit
- $32,042
- IRR
- -8.6%
- Equity multiple
- 0.46×
- Total profit
- $-32,350
- Equity at exit
- $18,581
Cash invested: $60,172 (down + closing). Projections, not guarantees.
Landlord ↔ Tenant lean methodology
- Overall (STATE)
- 83 Strongly Landlord-Friendly
- State Oklahoma
- 83 Strongly Landlord-Friendly · R+20
- County
- — inherits STATE
- City
- — inherits STATE
ZIP-level market 73020
- Active inventory
- 326
- Price-to-rent
- 9.6×
Monthly cashflow live
- Estimated rent
- $1,860 medium interval (Pro) →
- Mortgage (P&I)
- −$1,127
- Tax est. 1.5%
- −$269 /mo · $3,224/yr
- Insurance
- −$90
- HOA
- −$0
- Vacancy / Maint / Mgmt
- −$391
- Net cashflow
- $-16
Break-even live
Sensitivity live
| Price | -10% $133 | -5% $59 | +0% $-16 | +5% $-90 | +10% $-164 |
|---|---|---|---|---|---|
| Rent | -10% $-163 | -5% $-89 | +0% $-16 | +5% $58 | +10% $131 |
| Rate | -1.0pp $92 | -0.5pp $39 | base $-16 | +0.5pp $-71 | +1.0pp $-128 |
UW: 25.0% down · 7.5% · 30yr · 1.5% tax · 5.0% vac · 8.0% maint · 8.0% mgmt
Financing live
Cash to close
- Down payment
- $53,725
- Closing costs
- $6,447
- Reserves months
- —
- Total cash needed
- —
Loan-product check · same deal, 3 products live
Conventional
25% down · 7.5% · 30yr
- Down + closing
- —
- Monthly P&I
- —
- Monthly cashflow
- —
- DSCR
- —
- Eligible?
- —
Personal DTI + credit; lowest rate.
DSCR
20% down · 8.5% · 30yr
- Down + closing
- —
- Monthly P&I
- —
- Monthly cashflow
- —
- DSCR
- —
- Eligible?
- —
No personal income docs; deal must DSCR.
Hard money
10% down · 12.0% · 12mo
- Down + closing
- —
- Monthly P&I
- —
- Monthly cashflow
- —
- DSCR
- —
- Eligible?
- —
Short-term bridge; refi at stabilization.
Rent comps 1 comps
| Address | Beds | Baths | Sqft | Rent | $/sqft | DOM | Units | Dist |
|---|---|---|---|---|---|---|---|---|
| 14505 Park Cir Choctaw, OK | 3.0 | 2.0 | 1458 | $1,785 | $1.22 | 16d | 1 | 0.42mi |
Listing history 10 events
-
2026-06-18days on market $214,900 Active 14 DOM
-
2026-06-17days on market $214,900 Active 13 DOM
-
2026-06-16days on market $214,900 Active 12 DOM
-
2026-06-15days on market $214,900 Active 11 DOM
-
2026-06-13days on market $214,900 Active 9 DOM
-
2026-06-13days on market $214,900 Active 8 DOM
-
2026-06-09days on market $214,900 Active 5 DOM
-
2026-06-08days on market $214,900 Active 4 DOM
-
2026-06-07remarks 516-char remark
-
2026-06-07$214,900 Active 3 DOM
ⓘ Source: listings_history table (triggers on properties + properties_extension) + one-shot
backfill from property_details.listing_events for pre-trigger history.
Climate risk First Street
- Flood 1/10 Low FEMA zone X (unshaded) · 0% chance over 30 yrs
- Wildfire 5/10 Major
- Heat 6/10 Major 7 d/yr ≥108°F today · 20 d/yr by 30 yrs out
- Wind 2/10 Low 3% chance of damaging wind over 30 yrs
- Air quality 2/10 Low 1 unhealthy d/yr today · 2 by 30 yrs out
Nearby sold comps map
Loading sold comps map…
Walkable amenities ~0.75 mi
Loading nearby amenities…
Taxation est. · year 1
- Rental income
- $22,320
- − Mortgage interest
- −$12,038
- − Property taxes
- −$3,224
- − Insurance
- −$1,074
- − Repairs & maintenance
- −$1,786
- − Management
- −$1,786
- − Depreciation
- −$6,252
- Taxable loss
- −$3,839
- Est. tax savings @ 24.0%
- +$921
- After-tax cash flow
- $732/yr
For passive investors: Depreciation is non-cash, so a rental often shows a tax loss while cash-flowing — sheltering income. Rental losses are passive: they offset passive income freely, and up to $25,000/yr can offset ordinary (W-2) income if you actively participate and your MAGI is under $100k (phasing out to $0 by $150k); unused losses carry forward. On sale, claimed depreciation is recaptured at up to 25%, and gains may owe capital-gains tax (a 1031 exchange can defer both). Figures are a year-1 estimate at your 24.0% rate — not tax advice; consult a CPA.
Schools (NCES district)
- District
- Choctaw-Nicoma Park
- NCES district ID
- 4007620
- Math proficiency
- 28% ▼ -10.00%
- Reading proficiency
- 32% ▼ -12.00%
- Median HH income
- $69,072
- Composite
- 28.02/100
- National rank
- #6847
- State rank
- #48 of 270 in OK
Livability — Choctaw
- Score
- 71/100
- State rank
- #31
- US rank
- #6853
Category grades
Schools grade is shown separately in the Schools card above.
Census & demographics
- Census place
- Choctaw, OK
- County
- Oklahoma County · 771,644 people
- City population
- 25,645
- Metro
- Oklahoma City, OK
- Population (ZIP)
- 25,645
- Household income
- $104,601
- Rent vs Own
- Severe rent burden
- 258.0
Population outlook (Oklahoma County) Hauer SSP2
- Today (2025)
- 911,875 people
- By 2030
- 982,413 · +7.7%
- By 2040
- 1,130,468 · +24.0%
- By 2050
- 1,288,422 · +41.3%
- By 2075
- 1,711,482 · +87.7%
- By 2100
- 2,088,448 · +129.0%
Race, ethnicity, and origin ACS 2023
- Neighborhood character
- Predominantly White (77%)
- Race & ethnicity
- White 77% Two or more races 8% Hispanic / Latino 6% Black 5% Native American 4% Asian 2%
- Hispanic origin (detail)
- Mexican 5%
- Common ancestry
- Lithuanian 2% Italian 2% Iranian 2%
- Foreign-born
- 3% · Canada, China
- Languages at home
- 96% English-only · Spanish 2%
Political lean MEDSL · Oklahoma
- 2024 margin
- Toss-up / Even · D 48.0% · R 49.7% · Other 2.3%
- 2008→2024 swing
- +15.1pp toward D · 2008: -16.8pp · 2024: -1.7pp
- All cycles
- 2024: R+1.7 2020: R+1.1 2016: R+10.5 2012: R+16.7 2008: R+16.8
Not yet ingested
- Civics
- —
Market trends
- HPI YoY
- ▼ -131.61%
- Current HPI
- 240.9989
- Rent YoY
- —
- Metro
- Oklahoma City, OK
- State GDP YoY
- ▲ 1.55%
- F500 in state
- 6
Industry mix (Fortune 500 HQ in OK)
| Industry | F500 HQs | Revenue |
|---|---|---|
| Energy | 3 | $48B |
|
||
Price history
+252.3% since first listed5 events — show timeline
- 2026-06-04 Listed $214,900 MLSOK
- 2004-10-04 Sold (Public Records) $96,000 Public Records
- 2004-10-01 Sold (MLS) $96,000 MLSOK
- 2004-07-28 Listed $96,000 MLSOK
- 1981-04-01 Sold (Public Records) $61,000 Public Records
Cash-flow waterfall
monthlySold comps — $/sqft
last 12 mo · ≤1 miLoading sold comps…