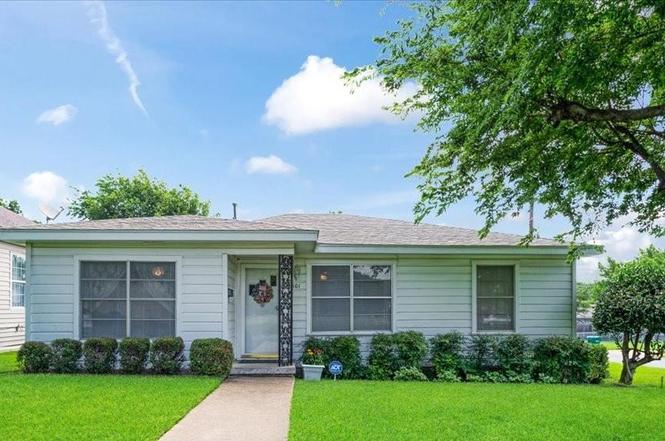
101 N Burdette Ave · Sherman, TX
Flood risk 1/10 · Minimal
- FEMA flood zone
- X (unshaded)
- Chance of flooding over 30 yrs
- 0.0%
- Est. flood insurance / yr
- $507 – $1,088
Fire risk 6/10 · Moderate
- Est. fire insurance / yr
- $1,222 – $2,270
Heat risk 6/10 · Moderate
- Hot days now (above 108°F)
- 7 days/yr
- Hot days in 30 yrs
- 22 days/yr
Wind risk 4/10 · Minor
- Chance of severe wind over 30 yrs
- 22.0%
Air-quality risk 3/10 · Minor
- Unhealthy air days now
- 2 days/yr
- Unhealthy air days in 30 yrs
- 3 days/yr
Risk factors via First Street. Map © Google.
Why this score? — see what drove the D+ grade
The composite is a weighted blend of 9 inputs, each scored 0–100. Each bar is that input's sub-score; the figure is the points it added to the 100-point composite (weight × sub-score).
- Cash flow +15.3/30.0
- ARV discount +15.0/15.0
- DSCR +4.7/10.0
- 1% rule +4.5/10.0
- Livability +3.1/5.0
- Schools +2.9/10.0
- Condition / age +2.5/5.0
- Rent growth +1.8/5.0
- Appreciation +0.0/10.0
$165,000
🖨 Deal sheet (PDF) 📄 Offer letter ✓ Due diligence
Listing remarks
WELCOME HOME to your well cared for 3 bedroom, two bath home on a CORNER LOT! You walk into a large living, dining room that is OPEN to the SPACIOUS kitchen! There is a full washer, dryer closet conveniently located in the kitchen by the primary suite. A good-sized peninsula allows for extra seating in the dining room. The primary bedroom and bath are off of the kitchen, away from the other two bedrooms for extra privacy. Bedrooms 2 and 3 are off of the living room (through a pocket door for saved space) and share a full bath. There are original hardwoods under the carpet in these two bedrooms! From the kitchen you will find your covered deck that has a ramp for easy access. A great plac
Key facts
- Covered deck
- Large garage
- Good sized peninsula
Tags
Property features AI
Finance
- Other: Property type: Single Family Residence; Lot is under 0.5 acre (approx. 0.172 acres); Other structures on lot include a workshop with electric; Horse not permitted
- Financial info: Listing terms include Cash, Conventional, FHA, and VA loan; No second mortgage reported
- HOA & community: No homeowners association; Community curbs
Exterior
- Parking: Driveway; Covered parking for 2 vehicles; 2-car garage with single doors; Garage faces side; Garage includes storage and workshop area; Garage is approximately 22 ft wide by 21 ft long
- Security: Burglar alarm; Smoke detectors
- Utilities: City water and city sewer; Electricity connected; Individual gas meter and individual water meter; Cable available; Alley access and curbs
- Home design: Single-family residence; One-story; Residential property; Corner lot in a subdivision; Large grassy backyard with few trees; Facing direction not specified
- Construction: Built in 1958 (preowned); Wood construction; Composition/shingle roof; Pillar/post/pier foundation
- Exterior features: Covered deck; Covered porch/deck; Gutters; Storage; Workshop with electric
Interior
- Kitchen: Built-in cabinets; Kitchen island; Pantry; Tile counters; Electric cooktop; Electric oven; Microwave; Garbage disposal; Dishwasher; Water line to refrigerator
- Bedrooms: Primary bedroom (level 1) with ensuite bath and linen closet; Bedroom (level 1); Bedroom (level 1)
- Flooring: Carpet; Laminate; Linoleum; Tile
- Bathrooms: Two full bathrooms; Primary bathroom features built-in cabinets, linen closet, and solid-surface counters; Second bathroom features built-in cabinets, linen closet, and solid-surface counters
- Heating & cooling: Central heating (natural gas); Central air conditioning (electric); Ceiling fans
- Interior features: Open floorplan with natural woodwork and paneling; Kitchen island and pantry; Tile countertops; Chandelier; Cable TV and high-speed internet available; Window coverings
- Laundry & utility: Washer and dryer hookups (full-size); Electric dryer hookup; Washer hookup; Laundry area located in kitchen; Utility closet
Neighborhood map
What this means for you Summary
Snapshot
- This is a 3-bed/1.0-bath single-family listed at $165k.
Deal economics
- At list price, monthly cash flow is $60 ($725/yr) — positive.
- The deal already cash-flows at list — no discount required.
- To meet the 1% rule (rent ≥ 1% of price), the offer needs to be $157k (5.1% below list).
- Recommended offer: $157k (5.1% below list) — sets the bar for 1% rule.
- Cap rate 6.7% vs local median 3.7% in Sherman — top-decile yield for the area; either an underpriced asset or a hidden risk that comps aren't pricing in. Stress-test before assuming the spread holds.
Location & tenants
- Location reads 61/100 on livability (#1,027 in TX) — a middle-class / working-renter tenant base. Strengths: cost of living A+, housing A+; Watch: crime C-, employment C-, amenities F.
- Sherman ISD (urban): math 31% / reading 37% proficiency, ranked #546 of 826 in TX (top 66%) — families likely to look elsewhere, expect single-tenant / working-renter base with shorter leases.
- Zoned schools: Dillingham El (837 students, 91% FRL); Piner Middle (math 31% / reading 41%, grade F, #805 of 1,662 statewide, top 50%, 818 students, 75% FRL); Sherman H S (math 28% / reading 44%, grade F, #930 of 1,632 statewide, top 57%, 2,155 students, 70% FRL) — zoned schools average 79% FRL vs 60% district-wide (19 pts higher); higher-poverty schools than district average — tighter screening recommended.
- Market conditions: Rents soft (-2.7%/yr); 479 active listings in the ZIP; 38 comparable units currently listed for rent nearby; rentals lingering (median 46d on market — plan ~5-8 weeks vacancy on turnover, expect pricing pressure); 61% of comp listings sitting > 30 days — soft ceiling on asking rent; 2,272 units permitted in Grayson County in 2024 (750 in 5+ unit buildings).
- This rent runs 34% of the median local income ($56k/yr) — at the standard rent-burdened threshold; future hikes will face affordability resistance.
Forward outlook
- Local home prices are declining (-3.0%/yr); year-one equity from $1k of loan paydown is wiped out by about $5k of value loss. Plan a longer hold.
- Grayson County population projected at +12% by 2050 — modest demand growth; plan on rents tracking national, not racing it.
Negotiation context
- Only 1 days on market — expect competitive offers; lowballing is unlikely to land.
Risks & watch-outs
- Watch-outs: built in 1958 — expect roof / HVAC / electrical / plumbing capex.
- Climate carrying-cost: major wildfire risk; extreme-heat days projected 7→22/yr by 2055 (HVAC capex compounding) — expect insurance premiums to compound above CPI over the hold.
Questions for the listing agent
- Built in 1958 — when were the roof, HVAC, electrical panel, plumbing, and water heater last replaced?
- Is there a deadline driving the sale (1031 exchange, divorce, estate, relocation)? That informs how much negotiation room exists.
- Schools are D-rated, which usually means shorter tenancies and higher turnover. Who's the typical renter profile here, and what's been the actual vacancy rate?
- The area grade is low — what's the realistic commute time and amenity access for the typical tenant pool here? Any planned neighborhood developments (good or bad) we should know about?
- What's the average days-on-market for RENTAL listings here right now (not sales)? A rising rental-DOM trend means longer vacancies and softer asking-rent achievability than the comps imply.
- What's the recent tenant-quality profile in this submarket — average credit score on applications, eviction rate, late-payment / NSF rate, and stable-employment percentage? A property-management company in the area should have these aggregated.
- How much new for-sale + rental construction is in the pipeline within 1–3 miles? Heavy new supply typically softens prices + rents 12–24 months out; constrained supply supports both.
Investment metrics
- 1% rule
- 0.95% ✗
- Cap rate
- 6.73%
- Cash-on-cash
- 1.57%
- DSCR
- 1.07
- GRM
- 8.8
CMA / ARV
- ARV (on-the-fly)
- $212,850
- Comps found
- 12
Show comp detail 12 sales within ~0.75 mi
| Address | Dist | Beds/Ba | Sqft | Sold | Price | $/sf | Match |
|---|---|---|---|---|---|---|---|
| 1821 E Pecan St | 0.14mi | 2/1.5 (-1) | 1,350 (+5%) | 6mo | $160,000 | $119 | 74 |
| 315 N Carr Ave | 0.17mi | 3/2.0 | 1,377 (+7%) | 6mo | $175,000 | $127 | 72 |
| 702 Hillside Dr | 0.45mi | 3/2.0 | 1,308 (+1%) | 2mo | $170,000 | $130 | 71 |
| 701 Hillside Dr | 0.46mi | 3/2.0 | 1,272 (-1%) | 2mo | $210,000 | $165 | 71 |
| 818 N Brents Ave | 0.52mi | 3/1.5 | 1,325 (+3%) | 0mo | $225,000 | $170 | 69 |
| 520 Hillside Dr | 0.33mi | 3/2.0 | 1,186 (-8%) | 2mo | $179,000 | $151 | 66 |
| 508 N Elliott St | 0.35mi | 3/2.0 | 1,372 (+6%) | 5mo | $259,999 | $190 | 65 |
| 2005 E Leslie Ln | 0.57mi | 3/2.0 | 1,407 (+9%) | 4mo | $245,000 | $174 | 51 |
| 746 S Valentine Dr | 0.63mi | 3/2.0 | 1,387 (+8%) | 4mo | $175,000 | $126 | 50 |
| 754 Patricia Dr | 0.63mi | 3/2.0 | 1,392 (+8%) | 7mo | $192,500 | $138 | 48 |
| 713 Hillside Dr | 0.49mi | 4/2.0 (+1) | 1,439 (+12%) | 1mo | $245,000 | $170 | 48 |
| 517 S Vaden St | 0.66mi | 3/2.0 | 1,107 (-14%) | 6mo | $213,000 | $192 | 36 |
Match score weights: distance 35% · size 25% · config 20% · recency 20%. Top-matched comps best support the ARV.
Projected returns pro-forma
-3.0% appreciation · 0.0% rent growth · sell at horizon
- IRR
- -17.3%
- Equity multiple
- 0.41×
- Total profit
- $-27,433
- Equity at exit
- $24,602
- IRR
- -16.5%
- Equity multiple
- 0.21×
- Total profit
- $-36,479
- Equity at exit
- $14,266
Cash invested: $46,200 (down + closing). Projections, not guarantees.
Landlord ↔ Tenant lean methodology
- Overall (STATE)
- 87 Strongly Landlord-Friendly
- State Texas
- 87 Strongly Landlord-Friendly · R+5
- County
- — inherits STATE
- City
- — inherits STATE
ZIP-level market 75090
- Home prices YoY
- -20.0%
- Rents YoY
- -2.7%
- Active inventory
- 479
- Price-to-rent
- 8.8×
Monthly cashflow live
- Estimated rent
- $1,565 high interval (Pro) →
- Mortgage (P&I)
- −$865
- Tax from tax record
- −$242 /mo · $2,906/yr
- Insurance
- −$69
- HOA
- −$0
- Vacancy / Maint / Mgmt
- −$329
- Net cashflow
- $60
Break-even live
Sensitivity live
| Price | -10% $154 | -5% $107 | +0% $60 | +5% $14 | +10% $-33 |
|---|---|---|---|---|---|
| Rent | -10% $-63 | -5% $-1 | +0% $60 | +5% $122 | +10% $184 |
| Rate | -1.0pp $143 | -0.5pp $102 | base $60 | +0.5pp $18 | +1.0pp $-26 |
UW: 25.0% down · 7.5% · 30yr · 1.5% tax · 5.0% vac · 8.0% maint · 8.0% mgmt
Financing live
Cash to close
- Down payment
- $41,250
- Closing costs
- $4,950
- Reserves months
- —
- Total cash needed
- —
Loan-product check · same deal, 3 products live
Conventional
25% down · 7.5% · 30yr
- Down + closing
- —
- Monthly P&I
- —
- Monthly cashflow
- —
- DSCR
- —
- Eligible?
- —
Personal DTI + credit; lowest rate.
DSCR
20% down · 8.5% · 30yr
- Down + closing
- —
- Monthly P&I
- —
- Monthly cashflow
- —
- DSCR
- —
- Eligible?
- —
No personal income docs; deal must DSCR.
Hard money
10% down · 12.0% · 12mo
- Down + closing
- —
- Monthly P&I
- —
- Monthly cashflow
- —
- DSCR
- —
- Eligible?
- —
Short-term bridge; refi at stabilization.
Rent comps 38 comps
| Address | Beds | Baths | Sqft | Rent | $/sqft | DOM | Units | Dist |
|---|---|---|---|---|---|---|---|---|
| 217 N Burdette Ave Sherman, TX | 3.0 | 1.0 | 1288 | $1,400 | $1.09 | 45d | 1 | 0.13mi |
| 108 N Cleveland Ave Sherman, TX | 3.0 | 1.5 | 1060 | $1,200 | $1.13 | 45d | 1 | 0.27mi |
| 422 N Elliott St Sherman, TX | 3.0 | 2.5 | 1500 | $1,650 | $1.10 | 23d | 1 | 0.36mi |
| 408 N Cleveland Ave Sherman, TX | 2.0 | 2.5 | 1132 | $1,300 | $1.15 | 45d | 1 | 0.37mi |
| 1313 E Lamar St Sherman, TX | 2.0 | 1.0 | 1308 | $1,425 | $1.09 | 23d | 1 | 0.43mi |
| 615 N Cleveland Ave #617 Sherman, TX | 3.0 | 2.0 | 1316 | $1,600 | $1.22 | 45d | 1 | 0.46mi |
| 706 N Harrison Ave Ste 100 Sherman, TX | 3.0 | 2.5 | 1350 | $1,395 | $1.03 | 23d | 1 | 0.49mi |
| 1201 E Lamar St Sherman, TX | 3.0 | 2.0 | 1726 | $1,995 | $1.16 | 45d | 1 | 0.53mi |
| 1429 E Odneal St Sherman, TX | 3.0 | 2.0 | 1218 | $1,700 | $1.40 | 45d | 1 | 0.55mi |
| 913 N Brents Ave Sherman, TX | 3.0 | 2.5 | 1419 | $1,500 | $1.06 | 45d | 1 | 0.61mi |
| 1014 E Pecan St Sherman, TX | 3.0 | 2.0 | 1340 | $1,900 | $1.42 | 45d | 1 | 0.63mi |
| 1014 N Brents Ave #1012 Sherman, TX | 3.0 | 2.0 | 1208 | $1,350 | $1.12 | 45d | 1 | 0.67mi |
| 924 S Lee Ave Sherman, TX | 2.0 | 1.0 | 1525 | $1,250 | $0.82 | 45d | 1 | 0.72mi |
| 902 E Cherry St Sherman, TX | 3.0 | 1.0 | 1530 | $1,400 | $0.92 | 45d | 1 | 0.74mi |
| 1110 N Ross Ave Sherman, TX | 3.0 | 2.0 | 1377 | $1,750 | $1.27 | 23d | 1 | 0.74mi |
| 1338 McCall St Sherman, TX | 3.0 | 2.0 | 1248 | $1,525 | $1.22 | 45d | 1 | 0.81mi |
| 1121 Patricia Dr Sherman, TX | 3.0 | 2.0 | 1472 | $1,450 | $0.99 | 23d | 1 | 0.86mi |
| 815 S Willow St Sherman, TX | 4.0 | 2.0 | 1670 | $1,495 | $0.90 | 45d | 1 | 0.87mi |
| 1509 Fairway Dr Sherman, TX | 3.0 | 2.0 | 1510 | $1,664 | $1.10 | 23d | 1 | 0.98mi |
| 822 S Throckmorton St Sherman, TX | 3.0 | 2.0 | 1288 | $1,350 | $1.05 | 45d | 1 | 1.01mi |
| 1124 S Hazelwood St Sherman, TX | 3.0 | 2.0 | 1347 | $1,650 | $1.22 | 45d | 1 | 1.01mi |
| 1610 Linda Dr Sherman, TX | 3.0 | 2.0 | 1500 | $1,714 | $1.14 | 23d | 1 | 1.02mi |
| 609 E Carter St Sherman, TX | 3.0 | 2.0 | 1230 | $1,450 | $1.18 | 23d | 1 | 1.03mi |
| 607 E Carter St Unit 609 Sherman, TX | 3.0 | 2.0 | 1230 | $1,450 | $1.18 | 23d | 1 | 1.04mi |
| 608 E College St Unit 608 Sherman, TX | 3.0 | 2.0 | 1230 | $1,325 | $1.08 | 23d | 1 | 1.05mi |
| 916 N Throckmorton St Sherman, TX | 3.0 | 2.0 | 1259 | $1,400 | $1.11 | 23d | 1 | 1.05mi |
| 614 E College St Sherman, TX | 3.0 | 2.0 | 1238 | $1,400 | $1.13 | 23d | 1 | 1.06mi |
| 923 S First St Sherman, TX | 2.0 | 1.0 | 891 | $1,125 | $1.26 | 23d | 1 | 1.08mi |
| 514 E Brockett St Unit 514 Sherman, TX | 4.0 | 4.5 | 1800 | $1,800 | $1.00 | 45d | 1 | 1.09mi |
| 304 E King St Sherman, TX | 2.0 | 1.0 | 876 | $1,250 | $1.43 | 45d | 1 | 1.19mi |
| 823 N Branch St Sherman, TX | 3.0 | 2.0 | 1357 | $1,650 | $1.22 | 23d | 1 | 1.22mi |
| 600 E Rosedale St Sherman, TX | 2.0 | 1.0 | 925 | $995 | $1.08 | 45d | 1 | 1.23mi |
| 301 E Brockett St Unit 100 Sherman, TX | 4.0 | 4.0 | 1169 | $1,400 | $1.20 | 45d | 1 | 1.26mi |
| 2001 E Alma Ave Sherman, TX | 3.0 | 2.0 | 1575 | $1,800 | $1.14 | 45d | 1 | 1.27mi |
| 620 S Walnut St Unit 622 Sherman, TX | 2.0 | 1.0 | 1783 | $1,025 | $0.57 | 45d | 1 | 1.32mi |
| 620 N Walnut St Sherman, TX | 2.0 | 1.0 | 1100 | $1,050 | $0.95 | 45d | 1 | 1.33mi |
| 609 E McGee St Unit 609 Sherman, TX | 4.0 | 2.5 | 1600 | $1,800 | $1.12 | 45d | 1 | 1.38mi |
| 815 N Travis St Sherman, TX | 3.0 | 2.0 | 1536 | $1,550 | $1.01 | 23d | 1 | 1.40mi |
Listing history 2 events
-
2026-06-21remarks 699-char remark
-
2026-06-21$165,000 Active 1 DOM
ⓘ Source: listings_history table (triggers on properties + properties_extension) + one-shot
backfill from property_details.listing_events for pre-trigger history.
Tax reassessment forecast TX · Resets to sale price
- Current annual tax
- $2,906 · $242/mo
- Projected year-2 tax
- $3,020 · $252/mo
- Expected delta
- +$113/yr (+$9/mo · 3.9%)
ⓘ Screening estimate from a state-policy table — verify with the county assessor before closing.
Climate risk First Street
- Flood 1/10 Low FEMA zone X (unshaded) · 0% chance over 30 yrs
- Wildfire 6/10 Major
- Heat 6/10 Major 7 d/yr ≥108°F today · 22 d/yr by 30 yrs out
- Wind 4/10 Moderate 22% chance of damaging wind over 30 yrs
- Air quality 3/10 Moderate 2 unhealthy d/yr today · 3 by 30 yrs out
Nearby sold comps map
Loading sold comps map…
Walkable amenities ~0.75 mi
Loading nearby amenities…
Taxation est. · year 1
- Rental income
- $18,784
- − Mortgage interest
- −$9,243
- − Property taxes
- −$2,906
- − Insurance
- −$825
- − Repairs & maintenance
- −$1,503
- − Management
- −$1,503
- − Depreciation
- −$4,800
- Taxable loss
- −$1,995
- Est. tax savings @ 24.0%
- +$479
- After-tax cash flow
- $1,204/yr
For passive investors: Depreciation is non-cash, so a rental often shows a tax loss while cash-flowing — sheltering income. Rental losses are passive: they offset passive income freely, and up to $25,000/yr can offset ordinary (W-2) income if you actively participate and your MAGI is under $100k (phasing out to $0 by $150k); unused losses carry forward. On sale, claimed depreciation is recaptured at up to 25%, and gains may owe capital-gains tax (a 1031 exchange can defer both). Figures are a year-1 estimate at your 24.0% rate — not tax advice; consult a CPA.
Schools (NCES district)
- District
- Sherman ISD
- NCES district ID
- 4840080
- Math proficiency
- 31% ▼ -9.00%
- Reading proficiency
- 37% ▼ -2.00%
- Median HH income
- $42,587
- Composite
- 28.79/100
- National rank
- #6665
- State rank
- #546 of 826 in TX
Livability — Sherman
- Score
- 61/100
- State rank
- #1027
- US rank
- #18243
Category grades
Schools grade is shown separately in the Schools card above.
Census & demographics
- Census place
- Sherman, TX
- County
- Grayson County · 108,053 people
- City population
- 54,936
- Metro
- Sherman-Denison, TX
- Population (ZIP)
- 26,594
- Household income
- $55,543
- Rent vs Own
- Severe rent burden
- 840.0
Population outlook (Grayson County) Hauer SSP2
- Today (2025)
- 134,540 people
- By 2030
- 138,653 · +3.1%
- By 2040
- 145,958 · +8.5%
- By 2050
- 151,218 · +12.4%
- By 2075
- 161,802 · +20.3%
- By 2100
- 159,036 · +18.2%
Race, ethnicity, and origin ACS 2023
- Neighborhood character
- Diverse neighborhood (Simpson 0.64)
- Race & ethnicity
- White 49% Hispanic / Latino 32% Two or more races 17% Black 11%
- Hispanic origin (detail)
- Mexican 26%
- Common ancestry
- Slovak 2% Romanian 2% Lithuanian 1%
- Foreign-born
- 15% · Canada
- Languages at home
- 73% English-only · Spanish 24% German/W. Germanic 1% Other Indo-European 1%
Political lean MEDSL · Grayson
- 2024 margin
- Solid R (+54.3) · D 22.5% · R 76.7%
- 2008→2024 swing
- -16.4pp toward R · 2008: -37.9pp · 2024: -54.3pp
- All cycles
- 2024: R+54.3 2020: R+49.9 2016: R+53.1 2012: R+48.0 2008: R+37.9
Not yet ingested
- Civics
- —
Market trends
- HPI YoY
- ▼ -69.00%
- Current HPI
- 276.5739
- Rent YoY
- ▼ -2.70%
- Metro
- Sherman-Denison, TX
- State GDP YoY
- ▲ 3.95%
- F500 in state
- 110
Industry mix (Fortune 500 HQ in TX)
| Industry | F500 HQs | Revenue |
|---|---|---|
| Energy | 16 | $1,198B |
|
||
| Technology | 5 | $198B |
|
||
| Engineering / Construction | 4 | $72B |
|
||
| Energy Services | 3 | $60B |
|
||
| Utilities | 3 | $41B |
|
||
| Healthcare | 2 | $330B |
|
||
Price history
2 events — show timeline
- 2026-06-20 Listed $165,000 NTREIS
- 1958-04-12 Sold (Public Records) — Public Records
Property tax history
+4.8%/yrLatest (2025): $2,906 · -2.0% YoY. Source: county tax records.
Cash-flow waterfall
monthlySold comps — $/sqft
last 12 mo · ≤1 miLoading sold comps…