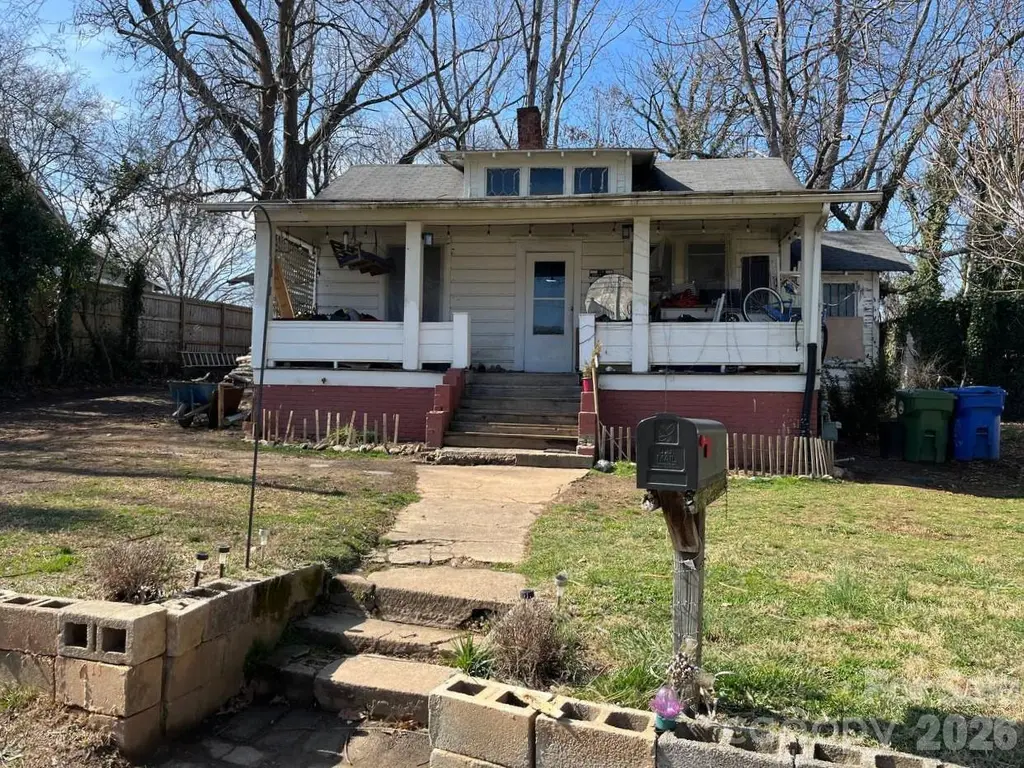
15 Oakley Pl · Asheville, NC
Flood risk 1/10 · Minimal
- FEMA flood zone
- X (unshaded)
- Chance of flooding over 30 yrs
- 0.0%
- Est. flood insurance / yr
- $507 – $1,088
Fire risk 2/10 · Minimal
- Est. fire insurance / yr
- $906 – $1,684
Heat risk 4/10 · Minor
- Hot days now (above 98°F)
- 7 days/yr
- Hot days in 30 yrs
- 19 days/yr
Wind risk 2/10 · Minimal
- Chance of severe wind over 30 yrs
- —
Air-quality risk 3/10 · Minor
- Unhealthy air days now
- 2 days/yr
- Unhealthy air days in 30 yrs
- 2 days/yr
Risk factors via First Street. Map © Google.
Why this score? — see what drove the C grade
The composite is a weighted blend of 9 inputs, each scored 0–100. Each bar is that input's sub-score; the figure is the points it added to the 100-point composite (weight × sub-score).
- Cash flow +24.4/30.0
- DSCR +7.9/10.0
- ARV discount +7.5/15.0
- 1% rule +6.1/10.0
- Schools +4.0/10.0
- Livability +3.6/5.0
- Rent growth +3.0/5.0
- Condition / age +2.5/5.0
- Appreciation +0.0/10.0
$165,000
🖨 Deal sheet 📄 Offer letter ✓ Due diligence
Listing remarks
Great property with plenty of potential and ready for your personal touch! This home is perfect for those eager to apply some TLC and creative vision to make it truly shine. Ideal for a Family looking to craft their dream space to create many lasting memories! Don’t miss this chance to transform a gem into your masterpiece!
Key facts
- 9,583 sq ft lot
- Built 1927
- Listed 7 days
Property features AI
Finance
- HOA & community: No HOA
Exterior
- Parking: Driveway
- Utilities: City water; Public sewer
- Home design: Single family residence; Site-built construction; One story; Zoned HR-4:TRAD
- Construction: Wood construction; Crawl space foundation with pillar/post/pier
- Exterior features: Covered patio/porch; Front porch; Rear porch; Gravel and paved road access; Publicly maintained road
Interior
- Kitchen: Gas cooktop; Refrigerator
- Bedrooms: Two bedrooms on the main level
- Bathrooms: One full bathroom on the main level
- Heating & cooling: Wood stove; Central air
- Interior features: Seven total rooms; Wood stove heating; Central air conditioning
- Laundry & utility: No laundry room features listed
Neighborhood map
What this means for you Summary
Snapshot
- This is a 2-bed/1.0-bath single-family listed at $165k.
Deal economics
- At list price, monthly cash flow is $337 ($4k/yr) — positive.
- The deal already cash-flows at list — no discount required.
- Meets the 1% rule at list price ($2k rent vs $165k).
- Cap rate 8.7% vs local median 2.4% in Asheville — top-decile yield for the area; either an underpriced asset or a hidden risk that comps aren't pricing in. Stress-test before assuming the spread holds.
Location & tenants
- Location reads 72/100 on livability (#96 in NC) — a middle-class / working-renter tenant base. Strengths: commute A+, health & safety A+, housing A-; Watch: crime F.
- Asheville City Schools (urban): math 39% / reading 55% proficiency, ranked #80 of 178 in NC (top 45%) — families likely to look elsewhere, expect single-tenant / working-renter base with shorter leases.
- Zoned schools: Hall Fletcher Elementary (math 27% / reading 42%, grade F, #835 of 1,410 statewide, top 62%, 307 students, 58% FRL); Asheville High (math 52% / reading 65%, grade C, #235 of 535 statewide, top 45%, 1,166 students, 33% FRL) — zoned schools at 46% FRL track the district average.
- Market conditions: Rents rising (+2.1%/yr); 334 active listings in the ZIP; 24 comparable units currently listed for rent nearby; rentals at typical pace (median 21d on market — plan ~3-4 weeks tenant-placement turnaround); 3,305 units permitted in Buncombe County in 2024 (1,855 in 5+ unit buildings).
- This rent runs 35% of the median local income ($63k/yr) — at the standard rent-burdened threshold; future hikes will face affordability resistance.
Forward outlook
- Local home prices are declining (-3.0%/yr); year-one equity from $1k of loan paydown is wiped out by about $5k of value loss. Plan a longer hold.
- Buncombe County population projected at +24% by 2050 — long-run rental-demand tailwind backs the buy-and-hold thesis.
Negotiation context
- Only 7 days on market — expect competitive offers; lowballing is unlikely to land.
Risks & watch-outs
- Watch-outs: built in 1927 — expect roof / HVAC / electrical / plumbing capex.
Questions for the listing agent
- Built in 1927 — when were the roof, HVAC, electrical panel, plumbing, and water heater last replaced?
- Is there a deadline driving the sale (1031 exchange, divorce, estate, relocation)? That informs how much negotiation room exists.
- Schools are B-rated — typically a magnet for longer-tenancy family renters. What's the average tenant stay here, and is there a school-zone premium baked into asking?
- Crime grade is F in this area — have there been break-ins, vandalism, or insurance claims at this property in the last 3 years? What carrier currently insures it and at what premium?
- What's the average days-on-market for RENTAL listings here right now (not sales)? A rising rental-DOM trend means longer vacancies and softer asking-rent achievability than the comps imply.
- What's the recent tenant-quality profile in this submarket — average credit score on applications, eviction rate, late-payment / NSF rate, and stable-employment percentage? A property-management company in the area should have these aggregated.
- How much new for-sale + rental construction is in the pipeline within 1–3 miles? Heavy new supply typically softens prices + rents 12–24 months out; constrained supply supports both.
Investment metrics
- 1% rule
- 1.11% ✓
- Cap rate
- 8.74%
- Cash-on-cash
- 8.74%
- DSCR
- 1.39
- GRM
- 7.5
CMA / ARV
- ARV (on-the-fly)
- $369,350
- Comps found
- 12
Show comp detail 12 sales within ~0.75 mi
| Address | Dist | Beds/Ba | Sqft | Sold | Price | $/sf | Match |
|---|---|---|---|---|---|---|---|
| 67 Howard St | 0.06mi | 2/2.0 | 808 (-3%) | 1mo | $382,500 | $473 | 88 |
| 122 Michigan Ave | 0.45mi | 2/1.0 | 793 (-4%) | 9mo | $345,000 | $435 | 64 |
| 43 Montana Ave | 0.36mi | 2/1.0 | 911 (+10%) | 10mo | $440,000 | $483 | 59 |
| 76 Allen St | 0.63mi | 2/1.0 | 865 (+4%) | 9mo | $385,000 | $445 | 57 |
| 54 Downing St | 0.68mi | 2/1.0 | 804 (-3%) | 9mo | $372,638 | $463 | 56 |
| 366 State St | 0.65mi | 2/1.5 | 802 (-3%) | 8mo | $310,000 | $387 | 55 |
| 364 State St | 0.67mi | 2/1.0 | 745 (-10%) | 2mo | $287,000 | $385 | 50 |
| 310 Riverview Dr | 0.46mi | 2/1.0 | 706 (-15%) | 14mo | $335,000 | $475 | 42 |
| 140 State St | 0.63mi | 2/1.0 | 724 (-13%) | 9mo | $290,000 | $401 | 42 |
| 40 Hudson St | 0.74mi | 2/2.0 | 933 (+12%) | 0mo | $415,000 | $445 | 41 |
| 396 Riverview Dr | 0.61mi | 3/1.0 (+1) | 912 (+10%) | 15mo | $385,000 | $422 | 38 |
| 166 Hanover St | 0.69mi | 3/1.0 (+1) | 919 (+11%) | 11mo | $245,000 | $267 | 36 |
Match score weights: distance 35% · size 25% · config 20% · recency 20%. Top-matched comps best support the ARV.
Projected returns pro-forma
-3.0% appreciation · 2.06% rent growth · sell at horizon
- IRR
- -4.1%
- Equity multiple
- 0.85×
- Total profit
- $-7,012
- Equity at exit
- $24,602
- IRR
- 4.5%
- Equity multiple
- 1.32×
- Total profit
- $14,614
- Equity at exit
- $14,266
Cash invested: $46,200 (down + closing). Projections, not guarantees.
Landlord ↔ Tenant lean methodology
- Overall (STATE)
- 85 Strongly Landlord-Friendly
- State North Carolina
- 85 Strongly Landlord-Friendly · R+3
- County
- — inherits STATE
- City
- — inherits STATE
ZIP-level market 28806
- Rents YoY
- 2.1%
- Active inventory
- 334
- Price-to-rent
- 7.5×
Monthly cashflow live
- Estimated rent
- $1,835 high interval (Pro) →
- Mortgage (P&I)
- −$865
- Tax from tax record
- −$179 /mo · $2,148/yr
- Insurance
- −$69
- HOA
- −$0
- Vacancy / Maint / Mgmt
- −$385
- Net cashflow
- $337
Break-even live
UW: 25.0% down · 7.5% · 30yr · 1.5% tax · 5.0% vac · 8.0% maint · 8.0% mgmt
Financing live
Cash to close
- Down payment
- $41,250
- Closing costs
- $4,950
- Reserves months
- —
- Total cash needed
- —
Loan-product check · same deal, 3 products live
Conventional
25% down · 7.5% · 30yr
- Down + closing
- —
- Monthly P&I
- —
- Monthly cashflow
- —
- DSCR
- —
- Eligible?
- —
Personal DTI + credit; lowest rate.
DSCR
20% down · 8.5% · 30yr
- Down + closing
- —
- Monthly P&I
- —
- Monthly cashflow
- —
- DSCR
- —
- Eligible?
- —
No personal income docs; deal must DSCR.
Hard money
10% down · 12.0% · 12mo
- Down + closing
- —
- Monthly P&I
- —
- Monthly cashflow
- —
- DSCR
- —
- Eligible?
- —
Short-term bridge; refi at stabilization.
Rent comps 24 comps
| Address | Beds | Baths | Sqft | Rent | $/sqft | DOM | Units | Dist |
|---|---|---|---|---|---|---|---|---|
| 50 Logan Ave Unit B Asheville, NC | 2.0 | 1.0 | 800 | $1,650 | $2.06 | 23d | 1 | 0.46mi |
| 25 Parkman Pl Asheville, NC | 2.0 | 1.0 | 1000 | $2,200 | $2.20 | 23d | 1 | 0.55mi |
| 160 State St Unit 100 Asheville, NC | 1.0 | 1.0 | 750 | $1,559 | $2.08 | 21d | 1 | 0.61mi |
| 127 Bartlett St Asheville, NC | 1.0 | 1.0 | 730 | $952 | $1.30 | 23d | 1 | 0.69mi |
| 146 Roberts St Asheville, NC | 1.0–2.0 | 1.0–2.0 | 995 | $2,578 | $2.59 | 14d | 19 | 0.70mi |
| 146 Stewart St Asheville, NC | 3.0 | 2.0 | 888 | $1,500 | $1.69 | 23d | 1 | 0.76mi |
| 21 Kentucky Dr Asheville, NC | 3.0 | 1.0 | 864 | $1,800 | $2.08 | 23d | 1 | 0.85mi |
| 25 Nevada Ave Unit 201 Asheville, NC | 2.0 | 2.0 | 960 | $1,845 | $1.92 | 14d | 1 | 0.85mi |
| 6 Townview Dr Asheville, NC | 3.0 | 2.0 | 1100 | $1,700 | $1.55 | 43d | 1 | 0.91mi |
| 8 Townview Dr Asheville, NC | 3.0 | 2.0 | 1100 | $1,700 | $1.55 | 43d | 1 | 0.92mi |
| 11 Walton St Asheville, NC | 3.0 | 2.0 | 1018 | $1,995 | $1.96 | 23d | 1 | 0.95mi |
| 275 Hazel Mill Rd Asheville, NC | 2.0 | 2.0 | 1211 | $2,037 | $1.68 | 14d | 4 | 0.98mi |
| 136 Louisiana Ave Unit 1 Asheville, NC | 2.0 | 1.0 | 1050 | $1,450 | $1.38 | 21d | 1 | 0.99mi |
| 136 Louisiana Ave #2 Asheville, NC | 1.0 | 1.0 | 950 | $1,350 | $1.42 | 21d | 1 | 0.99mi |
| 21 Brevard Rd Unit B Asheville, NC | 2.0 | 1.0 | 1000 | $1,700 | $1.70 | 23d | 1 | 1.06mi |
| 360 Hilliard Ave Asheville, NC | 1.0–2.0 | 1.0–2.0 | 844 | $1,800 | $2.13 | 21d | 10 | 1.07mi |
| 363 Hilliard Ave Asheville, NC | 2.0 | 1.0–2.0 | 809 | $2,495 | $3.08 | 14d | 14 | 1.08mi |
| 226 Hilliard Ave Asheville, NC | 2.0 | 1.0–2.0 | 862 | $3,300 | $3.83 | 14d | 92 | 1.24mi |
| 20 Lee Garden Ln Asheville, NC | 1.0–3.0 | 1.0–2.0 | 880 | $1,012 | $1.15 | 14d | 11 | 1.29mi |
| 76 Lanvale Ave Unit 2 Asheville, NC | 1.0 | 1.0 | 650 | $1,350 | $2.08 | 23d | 1 | 1.31mi |
| 3 Lee Garden Ln Asheville, NC | 2.0 | 2.5 | 1086 | $2,500 | $2.30 | 14d | 1 | 1.31mi |
| 919 Haywood Rd Asheville, NC | 1.0–2.0 | 1.0–2.0 | 1010 | $1,950 | $1.93 | 14d | 6 | 1.39mi |
| 145 Biltmore Ave #101 Asheville, NC | 1.0 | 1.0 | 556 | $2,000 | $3.60 | 23d | 1 | 1.48mi |
| 1 Page Ave Asheville, NC | 1.0–2.0 | 1.0–2.0 | 1609 | $4,200 | $2.61 | 14d | 5 | 1.49mi |
Listing history 6 events
-
2026-06-15price $165,000 Active 7 DOM
-
2026-06-15days on market $150,000 Active 7 DOM
-
2026-06-14days on market $150,000 Active 5 DOM
-
2026-06-10days on market $150,000 Active 2 DOM
-
2026-06-09remarks 325-char remark
-
2026-06-09$150,000 Active 1 DOM
ⓘ Source: listings_history table (triggers on properties + properties_extension) + one-shot
backfill from property_details.listing_events for pre-trigger history.
Tax reassessment forecast NC · Resets to sale price
- Current annual tax
- $2,148 · $179/mo
- Projected year-2 tax
- $2,148 · $179/mo
- Expected delta
- $0/yr ($0/mo · 0.0%)
ⓘ Screening estimate from a state-policy table — verify with the county assessor before closing.
Climate risk First Street
- Flood 1/10 Low FEMA zone X (unshaded) · 0% chance over 30 yrs
- Wildfire 2/10 Low
- Heat 4/10 Moderate 7 d/yr ≥98°F today · 19 d/yr by 30 yrs out
- Wind 2/10 Low
- Air quality 3/10 Moderate 2 unhealthy d/yr today · 2 by 30 yrs out
Nearby sold comps map
Loading sold comps map…
Walkable amenities ~0.75 mi
Loading nearby amenities…
Taxation est. · year 1
- Rental income
- $22,018
- − Mortgage interest
- −$9,243
- − Property taxes
- −$2,148
- − Insurance
- −$825
- − Repairs & maintenance
- −$1,761
- − Management
- −$1,761
- − Depreciation
- −$4,800
- Taxable income
- $1,480
- Est. tax owed @ 24.0%
- −$355
- After-tax cash flow
- $3,683/yr
For passive investors: Depreciation is non-cash, so a rental often shows a tax loss while cash-flowing — sheltering income. Rental losses are passive: they offset passive income freely, and up to $25,000/yr can offset ordinary (W-2) income if you actively participate and your MAGI is under $100k (phasing out to $0 by $150k); unused losses carry forward. On sale, claimed depreciation is recaptured at up to 25%, and gains may owe capital-gains tax (a 1031 exchange can defer both). Figures are a year-1 estimate at your 24.0% rate — not tax advice; consult a CPA.
Schools (NCES district)
- District
- Asheville City Schools
- NCES district ID
- 3700270
- Math proficiency
- 39% ▼ -7.00%
- Reading proficiency
- 55% ▼ -4.00%
- Median HH income
- $42,367
- Composite
- 39.51/100
- National rank
- #3948
- State rank
- #80 of 178 in NC
Livability — Asheville
- Score
- 72/100
- State rank
- #96
- US rank
- #6307
Category grades
Schools grade is shown separately in the Schools card above.
Census & demographics
- Census place
- Asheville, NC
- County
- Buncombe County · 241,085 people
- City population
- 137,611
- Metro
- Asheville, NC
- Population (ZIP)
- 43,433
- Household income
- $63,273
- Rent vs Own
- Severe rent burden
- 1783.0
Population outlook (Buncombe County) Hauer SSP2
- Today (2025)
- 286,475 people
- By 2030
- 302,237 · +5.5%
- By 2040
- 330,687 · +15.4%
- By 2050
- 356,370 · +24.4%
- By 2075
- 409,383 · +42.9%
- By 2100
- 437,270 · +52.6%
Race, ethnicity, and origin ACS 2023
- Neighborhood character
- Predominantly White (77%)
- Race & ethnicity
- White 77% Hispanic / Latino 11% Two or more races 9% Black 6% Asian 2%
- Hispanic origin (detail)
- Mexican 6%
- Common ancestry
- Serbian 3% Slovak 3% Italian 3%
- Foreign-born
- 10% · Canada, China
- Languages at home
- 86% English-only · Spanish 9% Russian/Polish/Slavic 3% Other Indo-European 2%
Political lean MEDSL · Buncombe
- 2024 margin
- Strong D (+24.8) · D 61.7% · R 36.9% · Other 1.4%
- 2008→2024 swing
- +10.9pp toward D · 2008: 13.9pp · 2024: 24.8pp
- All cycles
- 2024: D+24.8 2020: D+21.1 2016: D+14.6 2012: D+12.4 2008: D+13.9
Not yet ingested
- Civics
- —
Market trends
- HPI YoY
- ▼ -271.16%
- Current HPI
- 350.3071
- Rent YoY
- ▲ 2.06%
- Metro
- Asheville, NC
- State GDP YoY
- ▲ 3.28%
- F500 in state
- 26
Industry mix (Fortune 500 HQ in NC)
| Industry | F500 HQs | Revenue |
|---|---|---|
| Financial Services | 2 | $213B |
|
||
| Retail | 2 | $95B |
|
||
| Industrial Conglomerate | 1 | $38B |
|
||
| Metals / Steel | 1 | $35B |
|
||
| Utilities | 1 | $30B |
|
||
| Industrial Machinery | 1 | $19B |
|
||
Price history
-40.0% since first listed4 events — show timeline
- 2026-06-08 Listed $150,000 CANOPYMLS as Distributed by MLS Grid
- 2020-01-03 Price Changed $220,000 CANOPYMLS as Distributed by MLS Grid
- 2020-01-03 Price Changed $219,999 CANOPYMLS as Distributed by MLS Grid
- 2019-09-18 Price Changed $249,999 CANOPYMLS as Distributed by MLS Grid
Property tax history
+5.7%/yrLatest (2025): $2,148 · +6.3% YoY. Source: county tax records.
Cash-flow waterfall
monthlySold comps — $/sqft
last 12 mo · ≤1 miLoading sold comps…