202 Northwood Bch · Ovid, MI
Flood risk 1/10 · Minimal
- FEMA flood zone
- X (unshaded)
- Chance of flooding over 30 yrs
- 0.0%
- Est. flood insurance / yr
- $473 – $860
Fire risk 1/10 · Minimal
- Est. fire insurance / yr
- $784 – $1,456
Heat risk 3/10 · Minor
- Hot days now (above 98°F)
- 7 days/yr
- Hot days in 30 yrs
- 16 days/yr
Wind risk 2/10 · Minimal
- Chance of severe wind over 30 yrs
- —
Air-quality risk 2/10 · Minimal
- Unhealthy air days now
- 1 days/yr
- Unhealthy air days in 30 yrs
- 2 days/yr
Risk factors via First Street. Map © Google.
Why this score? — see what drove the C+ grade
The composite is a weighted blend of 9 inputs, each scored 0–100. Each bar is that input's sub-score; the figure is the points it added to the 100-point composite (weight × sub-score).
- Cash flow +23.1/30.0
- ARV discount +15.0/15.0
- DSCR +7.4/10.0
- 1% rule +5.8/10.0
- Livability +3.8/5.0
- Schools +2.7/10.0
- Rent growth +2.5/5.0
- Condition / age +2.5/5.0
- Appreciation +0.0/10.0
$129,900
🖨 Deal sheet 📄 Offer letter ✓ Due diligence
Listing remarks MLS
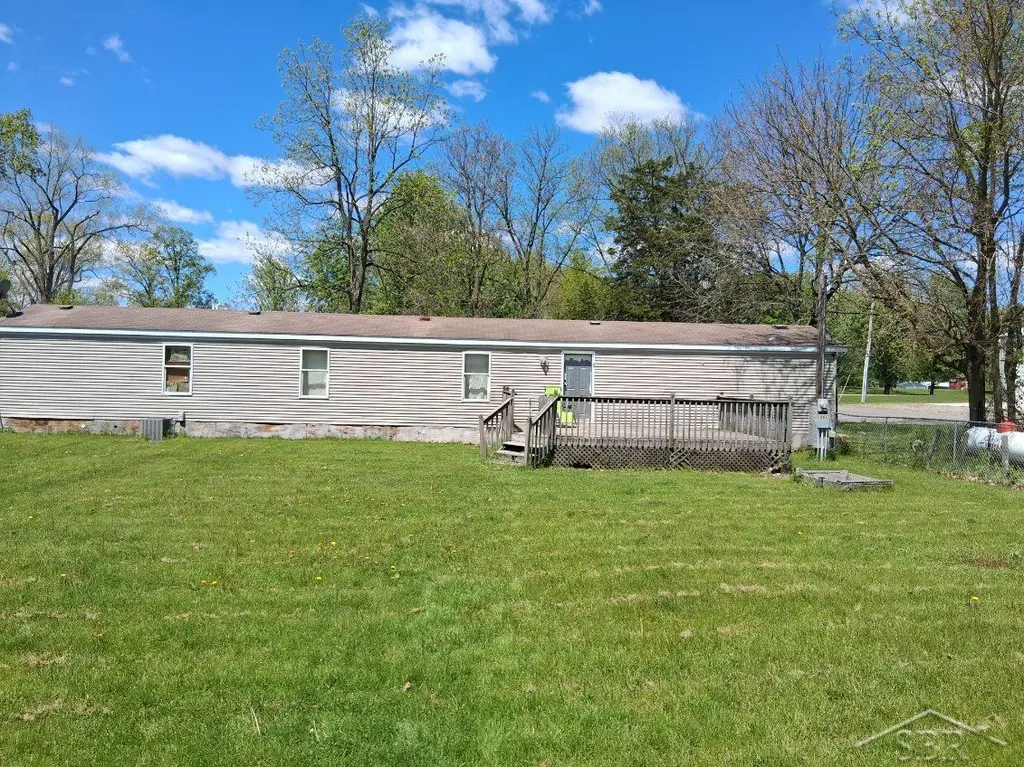
Enjoy country living just south of Coldwater with this 3 bedroom, 2 bath home situated on a spacious half-acre lot. The open-concept floor plan offers a welcoming living room, a kitchen with a convenient snack bar, and a dining area perfect for everyday living and entertaining. Outside, you'll find a fenced backyard with plenty of room to relax, play, or garden. A standout feature of the property is the impressive 30x40 post and beam barn, complete with two garage doors and a full loft area, with wood flooring, providing exceptional space for storage, hobbies, a workshop, or recreational equipment. This company makes no warranty or representations about the contents of this data. It is the responsibility of the parties looking at the property to satisfy themselves as to accuracy of this information. Taxes were obtained from the local assessor and the taxes could change for the buyer after a closed transaction.
Key facts
- Full loft area
- Fenced backyard
- 0.53 acre lot
Tags
Property features AI
Exterior
- Utilities: Well water
- Home design: Residential property; Other architectural style
- Construction: Built in 2000; Vinyl siding; Composition roof
- Exterior features: Corner lot
Interior
- Kitchen: Eat-in kitchen (15 x 15)
- Bedrooms: Primary bedroom (15 x 12); Bedroom 2 (11 x 11); Bedroom 3 (10 x 9)
- Bathrooms: 2 full bathrooms; Primary bathroom (16 x 8)
- Heating & cooling: Forced air heating
- Interior features: Eat-in kitchen; 8 total rooms
- Laundry & utility: Laundry room (3 x 4); Basement: Other
Neighborhood map
What this means for you Summary
Snapshot
- This is a 3-bed/2.0-bath single-family listed at $130k.
Deal economics
- At list price, monthly cash flow is $232 ($3k/yr) — positive.
- The deal already cash-flows at list — no discount required.
- Meets the 1% rule at list price ($1k rent vs $130k).
- Cap rate 8.4% vs local median 2.4% in Ovid — top-decile yield for the area; either an underpriced asset or a hidden risk that comps aren't pricing in. Stress-test before assuming the spread holds.
Location & tenants
- Location reads 75/100 on livability (#162 in MI, #4,215 nationally) — a middle-class / working-renter tenant base. Strengths: cost of living A+, health & safety A+, crime A; Watch: employment C-, amenities F, commute F.
- Coldwater Community Schools (town): math 26% / reading 37% proficiency, ranked #344 of 540 in MI (top 64%) — families likely to look elsewhere, expect single-tenant / working-renter base with shorter leases.
- Market conditions: 140 active listings in the ZIP; 43 units permitted in Branch County in 2024 (0 in 5+ unit buildings).
Forward outlook
- Local home prices are declining (-3.0%/yr); year-one equity from $898 of loan paydown is wiped out by about $4k of value loss. Plan a longer hold.
- Branch County population projected at -18% by 2050 — secular population decline; favor cash flow + early exit over multi-decade hold.
Negotiation context
- Only 8 days on market — expect competitive offers; lowballing is unlikely to land.
- 12 sale attempts since 22y ago; this cycle's ask has dropped $10k (7%) from the opening price — seller is motivated, your offer sets the floor, not the list.
- Current owner paid $75k; list at $130k implies a 73% gain — meaningful room to come down on a strong offer.
Questions for the listing agent
- Is there a deadline driving the sale (1031 exchange, divorce, estate, relocation)? That informs how much negotiation room exists.
- What's the average days-on-market for RENTAL listings here right now (not sales)? A rising rental-DOM trend means longer vacancies and softer asking-rent achievability than the comps imply.
- What's the recent tenant-quality profile in this submarket — average credit score on applications, eviction rate, late-payment / NSF rate, and stable-employment percentage? A property-management company in the area should have these aggregated.
- How much new for-sale + rental construction is in the pipeline within 1–3 miles? Heavy new supply typically softens prices + rents 12–24 months out; constrained supply supports both.
Investment metrics
- 1% rule
- 1.08% ✓
- Cap rate
- 8.44%
- Cash-on-cash
- 7.66%
- DSCR
- 1.34
- GRM
- 7.7
CMA / ARV
- ARV (median comp)
- $187,499
- List price
- $129,900
- Delta
- -36.53%
- Verdict
- UNDERPRICED
- Comps
- 5 within 1.0 mi
Projected returns pro-forma
-3.0% appreciation · 3.0% rent growth · sell at horizon
- IRR
- -4.6%
- Equity multiple
- 0.83×
- Total profit
- $-6,261
- Equity at exit
- $19,369
- IRR
- 5.1%
- Equity multiple
- 1.37×
- Total profit
- $13,622
- Equity at exit
- $11,231
Cash invested: $36,372 (down + closing). Projections, not guarantees.
Landlord ↔ Tenant lean methodology
- Overall (STATE)
- 62 Landlord-Friendly
- State Michigan
- 62 Landlord-Friendly · EVEN
- County
- — inherits STATE
- City
- — inherits STATE
ZIP-level market 49036
- Active inventory
- 140
- Price-to-rent
- 7.7×
Monthly cashflow live
- Estimated rent
- $1,409 medium interval (Pro) →
- Mortgage (P&I)
- −$681
- Tax from tax record
- −$146 /mo · $1,748/yr
- Insurance
- −$54
- HOA
- −$0
- Vacancy / Maint / Mgmt
- −$296
- Net cashflow
- $232
Break-even live
UW: 25.0% down · 7.5% · 30yr · 1.5% tax · 5.0% vac · 8.0% maint · 8.0% mgmt
Financing live
Cash to close
- Down payment
- $32,475
- Closing costs
- $3,897
- Reserves months
- —
- Total cash needed
- —
Loan-product check · same deal, 3 products live
Conventional
25% down · 7.5% · 30yr
- Down + closing
- —
- Monthly P&I
- —
- Monthly cashflow
- —
- DSCR
- —
- Eligible?
- —
Personal DTI + credit; lowest rate.
DSCR
20% down · 8.5% · 30yr
- Down + closing
- —
- Monthly P&I
- —
- Monthly cashflow
- —
- DSCR
- —
- Eligible?
- —
No personal income docs; deal must DSCR.
Hard money
10% down · 12.0% · 12mo
- Down + closing
- —
- Monthly P&I
- —
- Monthly cashflow
- —
- DSCR
- —
- Eligible?
- —
Short-term bridge; refi at stabilization.
Listing history 24 events
-
2026-06-18price $129,900 Active 8 DOM
-
2026-06-18days on market $139,900 Active 8 DOM
-
2026-06-17days on market $139,900 Active 7 DOM
-
2026-06-16days on market $139,900 Active 6 DOM
-
2026-06-15days on market $139,900 Active 5 DOM
-
2026-06-13days on market $139,900 Active 3 DOM
-
2026-06-12remarks 699-char remark
-
2026-06-12pricestatusdays on market $139,900 Active 2 DOM
-
2026-05-14$119,000 Active 191-char remark
-
2026-05-14$119,000 Active 191-char remark
-
2021-04-19soldstatus $75,000
-
2014-09-25historical
-
2014-09-16historical
-
2013-08-05$69,900
-
2013-08-05$69,900
-
2005-09-16soldstatus $83,100
-
2005-09-16soldstatus $83,100
-
2005-09-16soldstatus $83,100
-
2005-09-16soldstatus $83,100
-
2005-04-02$79,900
-
2005-04-02$79,900
-
2005-04-02$79,900
-
2004-04-21$78,500
-
2004-04-21$78,500
ⓘ Source: listings_history table (triggers on properties + properties_extension) + one-shot
backfill from property_details.listing_events for pre-trigger history.
Tax reassessment forecast MI · Partial reset (capped growth)
- Current annual tax
- $1,748 · $146/mo
- Projected year-2 tax
- $1,874 · $156/mo
- Expected delta
- +$126/yr (+$11/mo · 7.2%)
ⓘ Screening estimate from a state-policy table — verify with the county assessor before closing.
Climate risk First Street
- Flood 1/10 Low FEMA zone X (unshaded) · 0% chance over 30 yrs
- Wildfire 1/10 Low
- Heat 3/10 Moderate 7 d/yr ≥98°F today · 16 d/yr by 30 yrs out
- Wind 2/10 Low
- Air quality 2/10 Low 1 unhealthy d/yr today · 2 by 30 yrs out
Nearby sold comps map
Loading sold comps map…
Walkable amenities ~0.75 mi
Loading nearby amenities…
Taxation est. · year 1
- Rental income
- $16,907
- − Mortgage interest
- −$7,276
- − Property taxes
- −$1,748
- − Insurance
- −$650
- − Repairs & maintenance
- −$1,353
- − Management
- −$1,353
- − Depreciation
- −$3,779
- Taxable income
- $749
- Est. tax owed @ 24.0%
- −$180
- After-tax cash flow
- $2,605/yr
For passive investors: Depreciation is non-cash, so a rental often shows a tax loss while cash-flowing — sheltering income. Rental losses are passive: they offset passive income freely, and up to $25,000/yr can offset ordinary (W-2) income if you actively participate and your MAGI is under $100k (phasing out to $0 by $150k); unused losses carry forward. On sale, claimed depreciation is recaptured at up to 25%, and gains may owe capital-gains tax (a 1031 exchange can defer both). Figures are a year-1 estimate at your 24.0% rate — not tax advice; consult a CPA.
Schools (NCES district)
- District
- Coldwater Community Schools
- NCES district ID
- 2610140
- Math proficiency
- 26% ▼ -12.00%
- Reading proficiency
- 37% ▼ -5.00%
- Median HH income
- $44,373
- Composite
- 26.87/100
- National rank
- #7101
- State rank
- #344 of 540 in MI
Livability — Ovid
- Score
- 75/100
- State rank
- #162
- US rank
- #4215
Category grades
Schools grade is shown separately in the Schools card above.
Census & demographics
- Population (ZIP)
- 24,697
Population outlook (Branch County) Hauer SSP2
- Today (2025)
- 41,079 people
- By 2030
- 39,622 · -3.5%
- By 2040
- 36,584 · -10.9%
- By 2050
- 33,462 · -18.5%
- By 2075
- 26,612 · -35.2%
- By 2100
- 18,580 · -54.8%
Race, ethnicity, and origin ACS 2023
- Neighborhood character
- Predominantly White (86%)
- Race & ethnicity
- White 86% Hispanic / Latino 7% Two or more races 5% Black 3%
- Hispanic origin (detail)
- Mexican 4%
- Common ancestry
- Romanian 5% Iranian 3% Lithuanian 2%
- Foreign-born
- 8% · Canada
- Languages at home
- 86% English-only · Arabic 7% Spanish 5% German/W. Germanic 1%
Political lean MEDSL · Branch
- 2024 margin
- Solid R (+42.4) · D 28.0% · R 70.4% · Other 1.6%
- 2008→2024 swing
- -36.2pp toward R · 2008: -6.1pp · 2024: -42.4pp
- All cycles
- 2024: R+42.4 2020: R+38.5 2016: R+38.1 2012: R+18.7 2008: R+6.1
Not yet ingested
- Civics
- —
Market trends
- HPI YoY
- ▼ -214.60%
- Current HPI
- 192.653
- Rent YoY
- —
- Metro
- —
- State GDP YoY
- ▲ 1.37%
- F500 in state
- 28
Industry mix (Fortune 500 HQ in MI)
| Industry | F500 HQs | Revenue |
|---|---|---|
| Automotive Parts | 3 | $48B |
|
||
| Automotive | 2 | $372B |
|
||
| Chemicals | 1 | $45B |
|
||
| Automotive Retail | 1 | $29B |
|
||
| Healthcare / Medical Devices | 1 | $23B |
|
||
| Automotive Technology | 1 | $20B |
|
||
Price history
+78.2% since first listed20 events — show timeline
- 2026-06-10 Listed $139,900 REALCOMP
- 2026-06-10 Listed $139,900 SW Michigan MLS
- 2026-06-10 Listed $139,900 MiRealSource-MiMLS
- 2026-05-19 Listing Removed — MiRealSource-MiMLS
- 2026-05-14 Listed $119,000 MiRealSource-MiMLS
- 2026-05-14 Listed $119,000 REALCOMP
- 2021-04-19 Sold (Public Records) $75,000 Public Records
- 2014-09-25 Listing Removed — SW Michigan MLS
- 2014-09-16 Listing Removed — SW Michigan MLS
- 2013-08-05 Listed $69,900 REALCOMP
- 2013-08-05 Listed $69,900 SW Michigan MLS
- 2005-09-16 Sold (Public Records) $83,100 Public Records
- 2005-09-16 Sold (MLS) $83,100 MiRealSource-MiMLS
- 2005-09-16 Sold (MLS) $83,100 REALCOMP
- 2005-09-16 Sold (MLS) $83,100 SW Michigan MLS
- 2005-04-02 Listed $79,900 MiRealSource-MiMLS
- 2005-04-02 Listed $79,900 REALCOMP
- 2005-04-02 Listed $79,900 SW Michigan MLS
- 2004-04-21 Listed $78,500 REALCOMP
- 2004-04-21 Listed $78,500 SW Michigan MLS
Property tax history
+4.5%/yrLatest (2024): $1,748 · +9.2% YoY. Source: county tax records.
Cash-flow waterfall
monthlySold comps — $/sqft
last 12 mo · ≤1 miLoading sold comps…