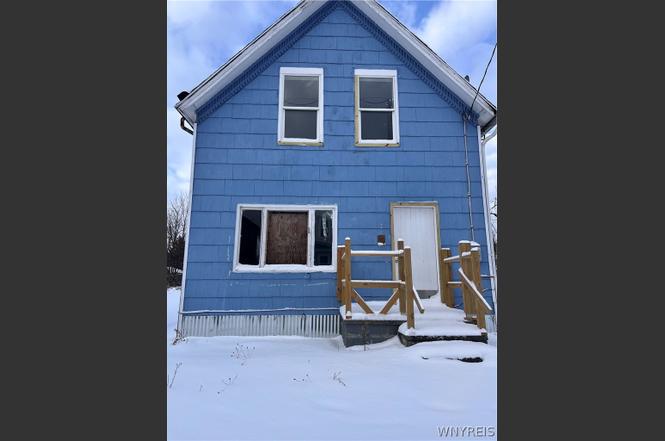
120 Gatchell St · Buffalo, NY
Flood risk 6/10 · Moderate
- FEMA flood zone
- X (unshaded)
- Chance of flooding over 30 yrs
- 0.68%
- Est. flood insurance / yr
- $473 – $860
Fire risk 1/10 · Minimal
- Est. fire insurance / yr
- $691 – $1,283
Heat risk 3/10 · Minor
- Hot days now (above 93°F)
- 7 days/yr
- Hot days in 30 yrs
- 15 days/yr
Wind risk 1/10 · Minimal
- Chance of severe wind over 30 yrs
- —
Air-quality risk 3/10 · Minor
- Unhealthy air days now
- 2 days/yr
- Unhealthy air days in 30 yrs
- 3 days/yr
Risk factors via First Street. Map © Google.
Why this score? — see what drove the B+ grade
The composite is a weighted blend of 9 inputs, each scored 0–100. Each bar is that input's sub-score; the figure is the points it added to the 100-point composite (weight × sub-score).
- Cash flow +30.0/30.0
- 1% rule +10.0/10.0
- DSCR +10.0/10.0
- Appreciation +10.0/10.0
- ARV discount +7.5/15.0
- Livability +3.9/5.0
- Schools +3.3/10.0
- Rent growth +2.5/5.0
- Condition / age +2.5/5.0
$50,000
🖨 Deal sheet 📄 Offer letter ✓ Due diligence
Listing remarks
HANDYMAN SPECIAL! BRING YOUR TOOLKIT WITH YOU. RENOVATION STARTED. UTILITIES ARE OFF BRING A FLASHLIGHT IF COMING AFTER 4. NEEDS SOME PLUMBING, FLOORING, HWT, FURNACE, PAINTING, DRYWALL, YOUR STYLE OF CABINETS, AND VANITIES. HOUSE HAS GREAT POTENTIAL. CASH OR REHAB LOAN PREFERRED. DELAYED SHOWINGS START ON FRIDAY, FEBRUARY 13, 2026, AND DELAYED NEGOTIATIONS START ON FEBRUARY 20, 2026 @ 7PM. PROPERTY WILL BE SOLD IN ITS AS-IS CONDITION, 40-YEAR SEARCH PROVIDED, NO SURVEY. SEWER RENT 72.84. SELLER IS A REAL ESTATE AGENT
Key facts
- 3,300 sq ft lot
- Built 1900
- Listed 57 days
Neighborhood map
What this means for you Summary
Snapshot
- This is a 4-bed/1.0-bath single-family listed at $50k.
Deal economics
- At list price, monthly cash flow is $615 ($7k/yr) — positive.
- The deal already cash-flows at list — no discount required.
- Meets the 1% rule at list price ($1k rent vs $50k).
- Recommended offer: $48k (3.0% below list) — sets the bar for market timing.
- Cap rate 21.1% vs local median 8.0% in Buffalo — top-decile yield for the area; either an underpriced asset or a hidden risk that comps aren't pricing in. Stress-test before assuming the spread holds.
Location & tenants
- Location reads 77/100 on livability (#195 in NY, #3,011 nationally) — a middle-class / working-renter tenant base. Strengths: commute A+, housing A+, health & safety A+; Watch: crime F, employment D-.
- Buffalo City School District (urban): math 41% / reading 40% proficiency, ranked #535 of 590 in NY (top 91%) — families likely to look elsewhere, expect single-tenant / working-renter base with shorter leases; 75% free/reduced lunch — lower-income household profile, screen leases tightly.
- Market conditions: 83 active listings in the ZIP; 9 comparable units currently listed for rent nearby; rentals at typical pace (median 24d on market — plan ~3-4 weeks tenant-placement turnaround); 44% of comp listings sitting > 30 days — soft ceiling on asking rent; 1,244 units permitted in Erie County in 2024 (563 in 5+ unit buildings).
Forward outlook
- In year one you build about $5k of equity ($346 loan paydown + $5k appreciation (10.0% local appreciation)).
- At projected returns (10.0% appreciation + 3.0% rent growth), your $14k cash investment doubles in ~2 years — after that, you're playing with house money.
- By year 6, paydown + projected appreciation supports a ~$31k cash-out refi (75% LTV) — recoverable capital for the next deal without selling this one.
Negotiation context
- It's been on market 57 days — a 3% lower offer ($48k) is reasonable based on typical stale-listing flexibility.
- 4 sale attempts since 13y ago; this cycle's ask has dropped $12k (19%) from the opening price — seller is motivated, your offer sets the floor, not the list.
Risks & watch-outs
- Watch-outs: built in 1900 — expect roof / HVAC / electrical / plumbing capex.
- Climate carrying-cost: major flood risk — expect insurance premiums to compound above CPI over the hold.
Questions for the listing agent
- It's been on market 57 days. Have you received any prior offers? Is the seller open to a 3% concession, seller financing, or rate buy-down credit?
- Built in 1900 — when were the roof, HVAC, electrical panel, plumbing, and water heater last replaced?
- Is there a deadline driving the sale (1031 exchange, divorce, estate, relocation)? That informs how much negotiation room exists.
- Crime grade is F in this area — have there been break-ins, vandalism, or insurance claims at this property in the last 3 years? What carrier currently insures it and at what premium?
- What's the average days-on-market for RENTAL listings here right now (not sales)? A rising rental-DOM trend means longer vacancies and softer asking-rent achievability than the comps imply.
- What's the recent tenant-quality profile in this submarket — average credit score on applications, eviction rate, late-payment / NSF rate, and stable-employment percentage? A property-management company in the area should have these aggregated.
- How much new for-sale + rental construction is in the pipeline within 1–3 miles? Heavy new supply typically softens prices + rents 12–24 months out; constrained supply supports both.
Investment metrics
- 1% rule
- 2.43% ✓
- Cap rate
- 21.06%
- Cash-on-cash
- 52.73%
- DSCR
- 3.35
- GRM
- 3.4
CMA / ARV
- ARV (on-the-fly)
- $120,512
- Comps found
- 12
Show comp detail 12 sales within ~0.75 mi
| Address | Dist | Beds/Ba | Sqft | Sold | Price | $/sf | Match |
|---|---|---|---|---|---|---|---|
| 131 Hirschbeck St | 0.08mi | 3/1.0 (-1) | 993 (-8%) | 9mo | $111,550 | $112 | 71 |
| 90 May St | 0.21mi | 4/1.0 | 1,094 (+2%) | 20mo | $50,000 | $46 | 71 |
| 391 Greene St | 0.44mi | 3/1.0 (-1) | 1,144 (+6%) | 2mo | $200,000 | $175 | 62 |
| 324 Ideal St | 0.60mi | 4/2.0 | 1,092 (+2%) | 6mo | $195,000 | $179 | 61 |
| 379 N Ogden St Unit E | 0.74mi | 3/1.0 (-1) | 1,083 (+1%) | 3mo | $160,000 | $148 | 57 |
| 86 Moreland St | 0.70mi | 4/1.0 | 1,069 (-1%) | 12mo | $82,000 | $77 | 56 |
| 74 Vanderbilt St | 0.68mi | 3/1.0 (-1) | 1,136 (+6%) | 3mo | $105,000 | $92 | 52 |
| 44 Goembel Ave | 0.39mi | 3/2.0 (-1) | 980 (-9%) | 9mo | $175,000 | $179 | 50 |
| 105 Regent St | 0.68mi | 3/2.0 (-1) | 1,138 (+6%) | 6mo | $110,000 | $97 | 45 |
| 75 Wood Ave | 0.39mi | 4/2.0 | 1,228 (+14%) | 12mo | $105,000 | $86 | 44 |
| 438 Davey St | 0.63mi | 3/1.0 (-1) | 1,134 (+5%) | 20mo | $70,000 | $62 | 40 |
| 333 Ideal St | 0.60mi | 4/1.0 | 1,226 (+14%) | 15mo | $183,000 | $149 | 36 |
Match score weights: distance 35% · size 25% · config 20% · recency 20%. Top-matched comps best support the ARV.
Projected returns pro-forma
10.0% appreciation · 3.0% rent growth · sell at horizon
- IRR
- 65.9%
- Equity multiple
- 5.75×
- Total profit
- $66,430
- Equity at exit
- $45,044
- IRR
- 59.5%
- Equity multiple
- 12.78×
- Total profit
- $164,851
- Equity at exit
- $97,139
Cash invested: $14,000 (down + closing). Projections, not guarantees.
Landlord ↔ Tenant lean methodology
- Overall (STATE)
- 15 Strongly Tenant-Friendly
- State New York
- 15 Strongly Tenant-Friendly · D+10
- County
- — inherits STATE
- City
- — inherits STATE
ZIP-level market 14212
- Home prices YoY
- 20.4%
- Active inventory
- 83
- Price-to-rent
- 3.4×
Monthly cashflow live
- Estimated rent
- $1,216 high interval (Pro) →
- Mortgage (P&I)
- −$262
- Tax est. 1.5%
- −$62 /mo · $750/yr
- Insurance
- −$21
- HOA
- −$0
- Vacancy / Maint / Mgmt
- −$255
- Net cashflow
- $615
Break-even live
UW: 25.0% down · 7.5% · 30yr · 1.5% tax · 5.0% vac · 8.0% maint · 8.0% mgmt
Financing live
Cash to close
- Down payment
- $12,500
- Closing costs
- $1,500
- Reserves months
- —
- Total cash needed
- —
Loan-product check · same deal, 3 products live
Conventional
25% down · 7.5% · 30yr
- Down + closing
- —
- Monthly P&I
- —
- Monthly cashflow
- —
- DSCR
- —
- Eligible?
- —
Personal DTI + credit; lowest rate.
DSCR
20% down · 8.5% · 30yr
- Down + closing
- —
- Monthly P&I
- —
- Monthly cashflow
- —
- DSCR
- —
- Eligible?
- —
No personal income docs; deal must DSCR.
Hard money
10% down · 12.0% · 12mo
- Down + closing
- —
- Monthly P&I
- —
- Monthly cashflow
- —
- DSCR
- —
- Eligible?
- —
Short-term bridge; refi at stabilization.
Rent comps 9 comps
| Address | Beds | Baths | Sqft | Rent | $/sqft | DOM | Units | Dist |
|---|---|---|---|---|---|---|---|---|
| 1777 Broadway Unit 2 Buffalo, NY | 3.0 | 1.0 | 1300 | $1,200 | $0.92 | 43d | 1 | 0.35mi |
| 67 Moeller St Unit UPPER Buffalo, NY | 3.0 | 1.0 | 960 | $1,000 | $1.04 | 3d | 1 | 0.74mi |
| 67 Moeller St Unit LOWER Buffalo, NY | 3.0 | 1.0 | 960 | $1,200 | $1.25 | 23d | 1 | 0.74mi |
| 1150 Bailey Ave Buffalo, NY | 4.0 | 1.5 | 1100 | $1,200 | $1.09 | 23d | 1 | 0.99mi |
| 24 Euclid Ave Buffalo, NY | 3.0 | 2.0 | 1150 | $1,700 | $1.48 | 43d | 1 | 1.03mi |
| 85 Blake St Unit 1 Buffalo, NY | 4.0 | 2.0 | 1022 | $1,000 | $0.98 | 43d | 1 | 1.14mi |
| 1202 Walden Ave Unit 2 Buffalo, NY | 3.0 | 1.0 | 800 | $1,350 | $1.69 | 43d | 1 | 1.30mi |
| 1202 Walden Ave Unit 3 Buffalo, NY | 3.0 | 1.0 | 1500 | $1,400 | $0.93 | 17d | 1 | 1.30mi |
| 408 Winslow Ave Unit 2 Buffalo, NY | 3.0 | 1.0 | 1000 | $1,050 | $1.05 | 14d | 1 | 1.47mi |
Listing history 12 events
-
2026-04-09status Pending
-
2026-03-20price $50,000
-
2026-02-11$62,000 Active
-
2018-10-09historical
-
2018-07-09$30,000 Active
-
2018-05-30historical
-
2017-12-14price $32,900
-
2017-07-17$37,900 Active
-
2014-07-09soldstatus $56,725
-
2013-10-15soldstatus $9,000
-
2013-05-14$15,000
-
2004-04-14soldstatus $48,000
ⓘ Source: listings_history table (triggers on properties + properties_extension) + one-shot
backfill from property_details.listing_events for pre-trigger history.
Climate risk First Street
- Flood 6/10 Major FEMA zone X (unshaded) · 68% chance over 30 yrs
- Wildfire 1/10 Low
- Heat 3/10 Moderate 7 d/yr ≥93°F today · 15 d/yr by 30 yrs out
- Wind 1/10 Low
- Air quality 3/10 Moderate 2 unhealthy d/yr today · 3 by 30 yrs out
Nearby sold comps map
Loading sold comps map…
Walkable amenities ~0.75 mi
Loading nearby amenities…
Taxation est. · year 1
- Rental income
- $14,593
- − Mortgage interest
- −$2,801
- − Property taxes
- −$750
- − Insurance
- −$250
- − Repairs & maintenance
- −$1,167
- − Management
- −$1,167
- − Depreciation
- −$1,455
- Taxable income
- $7,003
- Est. tax owed @ 24.0%
- −$1,681
- After-tax cash flow
- $5,701/yr
For passive investors: Depreciation is non-cash, so a rental often shows a tax loss while cash-flowing — sheltering income. Rental losses are passive: they offset passive income freely, and up to $25,000/yr can offset ordinary (W-2) income if you actively participate and your MAGI is under $100k (phasing out to $0 by $150k); unused losses carry forward. On sale, claimed depreciation is recaptured at up to 25%, and gains may owe capital-gains tax (a 1031 exchange can defer both). Figures are a year-1 estimate at your 24.0% rate — not tax advice; consult a CPA.
Schools (NCES district)
- District
- Buffalo City School District
- NCES district ID
- 3605850
- Math proficiency
- 41% ▲ 11.00%
- Reading proficiency
- 40% ▲ 7.00%
- Median HH income
- $31,665
- Composite
- 33.17/100
- National rank
- #5544
- State rank
- #535 of 590 in NY
Livability — Buffalo
- Score
- 77/100
- State rank
- #195
- US rank
- #3011
Category grades
Schools grade is shown separately in the Schools card above.
Census & demographics
- Census place
- Buffalo, NY
- City population
- 440,021
- Population (ZIP)
- 13,603
Population outlook (Erie County) Hauer SSP2
- Today (2025)
- 933,037 people
- By 2030
- 935,181 · +0.2%
- By 2040
- 928,531 · -0.5%
- By 2050
- 905,725 · -2.9%
- By 2075
- 834,037 · -10.6%
- By 2100
- 708,033 · -24.1%
Race, ethnicity, and origin ACS 2023
- Neighborhood character
- Highly diverse neighborhood (Simpson 0.75)
- Race & ethnicity
- White 32% Black 27% Asian 25% Hispanic / Latino 9% Two or more races 8%
- Hispanic origin (detail)
- Puerto Rican 8%
- Common ancestry
- Romanian 12% Serbian 1% Lithuanian 1%
- Foreign-born
- 20% · Philippines, Canada, China
- Languages at home
- 68% English-only · Other Indo-European 18% Spanish 4% Other Asian/Pacific 2%
Political lean MEDSL · Erie
- 2024 margin
- Lean D (+9.7) · D 54.8% · R 45.2%
- 2008→2024 swing
- -7.9pp toward R · 2008: 17.5pp · 2024: 9.7pp
- All cycles
- 2024: D+9.7 2020: D+14.7 2016: D+4.8 2012: D+15.6 2008: D+17.5
Not yet ingested
- Civics
- —
Market trends
- HPI YoY
- ▲ 79.80%
- Current HPI
- 471.6399
- Rent YoY
- —
- Metro
- —
- State GDP YoY
- ▲ 2.60%
- F500 in state
- 92
Industry mix (Fortune 500 HQ in NY)
| Industry | F500 HQs | Revenue |
|---|---|---|
| Financial Services | 10 | $950B |
|
||
| Consumer Goods | 9 | $162B |
|
||
| Insurance | 4 | $225B |
|
||
| Telecommunications | 2 | $144B |
|
||
| Pharmaceuticals | 2 | $112B |
|
||
| Media / Entertainment | 2 | $69B |
|
||
Price history
+4.2% since first listed12 events — show timeline
- 2026-04-09 Pending — WNYREIS
- 2026-03-20 Price Changed $50,000 WNYREIS
- 2026-02-11 Listed $62,000 WNYREIS
- 2018-10-09 Listing Removed — WNYREIS
- 2018-07-09 Listed $30,000 WNYREIS
- 2018-05-30 Listing Removed — WNYREIS
- 2017-12-14 Price Changed $32,900 WNYREIS
- 2017-07-17 Listed $37,900 WNYREIS
- 2014-07-09 Sold (Public Records) $56,725 Public Records
- 2013-10-15 Sold (MLS) $9,000 WNYREIS
- 2013-05-14 Listed $15,000 WNYREIS
- 2004-04-14 Sold (Public Records) $48,000 Public Records
Property tax history
-5.0%/yrLatest (2025): $62 · +0.0% YoY. Source: county tax records.
Cash-flow waterfall
monthlySold comps — $/sqft
last 12 mo · ≤1 miLoading sold comps…