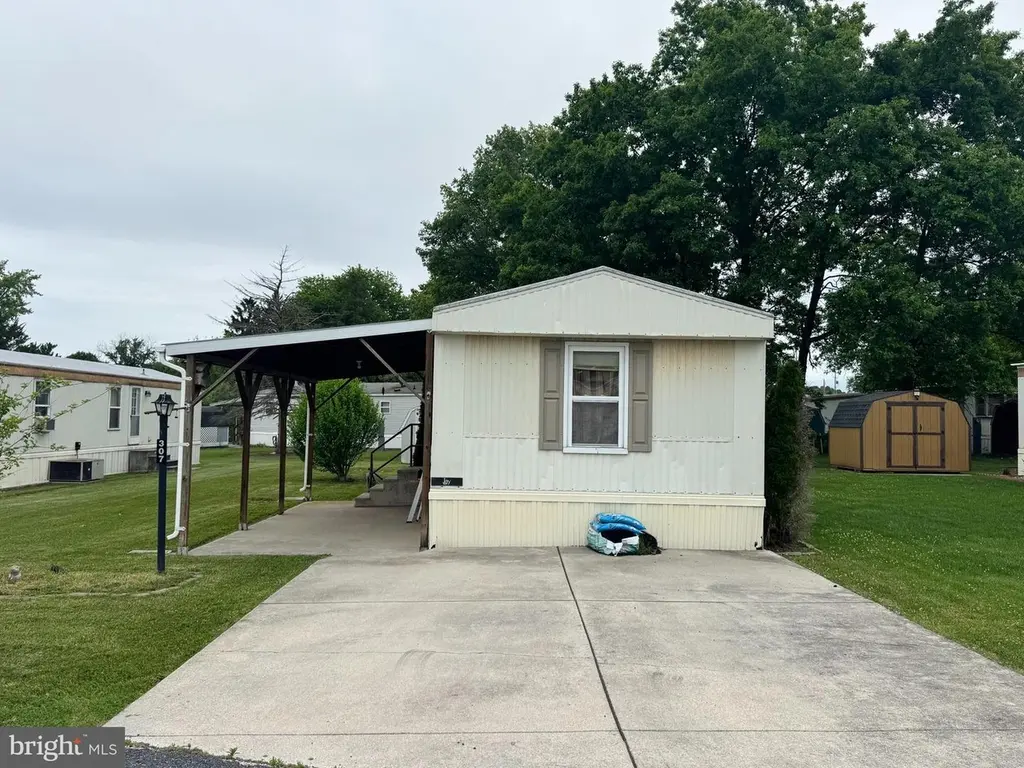
307 Benning Ave · Cumberland, PA
Flood risk 1/10 · Minimal
- FEMA flood zone
- X (unshaded)
- Chance of flooding over 30 yrs
- 0.0%
- Est. flood insurance / yr
- $507 – $1,088
Fire risk 1/10 · Minimal
- Est. fire insurance / yr
- $511 – $949
Heat risk 6/10 · Moderate
- Hot days now (above 101°F)
- 7 days/yr
- Hot days in 30 yrs
- 16 days/yr
Wind risk 3/10 · Minor
- Chance of severe wind over 30 yrs
- 6.0%
Air-quality risk 2/10 · Minimal
- Unhealthy air days now
- 1 days/yr
- Unhealthy air days in 30 yrs
- 2 days/yr
Risk factors via First Street. Map © Google.
Why this score? — see what drove the C- grade
The composite is a weighted blend of 9 inputs, each scored 0–100. Each bar is that input's sub-score; the figure is the points it added to the 100-point composite (weight × sub-score).
- Cash flow +15.0/30.0
- ARV discount +15.0/15.0
- 1% rule +5.0/10.0
- DSCR +5.0/10.0
- Schools +4.6/10.0
- Rent growth +2.5/5.0
- Livability +2.5/5.0
- Condition / age +2.5/5.0
- Appreciation +0.0/10.0
$30,000
🖨 Deal sheet (PDF) 📄 Offer letter ✓ Due diligence
Listing remarks MLS
Nicely remodeled with great floor plan. Must have park approval to purchase.
Key facts
- Newer hvac
- Shaded outdoor space
- Built 1986
Tags
Property features AI
Finance
- Financial info: Ground rent $668 monthly; Improvement assessed value per assessor
Exterior
- Parking: Off-street parking
- Utilities: Private/community water source; Electric hot water
- Home design: Manufactured home; Single-level living (main-level bedrooms)
- Construction: Aluminum siding; Above-grade finished area recorded (910); Year built per assessor
- Exterior features: Not in a federal flood zone; Ground rent paid monthly
Interior
- Bedrooms: Three bedrooms on the main level
- Bathrooms: One full bathroom; One half bathroom
- Heating & cooling: Heat pump(s); Oil heating fuel; Central air conditioning (electric)
- Interior features: No basement; Finished above-grade living space per assessor
Neighborhood map
What this means for you Summary
Snapshot
- This is a 3-bed/1.5-bath manufactured listed at $30k.
Deal economics
- At list price, monthly cash flow is $999 ($12k/yr) — positive.
- The deal already cash-flows at list — no discount required.
- Meets the 1% rule at list price ($2k rent vs $30k).
Location & tenants
- Location reads: area grade C — affects rentability + tenant quality, not the cash-flow math above.
- Gettysburg Area SD (rural): math 46% / reading 60% proficiency, ranked #132 of 539 in PA (top 24%) — acceptable for families but not a draw, mixed tenant base, ~2y average lease.
- Market conditions: 318 active listings in the ZIP; solid renter incomes; 403 units permitted in Adams County in 2024 (0 in 5+ unit buildings).
Forward outlook
- Local home prices are declining (-3.0%/yr); year-one equity from $207 of loan paydown is wiped out by about $900 of value loss. Plan a longer hold.
- Adams County population projected at -10% by 2050 — secular population decline; favor cash flow + early exit over multi-decade hold.
- At projected returns (-3.0% appreciation + 3.0% rent growth), your $8k cash investment doubles in ~1 year — after that, you're playing with house money.
Negotiation context
- Only 11 days on market — expect competitive offers; lowballing is unlikely to land.
- 3 sale attempts since 25y ago with the ask held roughly flat each time — persistent listings suggest the price (not the market) is what's stuck; bring a comps-based counter.
- Current owner paid $9k; list at $30k implies a 233% gain — meaningful room to come down on a strong offer.
Risks & watch-outs
- Climate carrying-cost: extreme-heat days projected 7→16/yr by 2055 (HVAC capex compounding) — expect insurance premiums to compound above CPI over the hold.
Questions for the listing agent
- Is there a deadline driving the sale (1031 exchange, divorce, estate, relocation)? That informs how much negotiation room exists.
- What's the average days-on-market for RENTAL listings here right now (not sales)? A rising rental-DOM trend means longer vacancies and softer asking-rent achievability than the comps imply.
- What's the recent tenant-quality profile in this submarket — average credit score on applications, eviction rate, late-payment / NSF rate, and stable-employment percentage? A property-management company in the area should have these aggregated.
- How much new for-sale + rental construction is in the pipeline within 1–3 miles? Heavy new supply typically softens prices + rents 12–24 months out; constrained supply supports both.
Investment metrics
- 1% rule
- 5.06% ✓
- Cap rate
- 46.27%
- Cash-on-cash
- 142.78%
- DSCR
- 7.35
- GRM
- 1.6
CMA / ARV
- ARV (on-the-fly)
- $42,770
- Comps found
- 2
Show comp detail 2 sales within ~0.75 mi
| Address | Dist | Beds/Ba | Sqft | Sold | Price | $/sf | Match |
|---|---|---|---|---|---|---|---|
| 99 Walker Ave | 0.19mi | 2/1.0 (-1) | 910 (0%) | 11mo | $40,000 | $44 | 75 |
| 98 Walker Ave | 0.18mi | 2/1.5 (-1) | 852 (-6%) | 19mo | $40,000 | $47 | 60 |
Match score weights: distance 35% · size 25% · config 20% · recency 20%. Top-matched comps best support the ARV.
Projected returns pro-forma
-3.0% appreciation · 3.0% rent growth · sell at horizon
- IRR
- —
- Equity multiple
- 8.00×
- Total profit
- $58,813
- Equity at exit
- $4,473
- IRR
- —
- Equity multiple
- 16.86×
- Total profit
- $133,257
- Equity at exit
- $2,594
Cash invested: $8,400 (down + closing). Projections, not guarantees.
Landlord ↔ Tenant lean methodology
- Overall (STATE)
- 62 Landlord-Friendly
- State Pennsylvania
- 62 Landlord-Friendly · EVEN
- County
- — inherits STATE
- City
- — inherits STATE
ZIP-level market 17325
- Home prices YoY
- -22.4%
- Active inventory
- 318
- Price-to-rent
- 1.6×
Monthly cashflow live
- Estimated rent
- $1,519 medium interval (Pro) →
- Mortgage (P&I)
- −$157
- Tax from tax record
- −$31 /mo · $370/yr
- Insurance
- −$12
- HOA
- −$0
- Vacancy / Maint / Mgmt
- −$319
- Net cashflow
- $999
Break-even live
Sensitivity live
| Price | -10% $1,016 | -5% $1,008 | +0% $999 | +5% $991 | +10% $982 |
|---|---|---|---|---|---|
| Rent | -10% $879 | -5% $939 | +0% $999 | +5% $1,059 | +10% $1,119 |
| Rate | -1.0pp $1,015 | -0.5pp $1,007 | base $999 | +0.5pp $992 | +1.0pp $984 |
UW: 25.0% down · 7.5% · 30yr · 1.5% tax · 5.0% vac · 8.0% maint · 8.0% mgmt
Financing live
Cash to close
- Down payment
- $7,500
- Closing costs
- $900
- Reserves months
- —
- Total cash needed
- —
Loan-product check · same deal, 3 products live
Conventional
25% down · 7.5% · 30yr
- Down + closing
- —
- Monthly P&I
- —
- Monthly cashflow
- —
- DSCR
- —
- Eligible?
- —
Personal DTI + credit; lowest rate.
DSCR
20% down · 8.5% · 30yr
- Down + closing
- —
- Monthly P&I
- —
- Monthly cashflow
- —
- DSCR
- —
- Eligible?
- —
No personal income docs; deal must DSCR.
Hard money
10% down · 12.0% · 12mo
- Down + closing
- —
- Monthly P&I
- —
- Monthly cashflow
- —
- DSCR
- —
- Eligible?
- —
Short-term bridge; refi at stabilization.
Listing history 9 events
-
2026-06-21days on market $30,000 Active 11 DOM
-
2026-06-19days on market $30,000 Active 9 DOM
-
2026-06-18days on market $30,000 Active 8 DOM
-
2026-06-17days on market $30,000 Active 7 DOM
-
2026-06-16days on market $30,000 Active 6 DOM
-
2026-06-16days on market $30,000 Active 5 DOM
-
2026-06-14days on market $30,000 Active 3 DOM
-
2026-06-12remarks 293-char remark
-
2026-06-12$30,000 Active 2 DOM
ⓘ Source: listings_history table (triggers on properties + properties_extension) + one-shot
backfill from property_details.listing_events for pre-trigger history.
Tax reassessment forecast PA · Partial reset (capped growth)
- Current annual tax
- $370 · $31/mo
- Projected year-2 tax
- $422 · $35/mo
- Expected delta
- +$52/yr (+$4/mo · 14.0%)
ⓘ Screening estimate from a state-policy table — verify with the county assessor before closing.
Climate risk First Street
- Flood 1/10 Low FEMA zone X (unshaded) · 0% chance over 30 yrs
- Wildfire 1/10 Low
- Heat 6/10 Major 7 d/yr ≥101°F today · 16 d/yr by 30 yrs out
- Wind 3/10 Moderate 6% chance of damaging wind over 30 yrs
- Air quality 2/10 Low 1 unhealthy d/yr today · 2 by 30 yrs out
Nearby sold comps map
Loading sold comps map…
Walkable amenities ~0.75 mi
Loading nearby amenities…
Taxation est. · year 1
- Rental income
- $18,230
- − Mortgage interest
- −$1,680
- − Property taxes
- −$370
- − Insurance
- −$150
- − Repairs & maintenance
- −$1,458
- − Management
- −$1,458
- − Depreciation
- −$873
- Taxable income
- $12,240
- Est. tax owed @ 24.0%
- −$2,937
- After-tax cash flow
- $9,056/yr
For passive investors: Depreciation is non-cash, so a rental often shows a tax loss while cash-flowing — sheltering income. Rental losses are passive: they offset passive income freely, and up to $25,000/yr can offset ordinary (W-2) income if you actively participate and your MAGI is under $100k (phasing out to $0 by $150k); unused losses carry forward. On sale, claimed depreciation is recaptured at up to 25%, and gains may owe capital-gains tax (a 1031 exchange can defer both). Figures are a year-1 estimate at your 24.0% rate — not tax advice; consult a CPA.
Schools (NCES district)
- District
- Gettysburg Area SD
- NCES district ID
- 4210710
- Math proficiency
- 46% ▼ -9.00%
- Reading proficiency
- 60% ▼ -9.00%
- Median HH income
- $58,451
- Composite
- 46.03/100
- National rank
- #2526
- State rank
- #132 of 539 in PA
Livability — Cumberland
No livability data for this city. (Only ~50 U.S. cities are tracked.)
Census & demographics
- County
- Adams County · 30,373 people
- Metro
- Gettysburg, PA
- Population (ZIP)
- 30,373
- Household income
- $80,948
- Rent vs Own
- Severe rent burden
- 447.0
Population outlook (Adams County) Hauer SSP2
- Today (2025)
- 102,494 people
- By 2030
- 101,890 · -0.6%
- By 2040
- 98,417 · -4.0%
- By 2050
- 92,014 · -10.2%
- By 2075
- 76,128 · -25.7%
- By 2100
- 58,931 · -42.5%
Race, ethnicity, and origin ACS 2023
- Neighborhood character
- Predominantly White (83%)
- Race & ethnicity
- White 83% Hispanic / Latino 9% Two or more races 5% Black 4% Asian 2%
- Hispanic origin (detail)
- Mexican 4% Puerto Rican 2%
- Common ancestry
- Romanian 3% Lithuanian 3% Serbian 2%
- Foreign-born
- 5% · Canada, China, Vietnam
- Languages at home
- 92% English-only · Spanish 4% Other Indo-European 1% Russian/Polish/Slavic 1%
Political lean MEDSL · Adams
- 2024 margin
- Solid R (+33.6) · D 32.7% · R 66.4%
- 2008→2024 swing
- -14.1pp toward R · 2008: -19.6pp · 2024: -33.6pp
- All cycles
- 2024: R+33.6 2020: R+34.1 2016: R+36.4 2012: R+27.6 2008: R+19.6
Not yet ingested
- Civics
- —
Market trends
- HPI YoY
- ▼ -81.49%
- Current HPI
- 282.6594
- Rent YoY
- —
- Metro
- Gettysburg, PA
- State GDP YoY
- ▲ 1.68%
- F500 in state
- 34
Industry mix (Fortune 500 HQ in PA)
| Industry | F500 HQs | Revenue |
|---|---|---|
| Healthcare | 2 | $309B |
|
||
| Insurance | 2 | $27B |
|
||
| Telecommunications / Media | 1 | $124B |
|
||
| Industrial Distribution | 1 | $22B |
|
||
| Financial Services | 1 | $20B |
|
||
| Chemicals / Materials | 1 | $18B |
|
||
Price history
+114.3% since first listed7 events — show timeline
- 2026-06-10 Listed $30,000 BRIGHT MLS
- 2013-12-13 Sold (MLS) $9,000 BRIGHT MLS
- 2013-12-03 Listing Removed — BRIGHT MLS
- 2013-06-25 Listed $12,000 BRIGHT MLS
- 2001-12-20 Sold (MLS) $14,000 BRIGHT MLS
- 2001-10-16 Listing Removed — BRIGHT MLS
- 2001-06-27 Listed $14,000 BRIGHT MLS
Property tax history
+1.8%/yrLatest (2026): $370 · +3.3% YoY. Source: county tax records.
Cash-flow waterfall
monthlySold comps — $/sqft
last 12 mo · ≤1 miLoading sold comps…