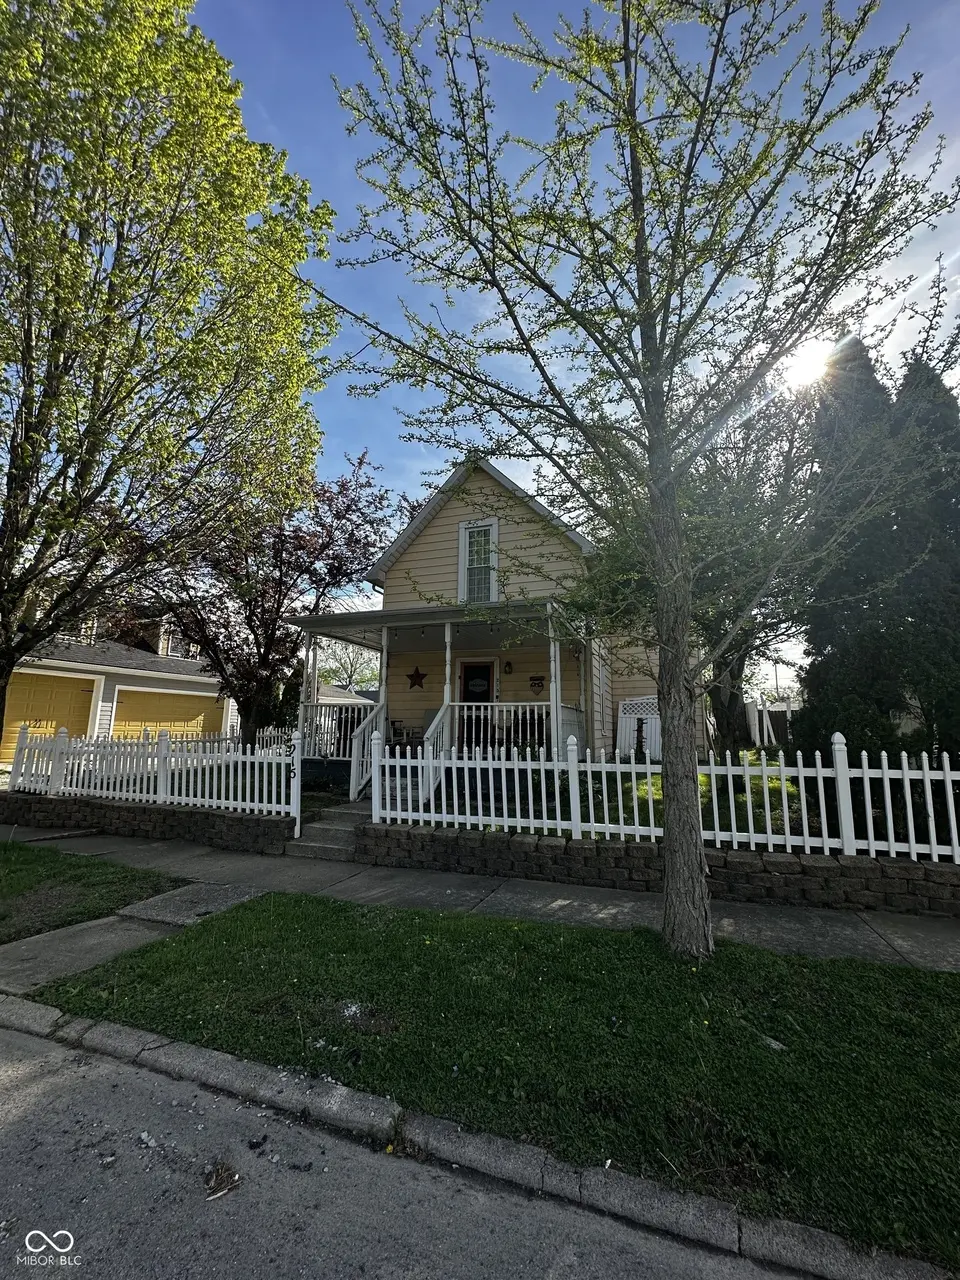
215 S Pearl St · Pendleton, IN
Flood risk 1/10 · Minimal
- FEMA flood zone
- X (unshaded)
- Chance of flooding over 30 yrs
- 0.0%
- Est. flood insurance / yr
- $507 – $1,088
Fire risk 1/10 · Minimal
- Est. fire insurance / yr
- $717 – $1,331
Heat risk 3/10 · Minor
- Hot days now (above 100°F)
- 7 days/yr
- Hot days in 30 yrs
- 19 days/yr
Wind risk 2/10 · Minimal
- Chance of severe wind over 30 yrs
- 0.0%
Air-quality risk 2/10 · Minimal
- Unhealthy air days now
- 1 days/yr
- Unhealthy air days in 30 yrs
- 1 days/yr
Risk factors via First Street. Map © Google.
Why this score? — see what drove the B grade
The composite is a weighted blend of 9 inputs, each scored 0–100. Each bar is that input's sub-score; the figure is the points it added to the 100-point composite (weight × sub-score).
- Cash flow +30.0/30.0
- 1% rule +10.0/10.0
- DSCR +10.0/10.0
- ARV discount +7.5/15.0
- Schools +4.2/10.0
- Livability +3.7/5.0
- Rent growth +2.5/5.0
- Condition / age +2.5/5.0
- Appreciation +0.0/10.0
$100,000
🖨 Deal sheet 📄 Offer letter ✓ Due diligence
Listing remarks
Opportunities like this don't come around often in the heart of downtown Pendleton! Situated on a desirable lot with convenient alley access, this property offers incredible potential. The home is in need of significant renovation and is being sold as-is, making it an ideal candidate for a full remodel or possible tear-down and rebuild. The property features a detached 2-car garage along with an additional storage shed, providing valuable space for tools, equipment, or future use. The lot offers a prime location within walking distance to all that downtown Pendleton has to offer. Whether you're an investor, builder, or buyer looking to create something new, bring your ideas and unlock the p
Key facts
- Alley access
- Walking distance
- Downtown pendleton
Tags
Property features AI
Finance
- Other: Lot size approximately 0.15 acre (< 1/4 acre)
Exterior
- Parking: Detached concrete garage with alley access and service door; 2-car garage
- Utilities: Public water; Municipal sewer connected; No solid waste service listed
- Home design: Residential single-family home; Two levels
- Construction: Aluminum siding; Other foundation
- Exterior features: Covered patio/porch; Storage shed; Sidewalks; Mature trees
Interior
- Kitchen: No appliances listed
- Bedrooms: Three bedrooms located on the upper level
- Bathrooms: One full bathroom (main/upper level)
- Heating & cooling: Forced air heating (natural gas); No central cooling
- Interior features: Attic access; Laundry in unit
- Laundry & utility: Laundry room (main level)
Neighborhood map
What this means for you Summary
Snapshot
- This is a 2-bed/1.0-bath single-family listed at $100k.
Deal economics
- At list price, monthly cash flow is $946 ($11k/yr) — positive.
- The deal already cash-flows at list — no discount required.
- Meets the 1% rule at list price ($2k rent vs $100k).
- Recommended offer: $97k (3.0% below list) — sets the bar for market timing.
- Cap rate 17.7% vs local median 3.3% in Pendleton — top-decile yield for the area; either an underpriced asset or a hidden risk that comps aren't pricing in. Stress-test before assuming the spread holds.
Location & tenants
- Location reads 73/100 on livability (#86 in IN) — a middle-class / working-renter tenant base. Strengths: crime A+, cost of living A+, housing A+; Watch: amenities F, commute F, health & safety F.
- South Madison Community School Corporation (rural): math 44% / reading 52% proficiency, ranked #60 of 301 in IN (top 20%) — families likely to look elsewhere, expect single-tenant / working-renter base with shorter leases.
- Zoned schools: Pendleton Heights High School (math 36% / reading 77%, grade C, #70 of 369 statewide, top 19%, 1,357 students, 31% FRL).
- Market conditions: 232 active listings in the ZIP; 3 comparable units currently listed for rent nearby; rentals leasing fast (median 4d on market — plan ~1-2 weeks tenant-placement turnaround); 184 units permitted in Madison County in 2024 (0 in 5+ unit buildings).
Forward outlook
- Local home prices are declining (-3.0%/yr); year-one equity from $691 of loan paydown is wiped out by about $3k of value loss. Plan a longer hold.
- Madison County population projected at -14% by 2050 — secular population decline; favor cash flow + early exit over multi-decade hold.
- At projected returns (-3.0% appreciation + 3.0% rent growth), your $28k cash investment doubles in ~3 years — after that, you're playing with house money.
Negotiation context
- It's been on market 47 days — a 3% lower offer ($97k) is reasonable based on typical stale-listing flexibility.
- 2 sale attempts; this cycle's ask has dropped $25k (20%) from the opening price — seller is motivated, your offer sets the floor, not the list.
Risks & watch-outs
- Watch-outs: built in 1899 — expect roof / HVAC / electrical / plumbing capex.
Questions for the listing agent
- It's been on market 47 days. Have you received any prior offers? Is the seller open to a 3% concession, seller financing, or rate buy-down credit?
- Built in 1899 — when were the roof, HVAC, electrical panel, plumbing, and water heater last replaced?
- Is there a deadline driving the sale (1031 exchange, divorce, estate, relocation)? That informs how much negotiation room exists.
- What's the average days-on-market for RENTAL listings here right now (not sales)? A rising rental-DOM trend means longer vacancies and softer asking-rent achievability than the comps imply.
- What's the recent tenant-quality profile in this submarket — average credit score on applications, eviction rate, late-payment / NSF rate, and stable-employment percentage? A property-management company in the area should have these aggregated.
- How much new for-sale + rental construction is in the pipeline within 1–3 miles? Heavy new supply typically softens prices + rents 12–24 months out; constrained supply supports both.
Investment metrics
- 1% rule
- 2.04% ✓
- Cap rate
- 17.65%
- Cash-on-cash
- 40.56%
- DSCR
- 2.80
- GRM
- 4.1
CMA / ARV
- ARV (on-the-fly)
- $260,712
- Comps found
- 12
Show comp detail 12 sales within ~0.75 mi
| Address | Dist | Beds/Ba | Sqft | Sold | Price | $/sf | Match |
|---|---|---|---|---|---|---|---|
| 139 N East St | 0.19mi | 3/1.0 (+1) | 1,850 (+1%) | 12mo | $250,000 | $135 | 75 |
| 118 W Water St | 0.31mi | 2/2.0 | 1,944 (+6%) | 1mo | $277,000 | $142 | 70 |
| 124 N Main St | 0.30mi | 3/1.0 (+1) | 1,800 (-2%) | 9mo | $210,000 | $117 | 70 |
| 308 E High St E | 0.03mi | 3/2.0 (+1) | 1,788 (-3%) | 19mo | $310,000 | $173 | 69 |
| 231 N East St | 0.35mi | 3/2.5 (+1) | 1,835 (-0%) | 12mo | $360,000 | $196 | 62 |
| 720 S Broadway St | 0.50mi | 2/1.0 | 1,640 (-11%) | 3mo | $165,000 | $101 | 56 |
| 316 Laurel St | 0.42mi | 2/1.0 | 2,016 (+10%) | 13mo | $239,000 | $119 | 53 |
| 621 S Silver St | 0.47mi | 3/1.5 (+1) | 2,027 (+10%) | 2mo | $360,000 | $178 | 52 |
| 644 Center St | 0.49mi | 2/2.0 | 2,064 (+12%) | 3mo | $222,000 | $108 | 50 |
| 23 Village Pkwy | 0.51mi | 3/2.5 (+1) | 1,865 (+2%) | 16mo | $280,000 | $150 | 50 |
| 402 S Broadway St | 0.25mi | 3/3.0 (+1) | 2,004 (+9%) | 15mo | $360,000 | $180 | 47 |
| 636 S Broadway St | 0.46mi | 3/2.0 (+1) | 2,106 (+15%) | 8mo | $295,000 | $140 | 39 |
Match score weights: distance 35% · size 25% · config 20% · recency 20%. Top-matched comps best support the ARV.
Projected returns pro-forma
-3.0% appreciation · 3.0% rent growth · sell at horizon
- IRR
- 37.0%
- Equity multiple
- 2.57×
- Total profit
- $44,089
- Equity at exit
- $14,910
- IRR
- 43.6%
- Equity multiple
- 5.15×
- Total profit
- $116,070
- Equity at exit
- $8,646
Cash invested: $28,000 (down + closing). Projections, not guarantees.
Landlord ↔ Tenant lean methodology
- Overall (STATE)
- 90 Strongly Landlord-Friendly
- State Indiana
- 90 Strongly Landlord-Friendly · R+11
- County
- — inherits STATE
- City
- — inherits STATE
ZIP-level market 46064
- Active inventory
- 232
- Price-to-rent
- 4.1×
Monthly cashflow live
- Estimated rent
- $2,039 medium interval (Pro) →
- Mortgage (P&I)
- −$524
- Tax from tax record
- −$98 /mo · $1,180/yr
- Insurance
- −$42
- HOA
- −$0
- Vacancy / Maint / Mgmt
- −$428
- Net cashflow
- $946
Break-even live
UW: 25.0% down · 7.5% · 30yr · 1.5% tax · 5.0% vac · 8.0% maint · 8.0% mgmt
Financing live
Cash to close
- Down payment
- $25,000
- Closing costs
- $3,000
- Reserves months
- —
- Total cash needed
- —
Loan-product check · same deal, 3 products live
Conventional
25% down · 7.5% · 30yr
- Down + closing
- —
- Monthly P&I
- —
- Monthly cashflow
- —
- DSCR
- —
- Eligible?
- —
Personal DTI + credit; lowest rate.
DSCR
20% down · 8.5% · 30yr
- Down + closing
- —
- Monthly P&I
- —
- Monthly cashflow
- —
- DSCR
- —
- Eligible?
- —
No personal income docs; deal must DSCR.
Hard money
10% down · 12.0% · 12mo
- Down + closing
- —
- Monthly P&I
- —
- Monthly cashflow
- —
- DSCR
- —
- Eligible?
- —
Short-term bridge; refi at stabilization.
Rent comps 3 comps
| Address | Beds | Baths | Sqft | Rent | $/sqft | DOM | Units | Dist |
|---|---|---|---|---|---|---|---|---|
| 235 E Water St Pendleton, IN | 3.0 | 1.5 | 1755 | $2,200 | $1.25 | 23d | 1 | 0.20mi |
| 296 Evening Bay Ct Pendleton, IN | 3.0 | 2.0 | 1400 | $1,595 | $1.14 | 3d | 1 | 1.13mi |
| 1253 S Pendleton Ave Pendleton, IN | 2.0 | 1.0 | 1432 | $1,350 | $0.94 | 1d | 1 | 1.16mi |
Listing history 13 events
-
2026-06-10status $100,000 Pending 47 DOM
-
2026-06-09days on market $100,000 Active 47 DOM
-
2026-06-08days on market $100,000 Active 46 DOM
-
2026-06-07days on market $100,000 Active 45 DOM
-
2026-06-05days on market $100,000 Active 42 DOM
-
2026-06-03days on market $100,000 Active 41 DOM
-
2026-06-02days on market $100,000 Active 40 DOM
-
2026-06-01days on market $100,000 Active 39 DOM
-
2026-05-31days on market $100,000 Active 38 DOM
-
2026-05-05price $100,000
-
2026-04-27status Active
-
2026-04-22status Pending
-
2026-04-17$125,000 Active
ⓘ Source: listings_history table (triggers on properties + properties_extension) + one-shot
backfill from property_details.listing_events for pre-trigger history.
Tax reassessment forecast IN · Partial reset (capped growth)
- Current annual tax
- $1,180 · $98/mo
- Projected year-2 tax
- $1,180 · $98/mo
- Expected delta
- $0/yr ($0/mo · 0.0%)
ⓘ Screening estimate from a state-policy table — verify with the county assessor before closing.
Climate risk First Street
- Flood 1/10 Low FEMA zone X (unshaded) · 0% chance over 30 yrs
- Wildfire 1/10 Low
- Heat 3/10 Moderate 7 d/yr ≥100°F today · 19 d/yr by 30 yrs out
- Wind 2/10 Low 0% chance of damaging wind over 30 yrs
- Air quality 2/10 Low 1 unhealthy d/yr today · 1 by 30 yrs out
Nearby sold comps map
Loading sold comps map…
Walkable amenities ~0.75 mi
Loading nearby amenities…
Taxation est. · year 1
- Rental income
- $24,469
- − Mortgage interest
- −$5,602
- − Property taxes
- −$1,180
- − Insurance
- −$500
- − Repairs & maintenance
- −$1,958
- − Management
- −$1,958
- − Depreciation
- −$2,909
- Taxable income
- $10,363
- Est. tax owed @ 24.0%
- −$2,487
- After-tax cash flow
- $8,870/yr
For passive investors: Depreciation is non-cash, so a rental often shows a tax loss while cash-flowing — sheltering income. Rental losses are passive: they offset passive income freely, and up to $25,000/yr can offset ordinary (W-2) income if you actively participate and your MAGI is under $100k (phasing out to $0 by $150k); unused losses carry forward. On sale, claimed depreciation is recaptured at up to 25%, and gains may owe capital-gains tax (a 1031 exchange can defer both). Figures are a year-1 estimate at your 24.0% rate — not tax advice; consult a CPA.
Schools (NCES district)
- District
- South Madison Community School Corporation
- NCES district ID
- 1810440
- Math proficiency
- 44% ▼ -13.00%
- Reading proficiency
- 52% ▼ -6.00%
- Median HH income
- $63,565
- Composite
- 42.4/100
- National rank
- #3231
- State rank
- #60 of 301 in IN
Livability — Pendleton
- Score
- 73/100
- State rank
- #86
- US rank
- #5014
Category grades
Schools grade is shown separately in the Schools card above.
Census & demographics
- Census place
- Pendleton, IN
- City population
- 17,730
- Population (ZIP)
- 17,730
Population outlook (Madison County) Hauer SSP2
- Today (2025)
- 125,800 people
- By 2030
- 122,640 · -2.5%
- By 2040
- 115,420 · -8.3%
- By 2050
- 108,148 · -14.0%
- By 2075
- 91,838 · -27.0%
- By 2100
- 75,670 · -39.8%
Race, ethnicity, and origin ACS 2023
- Neighborhood character
- Predominantly White (86%)
- Race & ethnicity
- White 86% Two or more races 6% Black 5% Hispanic / Latino 3% Asian 1%
- Common ancestry
- Slovak 3% Italian 2% Romanian 1%
- Foreign-born
- 2% · Canada
- Languages at home
- 96% English-only · Spanish 2% Other Indo-European 1%
Political lean MEDSL · Madison
- 2024 margin
- Strong R (+26.9) · D 35.6% · R 62.5% · Other 1.9%
- 2008→2024 swing
- -33.5pp toward R · 2008: 6.5pp · 2024: -26.9pp
- All cycles
- 2024: R+26.9 2020: R+22.6 2016: R+25.7 2012: R+4.5 2008: D+6.5
Not yet ingested
- Civics
- —
Market trends
- HPI YoY
- ▼ -160.39%
- Current HPI
- 227.4921
- Rent YoY
- —
- Metro
- —
- State GDP YoY
- ▲ 2.90%
- F500 in state
- 18
Industry mix (Fortune 500 HQ in IN)
| Industry | F500 HQs | Revenue |
|---|---|---|
| Industrial Machinery | 2 | $37B |
|
||
| Healthcare | 1 | $177B |
|
||
| Pharmaceuticals | 1 | $45B |
|
||
| Metals / Steel | 1 | $18B |
|
||
| Agriculture | 1 | $17B |
|
||
| Packaging | 1 | $12B |
|
||
Price history
-20.0% since first listed4 events — show timeline
- 2026-05-05 Price Changed $100,000 MIBOR as Distributed by MLS Grid
- 2026-04-27 Relisted — MIBOR as Distributed by MLS Grid
- 2026-04-22 Pending — MIBOR as Distributed by MLS Grid
- 2026-04-17 Listed $125,000 MIBOR as Distributed by MLS Grid
Property tax history
+7.0%/yrLatest (2024): $1,180 · +3.7% YoY. Source: county tax records.
Cash-flow waterfall
monthlySold comps — $/sqft
last 12 mo · ≤1 miLoading sold comps…