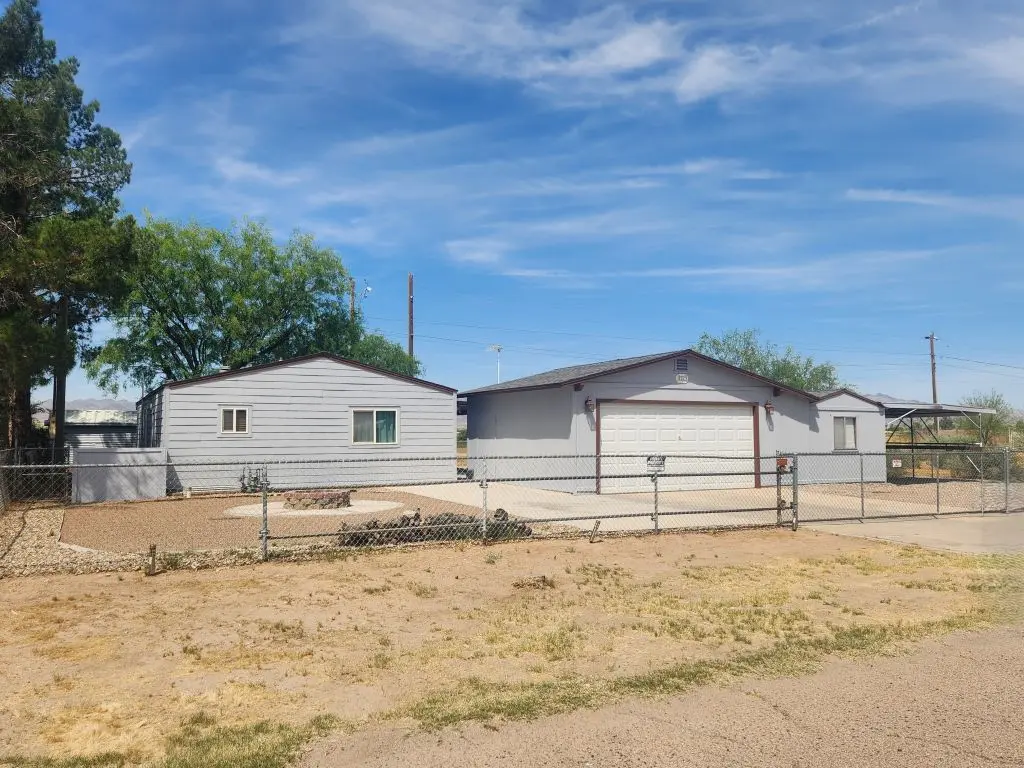
8257 S Green Valley Rd · Willow Valley, AZ
Flood risk 1/10 · Minimal
- FEMA flood zone
- X (shaded)
- Chance of flooding over 30 yrs
- 0.0%
- Est. flood insurance / yr
- $507 – $1,088
Fire risk 3/10 · Minor
- Est. fire insurance / yr
- $610 – $1,132
Heat risk 9/10 · Severe
- Hot days now (above 117°F)
- 7 days/yr
- Hot days in 30 yrs
- 16 days/yr
Wind risk 1/10 · Minimal
- Chance of severe wind over 30 yrs
- —
Air-quality risk 1/10 · Minimal
- Unhealthy air days now
- 0 days/yr
- Unhealthy air days in 30 yrs
- 0 days/yr
Risk factors via First Street. Map © Google.
Why this score? — see what drove the C- grade
The composite is a weighted blend of 9 inputs, each scored 0–100. Each bar is that input's sub-score; the figure is the points it added to the 100-point composite (weight × sub-score).
- Cash flow +18.2/30.0
- Appreciation +10.0/10.0
- ARV discount +7.0/15.0
- DSCR +5.7/10.0
- 1% rule +3.8/10.0
- Livability +3.0/5.0
- Rent growth +2.5/5.0
- Condition / age +2.5/5.0
- Schools +1.3/10.0
$205,000
🖨 Deal sheet 📄 Offer letter ✓ Due diligence
Listing remarks MLS
Very CLean! New outside paint! Best Mountain unobstructed views! Back to Farms! 2 blocks to River and Marina with rights! Oversized lot with lots of privacy! Big 2-car carport! Air conditioned shop shed.
Key facts
- Covered carport
- Double gates
- Open-concept living
Tags
Property features AI
Finance
- Other: Zoned RMH (Residential Mobile Homes)
- HOA & community: Homeowners association with $120 annual fee; Clubhouse in the community
Exterior
- Parking: Detached garage with garage door opener (2-car); Carport (1 space); Drive-through access
- Utilities: Public water; Septic sewer (septic tank); Electricity available; Natural gas available
- Home design: Manufactured home (double wide); Residential property
- Construction: Shingle roof
- Exterior features: Chain link fencing in front and back yard; Irregular lot; Paved road access; No pool
Interior
- Kitchen: Gas oven; Gas range; Dishwasher; Disposal; Refrigerator; Trash compactor; Water purifier
- Flooring: Carpet; Vinyl
- Bathrooms: 2 full bathrooms
- Heating & cooling: Natural gas heating; Central air conditioning; Ceiling fans; Electric cooling
- Interior features: Ceiling fans; Laminate counters; Open floorplan; Walk-in closet(s); Window coverings; Unfurnished
- Laundry & utility: Washer; Dryer; Water heater
Neighborhood map
What this means for you Summary
Snapshot
- This is a 2-bed/2.0-bath manufactured listed at $205k.
Deal economics
- At list price, monthly cash flow is $184 ($2k/yr) — positive.
- The deal already cash-flows at list — no discount required.
- To meet the 1% rule (rent ≥ 1% of price), the offer needs to be $180k (12.2% below list).
- Recommended offer: $180k (12.2% below list) — sets the bar for 1% rule.
Location & tenants
- Location reads 60/100 on livability (#170 in AZ) — a middle-class / working-renter tenant base. Strengths: cost of living A+, housing A-; Watch: health & safety C-, crime D, schools F.
- Colorado River Union High School District (4381) (town): math 13% / reading 17% proficiency, ranked #213 of 249 in AZ (top 86%) — low school quality limits family demand, transient renter base, plan for 1-2y turnover.
- Market conditions: 217 active listings in the ZIP; 1 comparable units currently listed for rent nearby; 2,543 units permitted in Mohave County in 2024 (33 in 5+ unit buildings).
Forward outlook
- In year one you build about $22k of equity ($1k loan paydown + $20k appreciation (10.0% local appreciation)).
- Mohave County population projected to shrink 6% by 2050 — rents likely to lag national; underwrite the cash flow, not the appreciation.
- At projected returns (10.0% appreciation + 3.0% rent growth), your $57k cash investment doubles in ~3 years — after that, you're playing with house money.
- By year 2, paydown + projected appreciation supports a ~$35k cash-out refi (75% LTV) — recoverable capital for the next deal without selling this one.
Negotiation context
- It's been on market 17 days — a 2% lower offer ($202k) is reasonable based on typical stale-listing flexibility.
- 3 sale attempts since 9y ago with the ask held roughly flat each time — persistent listings suggest the price (not the market) is what's stuck; bring a comps-based counter.
- Current owner paid $112k; list at $205k implies a 82% gain — meaningful room to come down on a strong offer.
Risks & watch-outs
- Climate carrying-cost: extreme-heat days projected 7→16/yr by 2055 (HVAC capex compounding) — expect insurance premiums to compound above CPI over the hold.
Questions for the listing agent
- What does the HOA fee cover, when was the last increase, and are there any pending special assessments or reserve-fund shortfalls?
- Is there a deadline driving the sale (1031 exchange, divorce, estate, relocation)? That informs how much negotiation room exists.
- Schools are F-rated, which usually means shorter tenancies and higher turnover. Who's the typical renter profile here, and what's been the actual vacancy rate?
- Crime grade is D in this area — have there been break-ins, vandalism, or insurance claims at this property in the last 3 years? What carrier currently insures it and at what premium?
- What's the average days-on-market for RENTAL listings here right now (not sales)? A rising rental-DOM trend means longer vacancies and softer asking-rent achievability than the comps imply.
- What's the recent tenant-quality profile in this submarket — average credit score on applications, eviction rate, late-payment / NSF rate, and stable-employment percentage? A property-management company in the area should have these aggregated.
- How much new for-sale + rental construction is in the pipeline within 1–3 miles? Heavy new supply typically softens prices + rents 12–24 months out; constrained supply supports both.
Investment metrics
- 1% rule
- 0.88% ✗
- Cap rate
- 7.37%
- Cash-on-cash
- 3.84%
- DSCR
- 1.17
- GRM
- 9.5
CMA / ARV
- ARV (on-the-fly)
- $202,672
- Comps found
- 4
Show comp detail 4 sales within ~0.75 mi
| Address | Dist | Beds/Ba | Sqft | Sold | Price | $/sf | Match |
|---|---|---|---|---|---|---|---|
| 8025 S Green Valley Rd | 0.47mi | 2/1.0 | 900 (-6%) | 1mo | $132,000 | $147 | 63 |
| 8105 S Evergreen Dr | 0.36mi | 2/1.0 | 1,025 (+7%) | 20mo | $210,000 | $205 | 50 |
| 7916 S Teal St | 0.74mi | 2/1.5 | 1,000 (+5%) | 16mo | $238,000 | $238 | 42 |
| 7894 S Meadowlark St | 0.75mi | 2/2.0 | 840 (-12%) | 8mo | $178,000 | $212 | 38 |
Match score weights: distance 35% · size 25% · config 20% · recency 20%. Top-matched comps best support the ARV.
Projected returns pro-forma
10.0% appreciation · 3.0% rent growth · sell at horizon
- IRR
- 27.0%
- Equity multiple
- 3.15×
- Total profit
- $123,271
- Equity at exit
- $184,680
- IRR
- 23.6%
- Equity multiple
- 7.16×
- Total profit
- $353,643
- Equity at exit
- $398,270
Cash invested: $57,400 (down + closing). Projections, not guarantees.
Landlord ↔ Tenant lean methodology
- Overall (STATE)
- 87 Strongly Landlord-Friendly
- State Arizona
- 87 Strongly Landlord-Friendly · R+3
- County
- — inherits STATE
- City
- — inherits STATE
ZIP-level market 86440
- Home prices YoY
- 4.2%
- Active inventory
- 217
- Price-to-rent
- 9.5×
Monthly cashflow live
- Estimated rent
- $1,800 medium interval (Pro) →
- Mortgage (P&I)
- −$1,075
- Tax from tax record
- −$68 /mo · $813/yr
- Insurance
- −$85
- HOA
- −$10
- Vacancy / Maint / Mgmt
- −$378
- Net cashflow
- $184
Break-even live
UW: 25.0% down · 7.5% · 30yr · 1.5% tax · 5.0% vac · 8.0% maint · 8.0% mgmt
Financing live
Cash to close
- Down payment
- $51,250
- Closing costs
- $6,150
- Reserves months
- —
- Total cash needed
- —
Loan-product check · same deal, 3 products live
Conventional
25% down · 7.5% · 30yr
- Down + closing
- —
- Monthly P&I
- —
- Monthly cashflow
- —
- DSCR
- —
- Eligible?
- —
Personal DTI + credit; lowest rate.
DSCR
20% down · 8.5% · 30yr
- Down + closing
- —
- Monthly P&I
- —
- Monthly cashflow
- —
- DSCR
- —
- Eligible?
- —
No personal income docs; deal must DSCR.
Hard money
10% down · 12.0% · 12mo
- Down + closing
- —
- Monthly P&I
- —
- Monthly cashflow
- —
- DSCR
- —
- Eligible?
- —
Short-term bridge; refi at stabilization.
Rent comps 1 comps
| Address | Beds | Baths | Sqft | Rent | $/sqft | DOM | Units | Dist |
|---|---|---|---|---|---|---|---|---|
| 7866 S Meadowlark St Mohave Valley, AZ | 3.0 | 2.0 | 1040 | $1,800 | $1.73 | 13d | 1 | 0.83mi |
HOA detail
- Monthly dues
- $10 · $120/yr
Listing history 12 events
-
2026-06-01status $205,000 Pending 17 DOM
-
2026-05-31days on market $205,000 Active 17 DOM
-
2026-05-30days on market $205,000 Active 16 DOM
-
2026-05-07status Pending
-
2026-04-25status Active
-
2026-04-23status Pending
-
2026-04-22$205,000 Active
-
2018-03-27soldstatus $112,400 203-char remark
Show marketing remark (203 chars)
Very CLean! New outside paint! Best Mountain unobstructed views! Back to Farms! 2 blocks to River and Marina with rights! Oversized lot with lots of privacy! Big 2-car carport! Air conditioned shop shed.
-
2018-03-23soldstatus $112,400
-
2017-10-25$114,900 203-char remark
Show marketing remark (203 chars)
Very CLean! New outside paint! Best Mountain unobstructed views! Back to Farms! 2 blocks to River and Marina with rights! Oversized lot with lots of privacy! Big 2-car carport! Air conditioned shop shed.
-
1998-12-31soldstatus $52,000
-
1995-04-14soldstatus $45,000
ⓘ Source: listings_history table (triggers on properties + properties_extension) + one-shot
backfill from property_details.listing_events for pre-trigger history.
Tax reassessment forecast AZ · Resets to sale price
- Current annual tax
- $813 · $68/mo
- Projected year-2 tax
- $1,353 · $113/mo
- Expected delta
- +$540/yr (+$45/mo · 66.4%)
ⓘ Screening estimate from a state-policy table — verify with the county assessor before closing.
Climate risk First Street
- Flood 1/10 Low FEMA zone X (shaded) · 0% chance over 30 yrs
- Wildfire 3/10 Moderate
- Heat 9/10 Extreme 7 d/yr ≥117°F today · 16 d/yr by 30 yrs out
- Wind 1/10 Low
- Air quality 1/10 Low 0 unhealthy d/yr today · 0 by 30 yrs out
Nearby sold comps map
Loading sold comps map…
Walkable amenities ~0.75 mi
Loading nearby amenities…
Taxation est. · year 1
- Rental income
- $21,600
- − Mortgage interest
- −$11,483
- − Property taxes
- −$813
- − Insurance
- −$1,025
- − Repairs & maintenance
- −$1,728
- − Management
- −$1,728
- − HOA
- −$120
- − Depreciation
- −$5,964
- Taxable loss
- −$1,261
- Est. tax savings @ 24.0%
- +$303
- After-tax cash flow
- $2,508/yr
For passive investors: Depreciation is non-cash, so a rental often shows a tax loss while cash-flowing — sheltering income. Rental losses are passive: they offset passive income freely, and up to $25,000/yr can offset ordinary (W-2) income if you actively participate and your MAGI is under $100k (phasing out to $0 by $150k); unused losses carry forward. On sale, claimed depreciation is recaptured at up to 25%, and gains may owe capital-gains tax (a 1031 exchange can defer both). Figures are a year-1 estimate at your 24.0% rate — not tax advice; consult a CPA.
Schools (NCES district)
- District
- Colorado River Union High School District (4381)
- NCES district ID
- 0400082
- Math proficiency
- 13% ▼ -17.00%
- Reading proficiency
- 17% ▼ -18.00%
- Median HH income
- $39,132
- Composite
- 12.72/100
- National rank
- #9603
- State rank
- #213 of 249 in AZ
Livability — Willow Valley
- Score
- 60/100
- State rank
- #170
- US rank
- #18589
Category grades
Schools grade is shown separately in the Schools card above.
Census & demographics
- Census place
- Willow Valley, AZ
- Population (ZIP)
- 8,403
Population outlook (Mohave County) Hauer SSP2
- Today (2025)
- 209,184 people
- By 2030
- 209,674 · +0.2%
- By 2040
- 205,897 · -1.6%
- By 2050
- 196,810 · -5.9%
- By 2075
- 169,454 · -19.0%
- By 2100
- 136,630 · -34.7%
Race, ethnicity, and origin ACS 2023
- Neighborhood character
- Predominantly White (73%)
- Race & ethnicity
- White 73% Hispanic / Latino 20% Two or more races 11% Native American 4%
- Hispanic origin (detail)
- Mexican 11%
- Common ancestry
- Lithuanian 3% Iranian 2% Italian 2%
- Foreign-born
- 1% · Canada
- Languages at home
- 96% English-only · Spanish 3%
Political lean MEDSL · Mohave
- 2024 margin
- Solid R (+55.8) · D 21.8% · R 77.6%
- 2008→2024 swing
- -22.9pp toward R · 2008: -32.9pp · 2024: -55.8pp
- All cycles
- 2024: R+55.8 2020: R+51.3 2016: R+51.5 2012: R+42.6 2008: R+32.9
Not yet ingested
- Civics
- —
Market trends
- HPI YoY
- ▲ 13.05%
- Current HPI
- 322.7772
- Rent YoY
- —
- Metro
- —
- State GDP YoY
- ▲ 4.54%
- F500 in state
- 20
Industry mix (Fortune 500 HQ in AZ)
| Industry | F500 HQs | Revenue |
|---|---|---|
| Technology | 2 | $13B |
|
||
| Mining / Metals | 1 | $23B |
|
||
| Environmental Services | 1 | $16B |
|
||
| Metals / Steel | 1 | $14B |
|
||
| Technology Distribution | 1 | $9B |
|
||
| Homebuilding | 1 | $8B |
|
||
Price history
+355.6% since first listed9 events — show timeline
- 2026-05-07 Pending — WARDEX
- 2026-04-25 Relisted — WARDEX
- 2026-04-23 Pending — WARDEX
- 2026-04-22 Listed $205,000 WARDEX
- 2018-03-27 Sold (MLS) $112,400 WARDEX
- 2018-03-23 Sold (Public Records) $112,400 Public Records
- 2017-10-25 Listed $114,900 WARDEX
- 1998-12-31 Sold (Public Records) $52,000 Public Records
- 1995-04-14 Sold (Public Records) $45,000 Public Records
Property tax history
+2.5%/yrLatest (2025): $813 · +13.5% YoY. Source: county tax records.
Cash-flow waterfall
monthlySold comps — $/sqft
last 12 mo · ≤1 miLoading sold comps…