 🏷️ Likely Rental
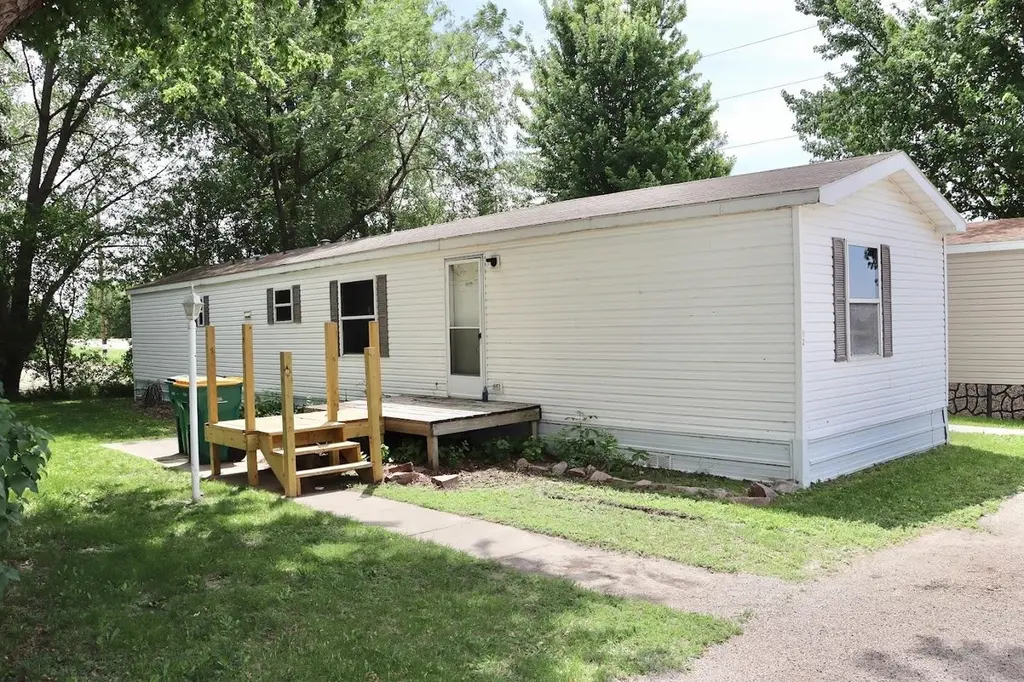
806 28th St #2 · Milford, IA
Flood risk 1/10 · Minimal
- FEMA flood zone
- X (unshaded)
- Chance of flooding over 30 yrs
- 0.0%
- Est. flood insurance / yr
- $507 – $1,088
Fire risk 5/10 · Moderate
- Est. fire insurance / yr
- $902 – $1,676
Heat risk 2/10 · Minimal
- Hot days now (above 99°F)
- 7 days/yr
- Hot days in 30 yrs
- 16 days/yr
Wind risk 2/10 · Minimal
- Chance of severe wind over 30 yrs
- —
Air-quality risk 1/10 · Minimal
- Unhealthy air days now
- 0 days/yr
- Unhealthy air days in 30 yrs
- 0 days/yr
Risk factors via First Street. Map © Google.
Why this score? — see what drove the B grade
The composite is a weighted blend of 9 inputs, each scored 0–100. Each bar is that input's sub-score; the figure is the points it added to the 100-point composite (weight × sub-score).
- Cash flow +30.0/30.0
- 1% rule +10.0/10.0
- DSCR +10.0/10.0
- ARV discount +7.5/15.0
- Schools +6.7/10.0
- Livability +4.2/5.0
- Rent growth +2.5/5.0
- Condition / age +2.2/5.0
- Appreciation +0.0/10.0
$49,900
🖨 Deal sheet 📄 Offer letter ✓ Due diligence
Listing remarks
Perfectly situated just a short distance from Terrace Park Beach and only minutes from the excitement of Arnolds Park Amusement Park, you won't find a property at a better price! This 2-bedroom, 2-bathroom Okoboji Village home is looking for the right person to make it their own. Lot rent is $240/month. Don't miss this opportunity to own an affordable piece of the Okoboji lifestyle - call today for a showing!
Key facts
- Built 1996
- Listed 10 days
Property features AI
Exterior
- Utilities: Public water; Public sewer
- Home design: Single-family residence; One story
- Construction: Vinyl siding
Interior
- Bathrooms: 2 full bathrooms
- Heating & cooling: Natural gas heating; Forced air
- Interior features: One-level living
Neighborhood map
What this means for you Summary
Snapshot
- This is a 2-bed/2.0-bath single-family listed at $50k. Condition is rated fair.
Deal economics
- At list price, monthly cash flow is $355 ($4k/yr) — positive.
- The deal already cash-flows at list — no discount required.
- Meets the 1% rule at list price ($886 rent vs $50k).
- Cap rate 14.8% vs local median 2.7% in Milford — top-decile yield for the area; either an underpriced asset or a hidden risk that comps aren't pricing in. Stress-test before assuming the spread holds.
Location & tenants
- Location reads 84/100 on livability (#28 in IA, #795 nationally) — a professional / high-income tenant draw. Strengths: crime A+, cost of living A+, housing A+; Watch: amenities D-, commute F.
- Okoboji Community School District (town): math 78% / reading 80% proficiency, ranked #40 of 289 in IA (top 14%) — strong family-tenant draw, lease renewals of 3-5y typical.
- Market conditions: 56 active listings in the ZIP; 295 units permitted in Dickinson County in 2024 (16 in 5+ unit buildings).
Forward outlook
- Local home prices are declining (-3.0%/yr); year-one equity from $345 of loan paydown is wiped out by about $1k of value loss. Plan a longer hold.
- Dickinson County population projected at +12% by 2050 — modest demand growth; plan on rents tracking national, not racing it.
- At projected returns (-3.0% appreciation + 3.0% rent growth), your $14k cash investment doubles in ~4 years — after that, you're playing with house money.
Negotiation context
- Only 10 days on market — expect competitive offers; lowballing is unlikely to land.
Risks & watch-outs
- Climate carrying-cost: moderate wildfire risk — expect insurance premiums to compound above CPI over the hold.
Questions for the listing agent
- Have any recent inspections been done? Can we get a copy of the seller's disclosures and any deferred-maintenance estimates?
- Is there a deadline driving the sale (1031 exchange, divorce, estate, relocation)? That informs how much negotiation room exists.
- Schools are A-rated — typically a magnet for longer-tenancy family renters. What's the average tenant stay here, and is there a school-zone premium baked into asking?
- What's the average days-on-market for RENTAL listings here right now (not sales)? A rising rental-DOM trend means longer vacancies and softer asking-rent achievability than the comps imply.
- What's the recent tenant-quality profile in this submarket — average credit score on applications, eviction rate, late-payment / NSF rate, and stable-employment percentage? A property-management company in the area should have these aggregated.
- How much new for-sale + rental construction is in the pipeline within 1–3 miles? Heavy new supply typically softens prices + rents 12–24 months out; constrained supply supports both.
Investment metrics
- 1% rule
- 1.77% ✓
- Cap rate
- 14.83%
- Cash-on-cash
- 30.47%
- DSCR
- 2.36
- GRM
- 4.7
CMA / ARV
- ARV (on-the-fly)
- $379,764
- Comps found
- 2
Show comp detail 2 sales within ~0.75 mi
| Address | Dist | Beds/Ba | Sqft | Sold | Price | $/sf | Match |
|---|---|---|---|---|---|---|---|
| 900 Terrace Park Blvd | 0.41mi | 2/1.0 | 960 (+4%) | 8mo | $395,000 | $411 | 64 |
| 3200 Okoboji Ave #106 | 0.40mi | 2/1.0 | 960 (+4%) | 10mo | $139,000 | $145 | 63 |
Match score weights: distance 35% · size 25% · config 20% · recency 20%. Top-matched comps best support the ARV.
Projected returns pro-forma
-3.0% appreciation · 3.0% rent growth · sell at horizon
- IRR
- 25.2%
- Equity multiple
- 2.04×
- Total profit
- $14,525
- Equity at exit
- $7,440
- IRR
- 32.9%
- Equity multiple
- 3.99×
- Total profit
- $41,801
- Equity at exit
- $4,314
Cash invested: $13,972 (down + closing). Projections, not guarantees.
Landlord ↔ Tenant lean methodology
- Overall (STATE)
- 83 Strongly Landlord-Friendly
- State Iowa
- 83 Strongly Landlord-Friendly · R+6
- County
- — inherits STATE
- City
- — inherits STATE
ZIP-level market 51351
- Home prices YoY
- -22.4%
- Active inventory
- 56
- Price-to-rent
- 4.7×
Monthly cashflow live
- Estimated rent
- $886 medium interval (Pro) →
- Mortgage (P&I)
- −$262
- Tax est. 1.5%
- −$62 /mo · $748/yr
- Insurance
- −$21
- HOA
- −$0
- Vacancy / Maint / Mgmt
- −$186
- Net cashflow
- $355
Break-even live
UW: 25.0% down · 7.5% · 30yr · 1.5% tax · 5.0% vac · 8.0% maint · 8.0% mgmt
Financing live
Cash to close
- Down payment
- $12,475
- Closing costs
- $1,497
- Reserves months
- —
- Total cash needed
- —
Loan-product check · same deal, 3 products live
Conventional
25% down · 7.5% · 30yr
- Down + closing
- —
- Monthly P&I
- —
- Monthly cashflow
- —
- DSCR
- —
- Eligible?
- —
Personal DTI + credit; lowest rate.
DSCR
20% down · 8.5% · 30yr
- Down + closing
- —
- Monthly P&I
- —
- Monthly cashflow
- —
- DSCR
- —
- Eligible?
- —
No personal income docs; deal must DSCR.
Hard money
10% down · 12.0% · 12mo
- Down + closing
- —
- Monthly P&I
- —
- Monthly cashflow
- —
- DSCR
- —
- Eligible?
- —
Short-term bridge; refi at stabilization.
Listing history 8 events
-
2026-06-15statusdays on market $49,900 Pending 10 DOM
-
2026-06-13days on market $49,900 Active 9 DOM
-
2026-06-12days on market $49,900 Active 8 DOM
-
2026-06-09days on market $49,900 Active 5 DOM
-
2026-06-08days on market $49,900 Active 4 DOM
-
2026-06-07days on market $49,900 Active 3 DOM
-
2026-06-07remarks 412-char remark
-
2026-06-07$49,900 Active 2 DOM
ⓘ Source: listings_history table (triggers on properties + properties_extension) + one-shot
backfill from property_details.listing_events for pre-trigger history.
Climate risk First Street
- Flood 1/10 Low FEMA zone X (unshaded) · 0% chance over 30 yrs
- Wildfire 5/10 Major
- Heat 2/10 Low 7 d/yr ≥99°F today · 16 d/yr by 30 yrs out
- Wind 2/10 Low
- Air quality 1/10 Low 0 unhealthy d/yr today · 0 by 30 yrs out
Nearby sold comps map
Loading sold comps map…
Walkable amenities ~0.75 mi
Loading nearby amenities…
Taxation est. · year 1
- Rental income
- $10,628
- − Mortgage interest
- −$2,795
- − Property taxes
- −$748
- − Insurance
- −$250
- − Repairs & maintenance
- −$850
- − Management
- −$850
- − Depreciation
- −$1,452
- Taxable income
- $3,682
- Est. tax owed @ 24.0%
- −$884
- After-tax cash flow
- $3,374/yr
For passive investors: Depreciation is non-cash, so a rental often shows a tax loss while cash-flowing — sheltering income. Rental losses are passive: they offset passive income freely, and up to $25,000/yr can offset ordinary (W-2) income if you actively participate and your MAGI is under $100k (phasing out to $0 by $150k); unused losses carry forward. On sale, claimed depreciation is recaptured at up to 25%, and gains may owe capital-gains tax (a 1031 exchange can defer both). Figures are a year-1 estimate at your 24.0% rate — not tax advice; consult a CPA.
Condition & rehab AI · 13 photos
This home is in fair condition with some minor repairs and maintenance needed. Painting the exterior and interior walls and replacing the carpeted flooring can significantly increase its resale and rental value.
Repairs flagged
- Minor Paint — There are some minor signs of peeling paint on the exterior and interior walls.
- Minor Flooring — The carpeted flooring shows some wear and tear, which could be addressed with a cleaning or replacement.
Value-add opportunities
- Both Paint the exterior and interior walls — Painting the exterior and interior walls can improve the overall appearance of the home and make it more appealing to potential buyers or renters.
- Both Replace the carpeted flooring — Replacing the carpeted flooring with a more modern and durable material can improve the overall appearance of the home and make it more appealing to potential buyers or renters.
Renovation cost estimate screening
| Repair item | Severity | Est. cost |
|---|---|---|
| Paint · There are some minor signs of peeling paint on the exterior and interior walls. | Minor | $500–3,000 |
| Flooring · The carpeted flooring shows some wear and tear, which could be addressed with a cleaning or replacement. | Minor | $500–3,000 |
| Total estimated repair cost · 2 items | $1,000–6,000 |
Value-add ROI direction
- Both Paint the exterior and interior walls — Painting the exterior and interior walls can improve the overall appearance of the home and make it more appealing to potential buyers or renters. ↑
- Both Replace the carpeted flooring — Replacing the carpeted flooring with a more modern and durable material can improve the overall appearance of the home and make it more appealing to potential buyers or renters. ↑
ⓘ Cost ranges are severity-bucket heuristics (US national rule-of-thumb). Get contractor quotes + a written scope before underwriting a rehab budget.
Schools (NCES district)
- District
- Okoboji Community School District
- NCES district ID
- 1900021
- Math proficiency
- 78% ▲ 8.00%
- Reading proficiency
- 80% ▲ 6.00%
- Median HH income
- $50,522
- Composite
- 66.88/100
- National rank
- #403
- State rank
- #40 of 289 in IA
Livability — Milford
- Score
- 84/100
- State rank
- #28
- US rank
- #795
Category grades
Schools grade is shown separately in the Schools card above.
Census & demographics
- Census place
- Milford, IA
- Population (ZIP)
- 4,990
Population outlook (Dickinson County) Hauer SSP2
- Today (2025)
- 18,133 people
- By 2030
- 18,610 · +2.6%
- By 2040
- 19,456 · +7.3%
- By 2050
- 20,307 · +12.0%
- By 2075
- 23,155 · +27.7%
- By 2100
- 24,449 · +34.8%
Race, ethnicity, and origin ACS 2023
- Neighborhood character
- Predominantly White (95%)
- Race & ethnicity
- White 95% Hispanic / Latino 4% Two or more races 3%
- Common ancestry
- Portuguese 9% Iranian 5% Lithuanian 2%
- Foreign-born
- 1% · Canada, Jamaica
- Languages at home
- 98% English-only · Spanish 1% German/W. Germanic 1%
Political lean MEDSL · Dickinson
- 2024 margin
- Solid R (+40.0) · D 29.5% · R 69.5% · Other 1.1%
- 2008→2024 swing
- -34.6pp toward R · 2008: -5.4pp · 2024: -40.0pp
- All cycles
- 2024: R+40.0 2020: R+33.6 2016: R+36.0 2012: R+18.0 2008: R+5.4
Not yet ingested
- Civics
- —
Market trends
- HPI YoY
- ▼ -62.04%
- Current HPI
- 214.6362
- Rent YoY
- —
- Metro
- —
- State GDP YoY
- ▲ 2.48%
- F500 in state
- 4
Industry mix (Fortune 500 HQ in IA)
| Industry | F500 HQs | Revenue |
|---|---|---|
| Financial Services | 1 | $16B |
|
||
| Retail / Convenience | 1 | $15B |
|
||
Price history
1 event — show timeline
- 2026-06-04 Listed $49,900 Iowa Great Lakes BOR
Cash-flow waterfall
monthlySold comps — $/sqft
last 12 mo · ≤1 miLoading sold comps…