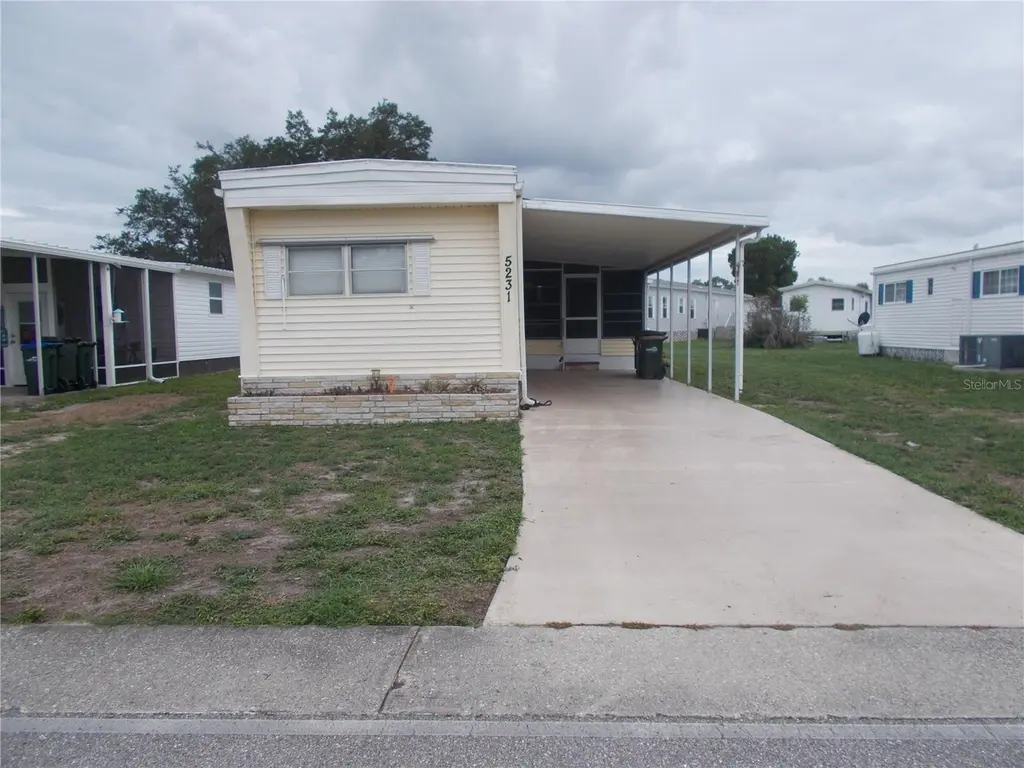
5231 Palena Blvd · North Port, FL
Flood risk 6/10 · Moderate
- FEMA flood zone
- X (shaded)
- Chance of flooding over 30 yrs
- 0.71%
- Est. flood insurance / yr
- $507 – $1,088
Fire risk 1/10 · Minimal
- Est. fire insurance / yr
- $947 – $1,759
Heat risk 10/10 · Severe
- Hot days now (above 108°F)
- 7 days/yr
- Hot days in 30 yrs
- 26 days/yr
Wind risk 10/10 · Severe
- Chance of severe wind over 30 yrs
- 99.0%
Air-quality risk 3/10 · Minor
- Unhealthy air days now
- 2 days/yr
- Unhealthy air days in 30 yrs
- 3 days/yr
Risk factors via First Street. Map © Google.
Why this score? — see what drove the B grade
The composite is a weighted blend of 9 inputs, each scored 0–100. Each bar is that input's sub-score; the figure is the points it added to the 100-point composite (weight × sub-score).
- Cash flow +30.0/30.0
- 1% rule +10.0/10.0
- DSCR +10.0/10.0
- ARV discount +7.5/15.0
- Schools +5.4/10.0
- Livability +3.8/5.0
- Rent growth +2.6/5.0
- Condition / age +2.5/5.0
- Appreciation +0.0/10.0
$63,900
🖨 Deal sheet (PDF) 📄 Offer letter ✓ Due diligence
Listing remarks MLS
Move In Ready! This SPACIOUS 2 bedroom 2 bath, neat as a whistle and lovingly maintained home is located in the highly desirable GATED Holiday Park community. NEW ROOF, NEWER AC, enclosed, screened porch and Utility Shed with washer and dryer, utility sink and storage. Being sold FURNISHED. This Active 55+ community boasts 2 swimming pools, tennis and racquetball courts, bocce ball courts and shuffleboard. Enjoy the park-like setting with abundant green space, mature landscaping, water features, ponds and ducks swimming by. You own your own land with the deed. THE MONTHLY MAINTENANCE FEES OF $106 PER MONTH ARE INCLUDED IN YOUR PROPERTY TAX BILL FOR A TOTAL AMOUNT OF $1272 PER YEAR. Service Animals are allowed. Please check Holiday Park website for required paperwork.
Key facts
- 2 clubhouses
- Split floorplan
- 2 swimming pools
Tags
Property features AI
Finance
- Other: Furnished; Total building area and living area reported in public records
- Financial info: Lease restrictions apply
- HOA & community: Has HOA with optional annual fee ($5); Monthly HOA approximately $0.42; Association approval required; Association amenities include pool, fitness center, tennis and pickleball courts, shuffleboard, recreation facilities, private road, maintenance, management, and security; Senior community; Pets not allowed
Exterior
- Parking: Carport (1 space)
- Security: Gated community (association amenity)
- Utilities: Public water; Public sewer; Electricity connected; Cable available
- Home design: Residential mobile home (single wide); One story; Northeast facing; Completed condition
- Construction: Vinyl siding; Membrane roof; Crawlspace foundation; Built as single wide; Includes shed(s)
- Exterior features: Private mailbox; Paved lot
Interior
- Kitchen: Dishwasher; Microwave; Range; Refrigerator
- Bedrooms: 2 bedrooms
- Flooring: Laminate flooring; Vinyl flooring
- Bathrooms: 2 full bathrooms
- Heating & cooling: Central heating; Central air conditioning
- Interior features: Ceiling fans; Eat-in kitchen; Split bedroom layout; Crawl space
- Laundry & utility: Washer included; Laundry located outside
Neighborhood map
What this means for you Summary
Snapshot
- This is a 2-bed/2.0-bath manufactured listed at $64k.
Deal economics
- At list price, monthly cash flow is $793 ($10k/yr) — positive.
- The deal already cash-flows at list — no discount required.
- Meets the 1% rule at list price ($2k rent vs $64k).
- Recommended offer: $63k (1.5% below list) — sets the bar for market timing.
- Cap rate 21.2% vs local median 3.6% in North Port — top-decile yield for the area; either an underpriced asset or a hidden risk that comps aren't pricing in. Stress-test before assuming the spread holds.
Location & tenants
- Location reads 75/100 on livability (#252 in FL, #3,975 nationally) — a middle-class / working-renter tenant base. Strengths: crime A+, housing A+, health & safety A+; Watch: amenities F, commute F.
- Sarasota (urban): math 63% / reading 63% proficiency, ranked #7 of 73 in FL (top 10%) — acceptable for families but not a draw, mixed tenant base, ~2y average lease.
- Market conditions: Rents flat; 852 active listings in the ZIP; 7,466 units permitted in Sarasota County in 2024 (2,138 in 5+ unit buildings).
Forward outlook
- Local home prices are declining (-3.0%/yr); year-one equity from $442 of loan paydown is wiped out by about $2k of value loss. Plan a longer hold.
- Sarasota County population projected at +20% by 2050 — long-run rental-demand tailwind backs the buy-and-hold thesis.
- At projected returns (-3.0% appreciation + 0.3% rent growth), your $18k cash investment doubles in ~3 years — after that, you're playing with house money.
Negotiation context
- It's been on market 17 days — a 2% lower offer ($63k) is reasonable based on typical stale-listing flexibility.
- 2 sale attempts since 9y ago with the ask held roughly flat each time — persistent listings suggest the price (not the market) is what's stuck; bring a comps-based counter.
Risks & watch-outs
- Climate carrying-cost: major flood risk; severe wind risk, 99% chance of damaging wind over 30y; extreme-heat days projected 7→26/yr by 2055 (HVAC capex compounding) — expect insurance premiums to compound above CPI over the hold.
Questions for the listing agent
- Built in 1974 — when were the roof, HVAC, electrical panel, plumbing, and water heater last replaced?
- Is there a deadline driving the sale (1031 exchange, divorce, estate, relocation)? That informs how much negotiation room exists.
- Schools are B-rated — typically a magnet for longer-tenancy family renters. What's the average tenant stay here, and is there a school-zone premium baked into asking?
- What's the average days-on-market for RENTAL listings here right now (not sales)? A rising rental-DOM trend means longer vacancies and softer asking-rent achievability than the comps imply.
- What's the recent tenant-quality profile in this submarket — average credit score on applications, eviction rate, late-payment / NSF rate, and stable-employment percentage? A property-management company in the area should have these aggregated.
- How much new for-sale + rental construction is in the pipeline within 1–3 miles? Heavy new supply typically softens prices + rents 12–24 months out; constrained supply supports both.
Investment metrics
- 1% rule
- 2.45% ✓
- Cap rate
- 21.19%
- Cash-on-cash
- 53.20%
- DSCR
- 3.37
- GRM
- 3.4
CMA / ARV
No comps found within radius.
Projected returns pro-forma
-3.0% appreciation · 0.26% rent growth · sell at horizon
- IRR
- 48.1%
- Equity multiple
- 3.01×
- Total profit
- $35,998
- Equity at exit
- $9,528
- IRR
- 52.6%
- Equity multiple
- 5.48×
- Total profit
- $80,205
- Equity at exit
- $5,525
Cash invested: $17,892 (down + closing). Projections, not guarantees.
Landlord ↔ Tenant lean methodology
- Overall (STATE)
- 87 Strongly Landlord-Friendly
- State Florida
- 87 Strongly Landlord-Friendly · R+3
- County
- — inherits STATE
- City
- — inherits STATE
ZIP-level market 34287
- Home prices YoY
- -20.1%
- Rents YoY
- 0.3%
- Active inventory
- 852
- Price-to-rent
- 3.4×
Monthly cashflow live
- Estimated rent
- $1,563 medium interval (Pro) →
- Mortgage (P&I)
- −$335
- Tax est. 1.5%
- −$80 /mo · $958/yr
- Insurance
- −$27
- HOA
- −$0
- Vacancy / Maint / Mgmt
- −$328
- Net cashflow
- $793
Break-even live
Sensitivity live
| Price | -10% $837 | -5% $815 | +0% $793 | +5% $771 | +10% $749 |
|---|---|---|---|---|---|
| Rent | -10% $670 | -5% $732 | +0% $793 | +5% $855 | +10% $917 |
| Rate | -1.0pp $825 | -0.5pp $810 | base $793 | +0.5pp $777 | +1.0pp $760 |
UW: 25.0% down · 7.5% · 30yr · 1.5% tax · 5.0% vac · 8.0% maint · 8.0% mgmt
Financing live
Cash to close
- Down payment
- $15,975
- Closing costs
- $1,917
- Reserves months
- —
- Total cash needed
- —
Loan-product check · same deal, 3 products live
Conventional
25% down · 7.5% · 30yr
- Down + closing
- —
- Monthly P&I
- —
- Monthly cashflow
- —
- DSCR
- —
- Eligible?
- —
Personal DTI + credit; lowest rate.
DSCR
20% down · 8.5% · 30yr
- Down + closing
- —
- Monthly P&I
- —
- Monthly cashflow
- —
- DSCR
- —
- Eligible?
- —
No personal income docs; deal must DSCR.
Hard money
10% down · 12.0% · 12mo
- Down + closing
- —
- Monthly P&I
- —
- Monthly cashflow
- —
- DSCR
- —
- Eligible?
- —
Short-term bridge; refi at stabilization.
Listing history 14 events
-
2026-06-18days on market $63,900 Active 17 DOM
-
2026-06-17days on market $63,900 Active 16 DOM
-
2026-06-16days on market $63,900 Active 15 DOM
-
2026-06-15days on market $63,900 Active 14 DOM
-
2026-06-13days on market $63,900 Active 12 DOM
-
2026-06-13days on market $63,900 Active 11 DOM
-
2026-06-10days on market $63,900 Active 9 DOM
-
2026-06-09days on market $63,900 Active 8 DOM
-
2026-06-08days on market $63,900 Active 7 DOM
-
2026-06-08days on market $63,900 Active 6 DOM
-
2026-06-05days on market $63,900 Active 3 DOM
-
2026-06-03days on market $63,900 Active 2 DOM
-
2026-06-02remarks 699-char remark
-
2026-06-02$63,900 Active 1 DOM
ⓘ Source: listings_history table (triggers on properties + properties_extension) + one-shot
backfill from property_details.listing_events for pre-trigger history.
Climate risk First Street
- Flood 6/10 Major FEMA zone X (shaded) · 71% chance over 30 yrs
- Wildfire 1/10 Low
- Heat 10/10 Extreme 7 d/yr ≥108°F today · 26 d/yr by 30 yrs out
- Wind 10/10 Extreme 99% chance of damaging wind over 30 yrs
- Air quality 3/10 Moderate 2 unhealthy d/yr today · 3 by 30 yrs out
Nearby sold comps map
Loading sold comps map…
Walkable amenities ~0.75 mi
Loading nearby amenities…
Taxation est. · year 1
- Rental income
- $18,757
- − Mortgage interest
- −$3,579
- − Property taxes
- −$958
- − Insurance
- −$320
- − Repairs & maintenance
- −$1,501
- − Management
- −$1,501
- − Depreciation
- −$1,859
- Taxable income
- $9,040
- Est. tax owed @ 24.0%
- −$2,170
- After-tax cash flow
- $7,350/yr
For passive investors: Depreciation is non-cash, so a rental often shows a tax loss while cash-flowing — sheltering income. Rental losses are passive: they offset passive income freely, and up to $25,000/yr can offset ordinary (W-2) income if you actively participate and your MAGI is under $100k (phasing out to $0 by $150k); unused losses carry forward. On sale, claimed depreciation is recaptured at up to 25%, and gains may owe capital-gains tax (a 1031 exchange can defer both). Figures are a year-1 estimate at your 24.0% rate — not tax advice; consult a CPA.
Schools (NCES district)
- District
- Sarasota
- NCES district ID
- 1201680
- Math proficiency
- 63% ▼ -8.00%
- Reading proficiency
- 63% ▼ -3.00%
- Median HH income
- $51,167
- Composite
- 53.68/100
- National rank
- #1428
- State rank
- #7 of 73 in FL
Livability — North Port
- Score
- 75/100
- State rank
- #252
- US rank
- #3975
Category grades
Schools grade is shown separately in the Schools card above.
Census & demographics
- Census place
- North Port, FL
- County
- Sarasota County · 448,376 people
- City population
- 75,324
- Metro
- North Port-Sarasota-Bradenton, FL
- Population (ZIP)
- 25,929
- Household income
- $63,464
- Rent vs Own
- Severe rent burden
- 522.0
Population outlook (Sarasota County) Hauer SSP2
- Today (2025)
- 452,380 people
- By 2030
- 474,175 · +4.8%
- By 2040
- 511,577 · +13.1%
- By 2050
- 541,467 · +19.7%
- By 2075
- 604,947 · +33.7%
- By 2100
- 621,965 · +37.5%
Race, ethnicity, and origin ACS 2023
- Neighborhood character
- Predominantly White (77%)
- Race & ethnicity
- White 77% Hispanic / Latino 14% Two or more races 7% Asian 4% Black 3%
- Hispanic origin (detail)
- Mexican 2% Puerto Rican 3% Cuban 3% Dominican 1%
- Common ancestry
- Romanian 4% Scotch-Irish 3% Lithuanian 3%
- Foreign-born
- 16% · Canada, Philippines
- Languages at home
- 81% English-only · Spanish 8% Russian/Polish/Slavic 5% French/Haitian/Cajun 2%
Political lean MEDSL · Sarasota
- 2024 margin
- R (+18.2) · D 40.5% · R 58.7%
- 2008→2024 swing
- -18.1pp toward R · 2008: -0.1pp · 2024: -18.2pp
- All cycles
- 2024: R+18.2 2020: R+10.4 2016: R+11.6 2012: R+7.4 2008: R+0.1
Not yet ingested
- Civics
- —
Market trends
- HPI YoY
- ▼ -70.89%
- Current HPI
- 280.8484
- Rent YoY
- ▲ 0.26%
- Metro
- North Port-Sarasota-Bradenton, FL
- State GDP YoY
- ▲ 3.28%
- F500 in state
- 36
Industry mix (Fortune 500 HQ in FL)
| Industry | F500 HQs | Revenue |
|---|---|---|
| Industrial Technology | 2 | $29B |
|
||
| Insurance | 2 | $17B |
|
||
| Retail | 1 | $60B |
|
||
| Technology Distribution | 1 | $58B |
|
||
| Homebuilding | 1 | $35B |
|
||
| Technology Manufacturing | 1 | $35B |
|
||
Price history
+423.8% since first listed6 events — show timeline
- 2026-06-01 Listed $63,900 Stellar MLS as Distributed by MLS Grid
- 2018-02-19 Sold (MLS) $60,750 Stellar MLS as Distributed by MLS Grid
- 2018-02-14 Sold (Public Records) $60,800 Public Records
- 2018-01-21 Pending — Stellar MLS as Distributed by MLS Grid
- 2017-11-24 Listed $69,000 Stellar MLS as Distributed by MLS Grid
- 1974-04-01 Sold (Public Records) $12,200 Public Records
Property tax history
+5.4%/yrLatest (2025): $3,906 · +1.8% YoY. Source: county tax records.
Cash-flow waterfall
monthlySold comps — $/sqft
last 12 mo · ≤1 miLoading sold comps…