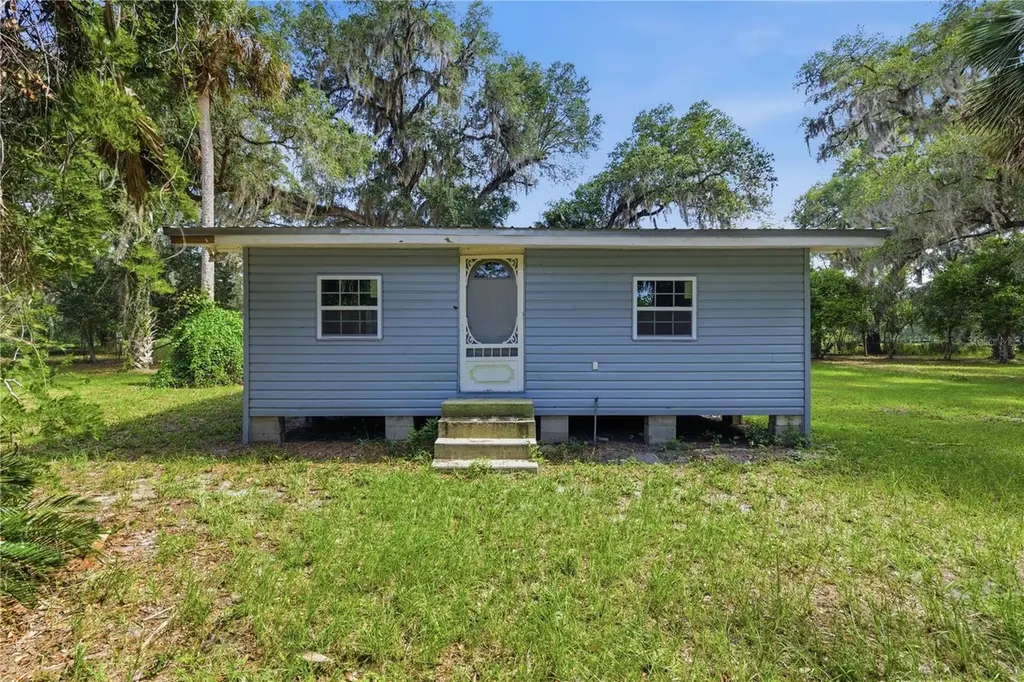
13122 E Highway 316 · Lake Kerr, FL
Flood risk 1/10 · Minimal
- FEMA flood zone
- X (unshaded)
- Chance of flooding over 30 yrs
- 0.0%
- Est. flood insurance / yr
- $507 – $1,088
Fire risk 7/10 · Major
- Est. fire insurance / yr
- $947 – $1,759
Heat risk 8/10 · Major
- Hot days now (above 109°F)
- 7 days/yr
- Hot days in 30 yrs
- 21 days/yr
Wind risk 9/10 · Severe
- Chance of severe wind over 30 yrs
- 99.0%
Air-quality risk 3/10 · Minor
- Unhealthy air days now
- 3 days/yr
- Unhealthy air days in 30 yrs
- 3 days/yr
Risk factors via First Street. Map © Google.
Why this score? — see what drove the C+ grade
The composite is a weighted blend of 9 inputs, each scored 0–100. Each bar is that input's sub-score; the figure is the points it added to the 100-point composite (weight × sub-score).
- Cash flow +28.7/30.0
- DSCR +10.0/10.0
- 1% rule +7.6/10.0
- ARV discount +7.5/15.0
- Schools +3.6/10.0
- Rent growth +2.5/5.0
- Livability +2.5/5.0
- Condition / age +2.5/5.0
- Appreciation +0.0/10.0
$95,000
🖨 Deal sheet 📄 Offer letter ✓ Due diligence
Listing remarks
Under contract-accepting backup offers. Quaint 832± sq. ft. home featuring 3 bedrooms and 2 bathrooms, tucked away on a peaceful 0.63± acre lot in Fort McCoy. This property is being offered as a CASH SALE ONLY, as a few minor items remain to be completed, including HVAC installation and limited kitchen plumbing work. Inside, you'll find an open kitchen and dining area, spacious carpeted bedrooms with built-in closets, and a functional layout. Exterior features include a 2020 installed metal roof, a fully fenced perimeter, multiple fruit trees, and beautiful mature oak trees that provide shade and privacy. With a little finishing work, this property offers excellent potential a
Key facts
- Metal roof
- Mature oak trees
- Dining area
Tags
Property features AI
Finance
- Other: Property zoned A1; Furnished: Partially; Universal property ID available
- Financial info: Tax year 2025 information available
- HOA & community: No association
Exterior
- Parking: No parking details provided
- Security: No security features listed
- Utilities: Well water; Septic tank; Broadband/high-speed internet available
- Home design: Single family residence; Residential property; One story; Faces north; Entry level: One
- Construction: Metal roof; Pillar/post/pier foundation; Approximately 0.63-acre lot (1/2 to less than 1 acre)
- Exterior features: Other exterior features; Cleared lot; Dirt road access
Interior
- Kitchen: No appliances listed
- Bedrooms: 2 bedrooms
- Flooring: Carpet; Linoleum
- Bathrooms: 1 full bathroom
- Heating & cooling: No heating; No cooling
- Interior features: Other interior features
- Laundry & utility: Laundry closet
Neighborhood map
What this means for you Summary
Snapshot
- This is a 2-bed/1.0-bath single-family listed at $95k.
Deal economics
- At list price, monthly cash flow is $318 ($4k/yr) — positive.
- The deal already cash-flows at list — no discount required.
- Meets the 1% rule at list price ($1k rent vs $95k).
- Cap rate 10.3% vs local median 5.8% in Lake Kerr — top-decile yield for the area; either an underpriced asset or a hidden risk that comps aren't pricing in. Stress-test before assuming the spread holds.
Location & tenants
- Location reads: area grade C — affects rentability + tenant quality, not the cash-flow math above.
- Marion (rural): math 42% / reading 43% proficiency, ranked #61 of 73 in FL (top 84%) — families likely to look elsewhere, expect single-tenant / working-renter base with shorter leases; 61% free/reduced lunch — lower-income household profile, screen leases tightly.
- Market conditions: 299 active listings in the ZIP; 1 comparable units currently listed for rent nearby; 7,071 units permitted in Marion County in 2024 (534 in 5+ unit buildings).
Forward outlook
- Local home prices are declining (-3.0%/yr); year-one equity from $657 of loan paydown is wiped out by about $3k of value loss. Plan a longer hold.
- Marion County population projected at +13% by 2050 — modest demand growth; plan on rents tracking national, not racing it.
- At projected returns (-3.0% appreciation + 3.0% rent growth), your $27k cash investment doubles in ~9 years — after that, you're playing with house money.
Negotiation context
- Only 14 days on market — expect competitive offers; lowballing is unlikely to land.
Risks & watch-outs
- Watch-outs: built in 1948 — expect roof / HVAC / electrical / plumbing capex.
- Climate carrying-cost: severe wind risk, 99% chance of damaging wind over 30y; major wildfire risk; extreme-heat days projected 7→21/yr by 2055 (HVAC capex compounding) — expect insurance premiums to compound above CPI over the hold.
Questions for the listing agent
- Built in 1948 — when were the roof, HVAC, electrical panel, plumbing, and water heater last replaced?
- Is there a deadline driving the sale (1031 exchange, divorce, estate, relocation)? That informs how much negotiation room exists.
- What's the average days-on-market for RENTAL listings here right now (not sales)? A rising rental-DOM trend means longer vacancies and softer asking-rent achievability than the comps imply.
- What's the recent tenant-quality profile in this submarket — average credit score on applications, eviction rate, late-payment / NSF rate, and stable-employment percentage? A property-management company in the area should have these aggregated.
- How much new for-sale + rental construction is in the pipeline within 1–3 miles? Heavy new supply typically softens prices + rents 12–24 months out; constrained supply supports both.
Investment metrics
- 1% rule
- 1.26% ✓
- Cap rate
- 10.30%
- Cash-on-cash
- 14.33%
- DSCR
- 1.64
- GRM
- 6.6
CMA / ARV
No comps found within radius.
Projected returns pro-forma
-3.0% appreciation · 3.0% rent growth · sell at horizon
- IRR
- 4.7%
- Equity multiple
- 1.18×
- Total profit
- $4,834
- Equity at exit
- $14,165
- IRR
- 14.2%
- Equity multiple
- 2.14×
- Total profit
- $30,263
- Equity at exit
- $8,214
Cash invested: $26,600 (down + closing). Projections, not guarantees.
Landlord ↔ Tenant lean methodology
- Overall (STATE)
- 87 Strongly Landlord-Friendly
- State Florida
- 87 Strongly Landlord-Friendly · R+3
- County
- — inherits STATE
- City
- — inherits STATE
ZIP-level market 32134
- Home prices YoY
- -24.4%
- Active inventory
- 299
- Price-to-rent
- 6.6×
Monthly cashflow live
- Estimated rent
- $1,200 medium interval (Pro) →
- Mortgage (P&I)
- −$498
- Tax from tax record
- −$93 /mo · $1,112/yr
- Insurance
- −$40
- HOA
- −$0
- Vacancy / Maint / Mgmt
- −$252
- Net cashflow
- $318
Break-even live
UW: 25.0% down · 7.5% · 30yr · 1.5% tax · 5.0% vac · 8.0% maint · 8.0% mgmt
Financing live
Cash to close
- Down payment
- $23,750
- Closing costs
- $2,850
- Reserves months
- —
- Total cash needed
- —
Loan-product check · same deal, 3 products live
Conventional
25% down · 7.5% · 30yr
- Down + closing
- —
- Monthly P&I
- —
- Monthly cashflow
- —
- DSCR
- —
- Eligible?
- —
Personal DTI + credit; lowest rate.
DSCR
20% down · 8.5% · 30yr
- Down + closing
- —
- Monthly P&I
- —
- Monthly cashflow
- —
- DSCR
- —
- Eligible?
- —
No personal income docs; deal must DSCR.
Hard money
10% down · 12.0% · 12mo
- Down + closing
- —
- Monthly P&I
- —
- Monthly cashflow
- —
- DSCR
- —
- Eligible?
- —
Short-term bridge; refi at stabilization.
Rent comps 1 comps
| Address | Beds | Baths | Sqft | Rent | $/sqft | DOM | Units | Dist |
|---|---|---|---|---|---|---|---|---|
| 16323 NE 137th Ter Fort Mc Coy, FL | 2.0 | 2.0 | 784 | $1,200 | $1.53 | 12d | 1 | 1.47mi |
Listing history 11 events
-
2026-06-15status $95,000 Pending 14 DOM
-
2026-06-15days on market $95,000 Active 14 DOM
-
2026-06-14days on market $95,000 Active 12 DOM
-
2026-06-13days on market $95,000 Active 11 DOM
-
2026-06-10days on market $95,000 Active 9 DOM
-
2026-06-09days on market $95,000 Active 8 DOM
-
2026-06-08days on market $95,000 Active 7 DOM
-
2026-06-07days on market $95,000 Active 6 DOM
-
2026-06-03days on market $95,000 Active 2 DOM
-
2026-06-01remarks 685-char remark
-
2026-06-01$95,000 Active 1 DOM
ⓘ Source: listings_history table (triggers on properties + properties_extension) + one-shot
backfill from property_details.listing_events for pre-trigger history.
Tax reassessment forecast FL · Resets to sale price
- Current annual tax
- $1,112 · $93/mo
- Projected year-2 tax
- $1,112 · $93/mo
- Expected delta
- $0/yr ($0/mo · 0.0%)
ⓘ Screening estimate from a state-policy table — verify with the county assessor before closing.
Climate risk First Street
- Flood 1/10 Low FEMA zone X (unshaded) · 0% chance over 30 yrs
- Wildfire 7/10 Severe
- Heat 8/10 Severe 7 d/yr ≥109°F today · 21 d/yr by 30 yrs out
- Wind 9/10 Extreme 99% chance of damaging wind over 30 yrs
- Air quality 3/10 Moderate 3 unhealthy d/yr today · 3 by 30 yrs out
Nearby sold comps map
Loading sold comps map…
Walkable amenities ~0.75 mi
Loading nearby amenities…
Taxation est. · year 1
- Rental income
- $14,400
- − Mortgage interest
- −$5,321
- − Property taxes
- −$1,112
- − Insurance
- −$475
- − Repairs & maintenance
- −$1,152
- − Management
- −$1,152
- − Depreciation
- −$2,764
- Taxable income
- $2,424
- Est. tax owed @ 24.0%
- −$582
- After-tax cash flow
- $3,229/yr
For passive investors: Depreciation is non-cash, so a rental often shows a tax loss while cash-flowing — sheltering income. Rental losses are passive: they offset passive income freely, and up to $25,000/yr can offset ordinary (W-2) income if you actively participate and your MAGI is under $100k (phasing out to $0 by $150k); unused losses carry forward. On sale, claimed depreciation is recaptured at up to 25%, and gains may owe capital-gains tax (a 1031 exchange can defer both). Figures are a year-1 estimate at your 24.0% rate — not tax advice; consult a CPA.
Schools (NCES district)
- District
- Marion
- NCES district ID
- 1201260
- Math proficiency
- 42% ▼ -7.00%
- Reading proficiency
- 43% ▼ -4.00%
- Median HH income
- $40,015
- Composite
- 35.61/100
- National rank
- #4890
- State rank
- #61 of 73 in FL
Livability — Lake Kerr
No livability data for this city. (Only ~50 U.S. cities are tracked.)
Census & demographics
- Population (ZIP)
- 7,400
Population outlook (Marion County) Hauer SSP2
- Today (2025)
- 365,905 people
- By 2030
- 376,768 · +3.0%
- By 2040
- 396,555 · +8.4%
- By 2050
- 412,723 · +12.8%
- By 2075
- 446,090 · +21.9%
- By 2100
- 436,193 · +19.2%
Race, ethnicity, and origin ACS 2023
- Neighborhood character
- Predominantly White (91%)
- Race & ethnicity
- White 91% Hispanic / Latino 5% Two or more races 4%
- Common ancestry
- Italian 3% Slovak 2% Lithuanian 2%
- Foreign-born
- 3% · Canada
- Languages at home
- 95% English-only · Spanish 3% French/Haitian/Cajun 1%
Political lean MEDSL · Marion
- 2024 margin
- Solid R (+31.6) · D 33.8% · R 65.5%
- 2008→2024 swing
- -20.0pp toward R · 2008: -11.6pp · 2024: -31.6pp
- All cycles
- 2024: R+31.6 2020: R+25.9 2016: R+26.2 2012: R+16.2 2008: R+11.6
Not yet ingested
- Civics
- —
Market trends
- HPI YoY
- ▼ -72.45%
- Current HPI
- 224.9549
- Rent YoY
- —
- Metro
- —
- State GDP YoY
- ▲ 3.28%
- F500 in state
- 36
Industry mix (Fortune 500 HQ in FL)
| Industry | F500 HQs | Revenue |
|---|---|---|
| Industrial Technology | 2 | $29B |
|
||
| Insurance | 2 | $17B |
|
||
| Retail | 1 | $60B |
|
||
| Technology Distribution | 1 | $58B |
|
||
| Homebuilding | 1 | $35B |
|
||
| Technology Manufacturing | 1 | $35B |
|
||
Price history
1 event — show timeline
- 2026-06-01 Listed $95,000 Stellar MLS as Distributed by MLS Grid
Property tax history
+7.5%/yrLatest (2025): $1,112 · +16.5% YoY. Source: county tax records.
Cash-flow waterfall
monthlySold comps — $/sqft
last 12 mo · ≤1 miLoading sold comps…