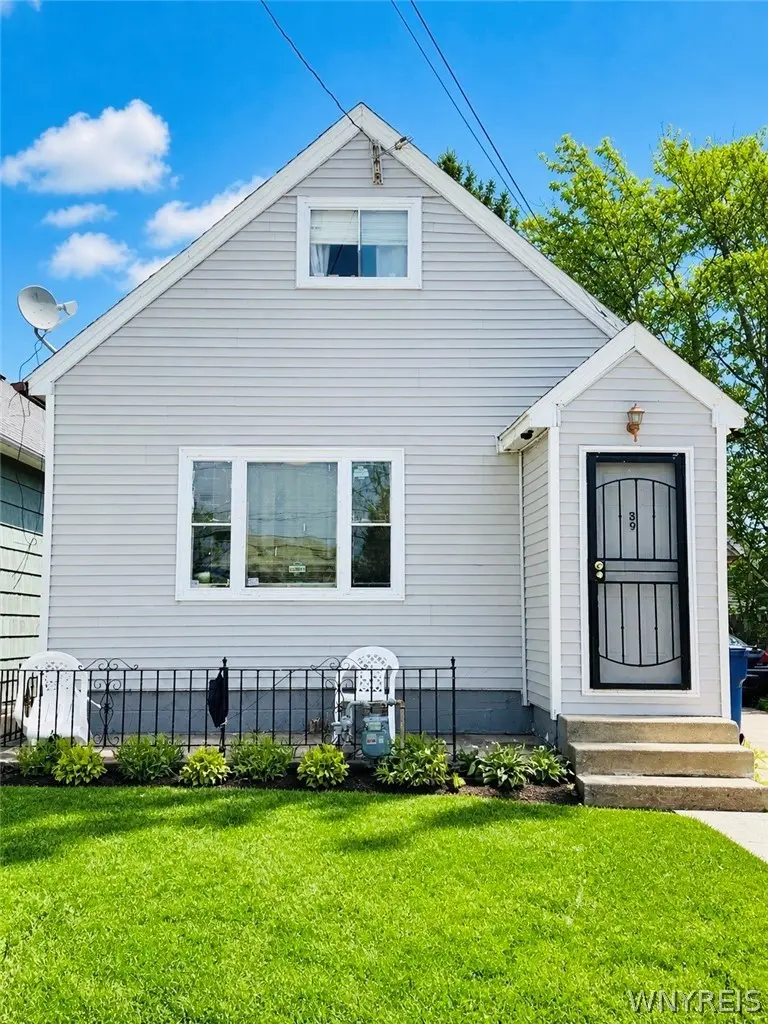
39 Koons Ave · Buffalo, NY
Flood risk 1/10 · Minimal
- FEMA flood zone
- X (unshaded)
- Chance of flooding over 30 yrs
- 0.0%
- Est. flood insurance / yr
- $507 – $1,088
Fire risk 1/10 · Minimal
- Est. fire insurance / yr
- $691 – $1,283
Heat risk 2/10 · Minimal
- Hot days now (above 92°F)
- 7 days/yr
- Hot days in 30 yrs
- 14 days/yr
Wind risk 1/10 · Minimal
- Chance of severe wind over 30 yrs
- —
Air-quality risk 3/10 · Minor
- Unhealthy air days now
- 2 days/yr
- Unhealthy air days in 30 yrs
- 3 days/yr
Risk factors via First Street. Map © Google.
Why this score? — see what drove the C grade
The composite is a weighted blend of 9 inputs, each scored 0–100. Each bar is that input's sub-score; the figure is the points it added to the 100-point composite (weight × sub-score).
- Cash flow +21.2/30.0
- Appreciation +10.0/10.0
- DSCR +6.8/10.0
- 1% rule +5.6/10.0
- Livability +3.9/5.0
- Schools +3.3/10.0
- Rent growth +2.5/5.0
- Condition / age +2.5/5.0
- ARV discount +0.0/15.0
$124,900
🖨 Deal sheet 📄 Offer letter ✓ Due diligence
Listing remarks MLS
Back on the market ! Availabile for showing on Thurs, Sept 1 at 4pm. Property has a new roof and new high efficiency furnace. Could be turned into a 3 bedroom property with a little TLC,
Key facts
- Solid bones
- Formal dining room
- Large living room
Tags
Property features AI
Exterior
- Parking: No garage; Shared driveway
- Utilities: Public water connected; Sewer connected
- Home design: Single-story home; Existing/resale property
- Construction: Frame construction; Crawl space foundation
- Exterior features: Concrete driveway; Rectangular lot (approx. 30 x 94)
Interior
- Bedrooms: 2 main-level bedrooms
- Bathrooms: 1 full bathroom (on main level)
- Heating & cooling: Electric and gas forced-air heating
- Interior features: Separate/formal living room; Additional interior features noted in remarks
Neighborhood map
What this means for you Summary
Snapshot
- This is a 2-bed/1.0-bath single-family listed at $125k.
Deal economics
- At list price, monthly cash flow is $181 ($2k/yr) — positive.
- The deal already cash-flows at list — no discount required.
- Meets the 1% rule at list price ($1k rent vs $125k).
- Recommended offer: $121k (3.0% below list) — sets the bar for market timing.
Location & tenants
- Location reads 77/100 on livability (#195 in NY, #3,011 nationally) — a middle-class / working-renter tenant base. Strengths: commute A+, housing A+, health & safety A+; Watch: crime F, employment D-.
- Buffalo City School District (urban): math 41% / reading 40% proficiency, ranked #535 of 590 in NY (top 91%) — families likely to look elsewhere, expect single-tenant / working-renter base with shorter leases; 75% free/reduced lunch — lower-income household profile, screen leases tightly.
- Market conditions: 83 active listings in the ZIP; 6 comparable units currently listed for rent nearby; rentals at typical pace (median 24d on market — plan ~3-4 weeks tenant-placement turnaround); 1,244 units permitted in Erie County in 2024 (563 in 5+ unit buildings).
Forward outlook
- In year one you build about $13k of equity ($864 loan paydown + $12k appreciation (10.0% local appreciation)).
- At projected returns (10.0% appreciation + 3.0% rent growth), your $35k cash investment doubles in ~3 years — after that, you're playing with house money.
- By year 3, paydown + projected appreciation supports a ~$34k cash-out refi (75% LTV) — recoverable capital for the next deal without selling this one.
Negotiation context
- It's been on market 45 days — a 3% lower offer ($121k) is reasonable based on typical stale-listing flexibility.
- 4 sale attempts since 17y ago; this cycle's ask has dropped $10k (7%) from the opening price — seller is motivated, your offer sets the floor, not the list.
- Current owner paid $15k; list at $125k implies a 733% gain — meaningful room to come down on a strong offer.
Risks & watch-outs
- Watch-outs: built in 1900 — expect roof / HVAC / electrical / plumbing capex.
Questions for the listing agent
- It's been on market 45 days. Have you received any prior offers? Is the seller open to a 3% concession, seller financing, or rate buy-down credit?
- Built in 1900 — when were the roof, HVAC, electrical panel, plumbing, and water heater last replaced?
- Is there a deadline driving the sale (1031 exchange, divorce, estate, relocation)? That informs how much negotiation room exists.
- Crime grade is F in this area — have there been break-ins, vandalism, or insurance claims at this property in the last 3 years? What carrier currently insures it and at what premium?
- What's the average days-on-market for RENTAL listings here right now (not sales)? A rising rental-DOM trend means longer vacancies and softer asking-rent achievability than the comps imply.
- What's the recent tenant-quality profile in this submarket — average credit score on applications, eviction rate, late-payment / NSF rate, and stable-employment percentage? A property-management company in the area should have these aggregated.
- How much new for-sale + rental construction is in the pipeline within 1–3 miles? Heavy new supply typically softens prices + rents 12–24 months out; constrained supply supports both.
Investment metrics
- 1% rule
- 1.06% ✓
- Cap rate
- 8.03%
- Cash-on-cash
- 6.22%
- DSCR
- 1.28
- GRM
- 7.9
CMA / ARV
- ARV (median comp)
- $87,700
- List price
- $124,900
- Delta
- 42.42%
- Verdict
- OVERPRICED
- Comps
- 20 within 1.0 mi
Show comp detail 12 sales within ~0.75 mi
| Address | Dist | Beds/Ba | Sqft | Sold | Price | $/sf | Match |
|---|---|---|---|---|---|---|---|
| 7 Krupp Ave | 0.42mi | 2/1.0 | 1,320 (+4%) | 1mo | $50,000 | $38 | 73 |
| 89 Goodyear Ave | 0.10mi | 3/1.0 (+1) | 1,360 (+7%) | 15mo | $60,000 | $44 | 66 |
| 48 Deshler St | 0.19mi | 3/1.0 (+1) | 1,358 (+7%) | 13mo | $76,500 | $56 | 64 |
| 38 N Central Ave Unit W | 0.28mi | 3/1.0 (+1) | 1,386 (+9%) | 10mo | $110,000 | $79 | 59 |
| 402 Benzinger St | 0.73mi | 2/1.0 | 1,269 (-0%) | 9mo | $125,500 | $99 | 58 |
| 99 Quincy St | 0.18mi | 3/1.0 (+1) | 1,429 (+12%) | 16mo | $93,000 | $65 | 53 |
| 391 Greene St | 0.59mi | 3/1.0 (+1) | 1,144 (-10%) | 2mo | $200,000 | $175 | 49 |
| 160 Brinkman Ave | 0.71mi | 3/2.0 (+1) | 1,253 (-1%) | 12mo | $145,000 | $116 | 46 |
| 77 King St | 0.71mi | 2/1.0 | 1,351 (+6%) | 16mo | $116,600 | $86 | 43 |
| 105 Regent St | 0.68mi | 3/2.0 (+1) | 1,138 (-10%) | 6mo | $110,000 | $97 | 37 |
| 313 Ideal St | 0.74mi | 3/1.0 (+1) | 1,386 (+9%) | 17mo | $180,000 | $130 | 31 |
| 29 Bogardus St | 0.71mi | 3/1.0 (+1) | 1,092 (-14%) | 10mo | $150,000 | $137 | 30 |
Match score weights: distance 35% · size 25% · config 20% · recency 20%. Top-matched comps best support the ARV.
Projected returns pro-forma
10.0% appreciation · 3.0% rent growth · sell at horizon
- IRR
- 28.8%
- Equity multiple
- 3.28×
- Total profit
- $79,589
- Equity at exit
- $112,520
- IRR
- 25.0%
- Equity multiple
- 7.44×
- Total profit
- $225,337
- Equity at exit
- $242,653
Cash invested: $34,972 (down + closing). Projections, not guarantees.
Landlord ↔ Tenant lean methodology
- Overall (STATE)
- 15 Strongly Tenant-Friendly
- State New York
- 15 Strongly Tenant-Friendly · D+10
- County
- — inherits STATE
- City
- — inherits STATE
ZIP-level market 14212
- Home prices YoY
- 20.4%
- Active inventory
- 83
- Price-to-rent
- 7.9×
Monthly cashflow live
- Estimated rent
- $1,322 high interval (Pro) →
- Mortgage (P&I)
- −$655
- Tax est. 1.5%
- −$156 /mo · $1,874/yr
- Insurance
- −$52
- HOA
- −$0
- Vacancy / Maint / Mgmt
- −$278
- Net cashflow
- $181
Break-even live
UW: 25.0% down · 7.5% · 30yr · 1.5% tax · 5.0% vac · 8.0% maint · 8.0% mgmt
Financing live
Cash to close
- Down payment
- $31,225
- Closing costs
- $3,747
- Reserves months
- —
- Total cash needed
- —
Loan-product check · same deal, 3 products live
Conventional
25% down · 7.5% · 30yr
- Down + closing
- —
- Monthly P&I
- —
- Monthly cashflow
- —
- DSCR
- —
- Eligible?
- —
Personal DTI + credit; lowest rate.
DSCR
20% down · 8.5% · 30yr
- Down + closing
- —
- Monthly P&I
- —
- Monthly cashflow
- —
- DSCR
- —
- Eligible?
- —
No personal income docs; deal must DSCR.
Hard money
10% down · 12.0% · 12mo
- Down + closing
- —
- Monthly P&I
- —
- Monthly cashflow
- —
- DSCR
- —
- Eligible?
- —
Short-term bridge; refi at stabilization.
Rent comps 6 comps
| Address | Beds | Baths | Sqft | Rent | $/sqft | DOM | Units | Dist |
|---|---|---|---|---|---|---|---|---|
| 1777 Broadway Unit 2 Buffalo, NY | 3.0 | 1.0 | 1300 | $1,200 | $0.92 | 43d | 1 | 0.61mi |
| 517 Goodyear Ave Buffalo, NY | 3.0 | 1.0 | 1559 | $1,800 | $1.15 | 19d | 1 | 0.92mi |
| 67 Moeller St Unit UPPER Buffalo, NY | 3.0 | 1.0 | 960 | $1,000 | $1.04 | 3d | 1 | 1.05mi |
| 67 Moeller St Unit LOWER Buffalo, NY | 3.0 | 1.0 | 960 | $1,200 | $1.25 | 23d | 1 | 1.05mi |
| 24 Euclid Ave Buffalo, NY | 3.0 | 2.0 | 1150 | $1,700 | $1.48 | 43d | 1 | 1.40mi |
| 408 Winslow Ave Unit 2 Buffalo, NY | 3.0 | 1.0 | 1000 | $1,050 | $1.05 | 14d | 1 | 1.41mi |
Listing history 26 events
-
2026-06-18days on market $124,900 Active 45 DOM
-
2026-06-17days on market $124,900 Active 44 DOM
-
2026-06-16days on market $124,900 Active 43 DOM
-
2026-06-15days on market $124,900 Active 42 DOM
-
2026-06-13days on market $124,900 Active 40 DOM
-
2026-06-13days on market $124,900 Active 39 DOM
-
2026-06-10pricedays on market $124,900 Active 37 DOM
-
2026-06-09days on market $134,900 Active 36 DOM
-
2026-06-08days on market $134,900 Active 35 DOM
-
2026-06-07days on market $134,900 Active 34 DOM
-
2026-06-03days on market $134,900 Active 30 DOM
-
2026-06-02days on market $134,900 Active 29 DOM
-
2026-06-01days on market $134,900 Active 28 DOM
-
2026-05-31days on market $134,900 Active 27 DOM
-
2026-05-04$134,900 Active 655-char remark
-
2018-04-24soldstatus $15,000
-
2016-11-03soldstatus $12,000 Closed Sale or Rented 186-char remark
Show marketing remark (186 chars)
Back on the market ! Availabile for showing on Thurs, Sept 1 at 4pm. Property has a new roof and new high efficiency furnace. Could be turned into a 3 bedroom property with a little TLC,
-
2016-09-08status Pending Sale 186-char remark
Show marketing remark (186 chars)
Back on the market ! Availabile for showing on Thurs, Sept 1 at 4pm. Property has a new roof and new high efficiency furnace. Could be turned into a 3 bedroom property with a little TLC,
-
2016-08-29status Active 186-char remark
Show marketing remark (186 chars)
Back on the market ! Availabile for showing on Thurs, Sept 1 at 4pm. Property has a new roof and new high efficiency furnace. Could be turned into a 3 bedroom property with a little TLC,
-
2016-08-12historical 186-char remark
Show marketing remark (186 chars)
Back on the market ! Availabile for showing on Thurs, Sept 1 at 4pm. Property has a new roof and new high efficiency furnace. Could be turned into a 3 bedroom property with a little TLC,
-
2016-08-09$12,000 Active 186-char remark
Show marketing remark (186 chars)
Back on the market ! Availabile for showing on Thurs, Sept 1 at 4pm. Property has a new roof and new high efficiency furnace. Could be turned into a 3 bedroom property with a little TLC,
-
2010-04-26soldstatus $3,500
Show marketing remark (142 chars)
MOVE INTO THIS CUTE 2 BEDROOM AND ONE BATHROOM CAPE COD WITH A FENCED YARD AND TWO SHEDS. THERE IS A CONCRETE DRIVEWAY FOR OFF STREET PARKING.
-
2009-12-15$3,316
Show marketing remark (142 chars)
MOVE INTO THIS CUTE 2 BEDROOM AND ONE BATHROOM CAPE COD WITH A FENCED YARD AND TWO SHEDS. THERE IS A CONCRETE DRIVEWAY FOR OFF STREET PARKING.
-
2000-08-22soldstatus $14,500
-
1994-03-08soldstatus $32,500
-
1994-02-16soldstatus $17,000
ⓘ Source: listings_history table (triggers on properties + properties_extension) + one-shot
backfill from property_details.listing_events for pre-trigger history.
Climate risk First Street
- Flood 1/10 Low FEMA zone X (unshaded) · 0% chance over 30 yrs
- Wildfire 1/10 Low
- Heat 2/10 Low 7 d/yr ≥92°F today · 14 d/yr by 30 yrs out
- Wind 1/10 Low
- Air quality 3/10 Moderate 2 unhealthy d/yr today · 3 by 30 yrs out
Nearby sold comps map
Loading sold comps map…
Walkable amenities ~0.75 mi
Loading nearby amenities…
Taxation est. · year 1
- Rental income
- $15,865
- − Mortgage interest
- −$6,996
- − Property taxes
- −$1,874
- − Insurance
- −$624
- − Repairs & maintenance
- −$1,269
- − Management
- −$1,269
- − Depreciation
- −$3,633
- Taxable income
- $199
- Est. tax owed @ 24.0%
- −$48
- After-tax cash flow
- $2,128/yr
For passive investors: Depreciation is non-cash, so a rental often shows a tax loss while cash-flowing — sheltering income. Rental losses are passive: they offset passive income freely, and up to $25,000/yr can offset ordinary (W-2) income if you actively participate and your MAGI is under $100k (phasing out to $0 by $150k); unused losses carry forward. On sale, claimed depreciation is recaptured at up to 25%, and gains may owe capital-gains tax (a 1031 exchange can defer both). Figures are a year-1 estimate at your 24.0% rate — not tax advice; consult a CPA.
Schools (NCES district)
- District
- Buffalo City School District
- NCES district ID
- 3605850
- Math proficiency
- 41% ▲ 11.00%
- Reading proficiency
- 40% ▲ 7.00%
- Median HH income
- $31,665
- Composite
- 33.17/100
- National rank
- #5544
- State rank
- #535 of 590 in NY
Livability — Buffalo
- Score
- 77/100
- State rank
- #195
- US rank
- #3011
Category grades
Schools grade is shown separately in the Schools card above.
Census & demographics
- Census place
- Buffalo, NY
- City population
- 440,021
- Population (ZIP)
- 13,603
Population outlook (Erie County) Hauer SSP2
- Today (2025)
- 933,037 people
- By 2030
- 935,181 · +0.2%
- By 2040
- 928,531 · -0.5%
- By 2050
- 905,725 · -2.9%
- By 2075
- 834,037 · -10.6%
- By 2100
- 708,033 · -24.1%
Race, ethnicity, and origin ACS 2023
- Neighborhood character
- Highly diverse neighborhood (Simpson 0.75)
- Race & ethnicity
- White 32% Black 27% Asian 25% Hispanic / Latino 9% Two or more races 8%
- Hispanic origin (detail)
- Puerto Rican 8%
- Common ancestry
- Romanian 12% Serbian 1% Lithuanian 1%
- Foreign-born
- 20% · Philippines, Canada, China
- Languages at home
- 68% English-only · Other Indo-European 18% Spanish 4% Other Asian/Pacific 2%
Political lean MEDSL · Erie
- 2024 margin
- Lean D (+9.7) · D 54.8% · R 45.2%
- 2008→2024 swing
- -7.9pp toward R · 2008: 17.5pp · 2024: 9.7pp
- All cycles
- 2024: D+9.7 2020: D+14.7 2016: D+4.8 2012: D+15.6 2008: D+17.5
Not yet ingested
- Civics
- —
Market trends
- HPI YoY
- ▲ 79.80%
- Current HPI
- 471.6399
- Rent YoY
- —
- Metro
- —
- State GDP YoY
- ▲ 2.60%
- F500 in state
- 92
Industry mix (Fortune 500 HQ in NY)
| Industry | F500 HQs | Revenue |
|---|---|---|
| Financial Services | 10 | $950B |
|
||
| Consumer Goods | 9 | $162B |
|
||
| Insurance | 4 | $225B |
|
||
| Telecommunications | 2 | $144B |
|
||
| Pharmaceuticals | 2 | $112B |
|
||
| Media / Entertainment | 2 | $69B |
|
||
Price history
+634.7% since first listed13 events — show timeline
- 2026-06-10 Price Changed $124,900 WNYREIS
- 2026-05-04 Listed $134,900 WNYREIS
- 2018-04-24 Sold (Public Records) $15,000 Public Records
- 2016-11-03 Sold (MLS) $12,000 WNYREIS
- 2016-09-08 Pending — WNYREIS
- 2016-08-29 Relisted — WNYREIS
- 2016-08-12 Listing Removed — WNYREIS
- 2016-08-09 Listed $12,000 WNYREIS
- 2010-04-26 Sold (MLS) $3,500 WNYREIS
- 2009-12-15 Listed $3,316 WNYREIS
- 2000-08-22 Sold (Public Records) $14,500 Public Records
- 1994-03-08 Sold (Public Records) $32,500 Public Records
- 1994-02-16 Sold (Public Records) $17,000 Public Records
Property tax history
+7.0%/yrLatest (2025): $198 · +171.9% YoY. Source: county tax records.
Cash-flow waterfall
monthlySold comps — $/sqft
last 12 mo · ≤1 miLoading sold comps…