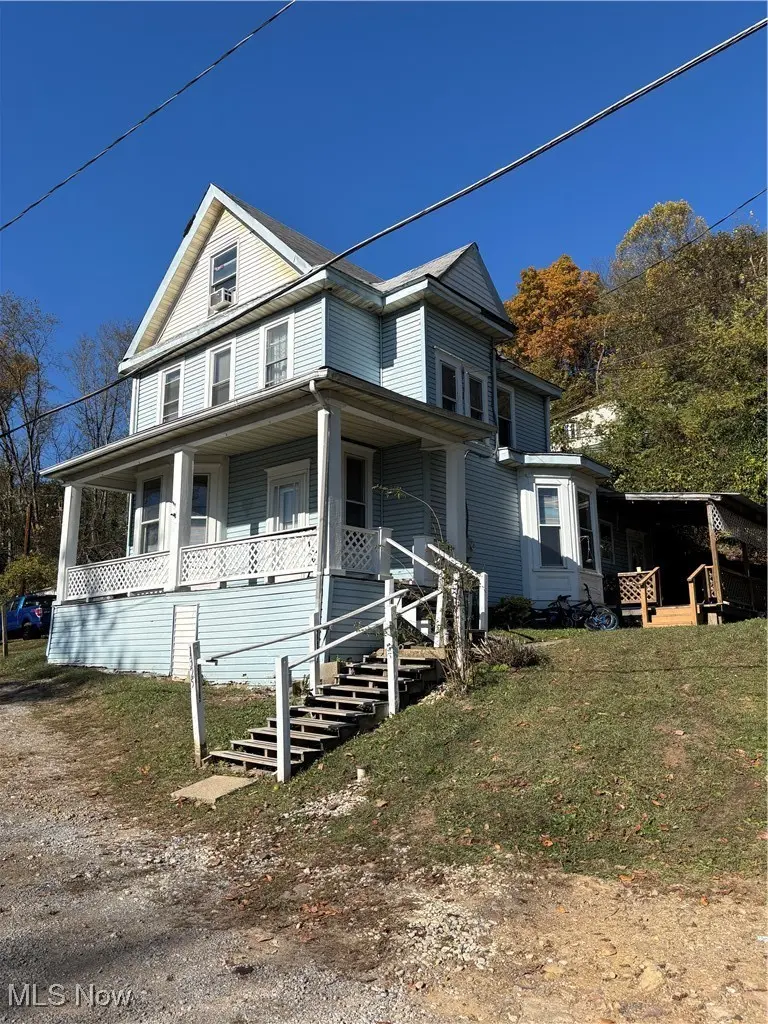
1325 Boyce Ave · Wellsville, OH
Flood risk 1/10 · Minimal
- FEMA flood zone
- X (unshaded)
- Chance of flooding over 30 yrs
- 0.0%
- Est. flood insurance / yr
- $473 – $860
Fire risk 2/10 · Minimal
- Est. fire insurance / yr
- $713 – $1,323
Heat risk 3/10 · Minor
- Hot days now (above 98°F)
- 7 days/yr
- Hot days in 30 yrs
- 18 days/yr
Wind risk 1/10 · Minimal
- Chance of severe wind over 30 yrs
- —
Air-quality risk 3/10 · Minor
- Unhealthy air days now
- 2 days/yr
- Unhealthy air days in 30 yrs
- 3 days/yr
Risk factors via First Street. Map © Google.
Why this score? — see what drove the B grade
The composite is a weighted blend of 9 inputs, each scored 0–100. Each bar is that input's sub-score; the figure is the points it added to the 100-point composite (weight × sub-score).
- Cash flow +30.0/30.0
- 1% rule +10.0/10.0
- DSCR +10.0/10.0
- Appreciation +5.9/10.0
- Livability +3.5/5.0
- Schools +3.3/10.0
- ARV discount +2.7/15.0
- Rent growth +2.5/5.0
- Condition / age +2.5/5.0
$74,500
🖨 Deal sheet 📄 Offer letter ✓ Due diligence
Listing remarks MLS
This house features 3 large bedrooms, living room, dining room and large kitchen. Laundry is featured on the 2nd floor for easy bedroom access. Enjoy the river view as you relax on the front porch.
Key facts
- River view
- Front porch
- 7,840 sq ft lot
Tags
Neighborhood map
What this means for you Summary
Snapshot
- This is a 3-bed/1.0-bath single-family listed at $74k.
Deal economics
- At list price, monthly cash flow is $403 ($5k/yr) — positive.
- The deal already cash-flows at list — no discount required.
- Meets the 1% rule at list price ($1k rent vs $74k).
- Recommended offer: $66k (12.0% below list) — sets the bar for market timing.
Location & tenants
- Location reads 69/100 on livability (#505 in OH) — a middle-class / working-renter tenant base. Strengths: cost of living A+, housing A+, crime A-; Watch: health & safety C-, amenities F, commute F.
- Wellsville Local (town): math 34% / reading 46% proficiency, ranked #546 of 656 in OH (top 83%) — families likely to look elsewhere, expect single-tenant / working-renter base with shorter leases.
- Market conditions: 20 active listings in the ZIP; 49 units permitted in Columbiana County in 2024 (0 in 5+ unit buildings).
Forward outlook
- In year one you build about $2k of equity ($515 loan paydown + $1k appreciation (1.8% local appreciation)).
- Columbiana County population projected at -23% by 2050 — secular population decline; favor cash flow + early exit over multi-decade hold.
- At projected returns (1.8% appreciation + 3.0% rent growth), your $21k cash investment doubles in ~3 years — after that, you're playing with house money.
Negotiation context
- It's been on market 210 days — a 12% lower offer ($66k) is reasonable based on typical stale-listing flexibility.
- 2 sale attempts since 3y ago with the ask held roughly flat each time — persistent listings suggest the price (not the market) is what's stuck; bring a comps-based counter.
Risks & watch-outs
- Watch-outs: built in 1930 — expect roof / HVAC / electrical / plumbing capex.
Questions for the listing agent
- It's been on market 210 days. Have you received any prior offers? Is the seller open to a 12% concession, seller financing, or rate buy-down credit?
- Built in 1930 — when were the roof, HVAC, electrical panel, plumbing, and water heater last replaced?
- Why hasn't it sold? Are there any deal-killer items the seller is aware of (foundation, flood, title, zoning, code violations)?
- Is there a deadline driving the sale (1031 exchange, divorce, estate, relocation)? That informs how much negotiation room exists.
- What's the average days-on-market for RENTAL listings here right now (not sales)? A rising rental-DOM trend means longer vacancies and softer asking-rent achievability than the comps imply.
- What's the recent tenant-quality profile in this submarket — average credit score on applications, eviction rate, late-payment / NSF rate, and stable-employment percentage? A property-management company in the area should have these aggregated.
- How much new for-sale + rental construction is in the pipeline within 1–3 miles? Heavy new supply typically softens prices + rents 12–24 months out; constrained supply supports both.
Investment metrics
- 1% rule
- 1.56% ✓
- Cap rate
- 12.78%
- Cash-on-cash
- 23.19%
- DSCR
- 2.03
- GRM
- 5.3
CMA / ARV
- ARV (median comp)
- $67,278
- List price
- $74,500
- Delta
- 10.73%
- Verdict
- OVERPRICED
- Comps
- 20 within 1.0 mi
Show comp detail 9 sales within ~0.75 mi
| Address | Dist | Beds/Ba | Sqft | Sold | Price | $/sf | Match |
|---|---|---|---|---|---|---|---|
| 1505 Commerce St | 0.28mi | 3/1.0 | 1,428 (-2%) | 16mo | $29,000 | $20 | 70 |
| 1728 Maple Ave | 0.35mi | 3/1.0 | 1,390 (-4%) | 14mo | $99,900 | $72 | 65 |
| 408 15 St | 0.23mi | 2/2.0 (-1) | 1,280 (-12%) | 3mo | $66,000 | $52 | 58 |
| 1230 Florence Dr | 0.39mi | 3/1.5 | 1,259 (-14%) | 1mo | $235,000 | $187 | 57 |
| 928 Main St | 0.60mi | 4/1.0 (+1) | 1,560 (+7%) | 5mo | $79,900 | $51 | 51 |
| 1712 Commerce St | 0.39mi | 3/1.0 | 1,332 (-8%) | 24mo | $115,000 | $86 | 48 |
| 1330 Parkview Dr | 0.46mi | 3/1.0 | 1,296 (-11%) | 20mo | $160,000 | $123 | 44 |
| 1802 Chester Ave | 0.55mi | 3/1.0 | 1,256 (-14%) | 12mo | $89,900 | $72 | 41 |
| 1731 Commerce St | 0.40mi | 4/2.0 (+1) | 1,664 (+14%) | 11mo | $146,000 | $88 | 40 |
Match score weights: distance 35% · size 25% · config 20% · recency 20%. Top-matched comps best support the ARV.
Projected returns pro-forma
1.81% appreciation · 3.0% rent growth · sell at horizon
- IRR
- 27.0%
- Equity multiple
- 2.44×
- Total profit
- $30,067
- Equity at exit
- $28,608
- IRR
- 28.8%
- Equity multiple
- 4.70×
- Total profit
- $77,107
- Equity at exit
- $40,608
Cash invested: $20,860 (down + closing). Projections, not guarantees.
Landlord ↔ Tenant lean methodology
- Overall (STATE)
- 73 Landlord-Friendly
- State Ohio
- 73 Landlord-Friendly · R+6
- County
- — inherits STATE
- City
- — inherits STATE
ZIP-level market 43968
- Home prices YoY
- 1.0%
- Active inventory
- 20
- Price-to-rent
- 5.3×
Monthly cashflow live
- Estimated rent
- $1,166 medium interval (Pro) →
- Mortgage (P&I)
- −$391
- Tax from tax record
- −$96 /mo · $1,154/yr
- Insurance
- −$31
- HOA
- −$0
- Vacancy / Maint / Mgmt
- −$245
- Net cashflow
- $403
Break-even live
UW: 25.0% down · 7.5% · 30yr · 1.5% tax · 5.0% vac · 8.0% maint · 8.0% mgmt
Financing live
Cash to close
- Down payment
- $18,625
- Closing costs
- $2,235
- Reserves months
- —
- Total cash needed
- —
Loan-product check · same deal, 3 products live
Conventional
25% down · 7.5% · 30yr
- Down + closing
- —
- Monthly P&I
- —
- Monthly cashflow
- —
- DSCR
- —
- Eligible?
- —
Personal DTI + credit; lowest rate.
DSCR
20% down · 8.5% · 30yr
- Down + closing
- —
- Monthly P&I
- —
- Monthly cashflow
- —
- DSCR
- —
- Eligible?
- —
No personal income docs; deal must DSCR.
Hard money
10% down · 12.0% · 12mo
- Down + closing
- —
- Monthly P&I
- —
- Monthly cashflow
- —
- DSCR
- —
- Eligible?
- —
Short-term bridge; refi at stabilization.
Listing history 20 events
-
2026-06-18days on market $74,500 Active 210 DOM
-
2026-06-17days on market $74,500 Active 209 DOM
-
2026-06-16days on market $74,500 Active 208 DOM
-
2026-06-15days on market $74,500 Active 207 DOM
-
2026-06-13days on market $74,500 Active 205 DOM
-
2026-06-12days on market $74,500 Active 204 DOM
-
2026-06-09days on market $74,500 Active 201 DOM
-
2026-06-08days on market $74,500 Active 200 DOM
-
2026-06-08days on market $74,500 Active 199 DOM
-
2026-06-07days on market $74,500 Active 198 DOM
-
2026-06-04days on market $74,500 Active 195 DOM
-
2026-06-02days on market $74,500 Active 194 DOM
-
2026-06-01days on market $74,500 Active 193 DOM
-
2026-05-31days on market $74,500 Active 192 DOM
-
2025-11-20$74,500 Active 197-char remark
Show marketing remark (197 chars)
This house features 3 large bedrooms, living room, dining room and large kitchen. Laundry is featured on the 2nd floor for easy bedroom access. Enjoy the river view as you relax on the front porch.
-
2023-07-10historical
-
2023-05-25price $78,000
-
2023-05-08price $83,000
-
2023-04-10price $86,000
-
2023-04-10$85,000 Active
ⓘ Source: listings_history table (triggers on properties + properties_extension) + one-shot
backfill from property_details.listing_events for pre-trigger history.
Tax reassessment forecast OH · Partial reset (capped growth)
- Current annual tax
- $1,154 · $96/mo
- Projected year-2 tax
- $1,158 · $97/mo
- Expected delta
- +$4/yr ($0/mo · 0.4%)
ⓘ Screening estimate from a state-policy table — verify with the county assessor before closing.
Climate risk First Street
- Flood 1/10 Low FEMA zone X (unshaded) · 0% chance over 30 yrs
- Wildfire 2/10 Low
- Heat 3/10 Moderate 7 d/yr ≥98°F today · 18 d/yr by 30 yrs out
- Wind 1/10 Low
- Air quality 3/10 Moderate 2 unhealthy d/yr today · 3 by 30 yrs out
Nearby sold comps map
Loading sold comps map…
Walkable amenities ~0.75 mi
Loading nearby amenities…
Taxation est. · year 1
- Rental income
- $13,989
- − Mortgage interest
- −$4,173
- − Property taxes
- −$1,154
- − Insurance
- −$372
- − Repairs & maintenance
- −$1,119
- − Management
- −$1,119
- − Depreciation
- −$2,167
- Taxable income
- $3,884
- Est. tax owed @ 24.0%
- −$932
- After-tax cash flow
- $3,904/yr
For passive investors: Depreciation is non-cash, so a rental often shows a tax loss while cash-flowing — sheltering income. Rental losses are passive: they offset passive income freely, and up to $25,000/yr can offset ordinary (W-2) income if you actively participate and your MAGI is under $100k (phasing out to $0 by $150k); unused losses carry forward. On sale, claimed depreciation is recaptured at up to 25%, and gains may owe capital-gains tax (a 1031 exchange can defer both). Figures are a year-1 estimate at your 24.0% rate — not tax advice; consult a CPA.
Schools (NCES district)
- District
- Wellsville Local
- NCES district ID
- 3904503
- Math proficiency
- 34% ▼ -26.00%
- Reading proficiency
- 46% ▼ -12.00%
- Median HH income
- $35,795
- Composite
- 33.09/100
- National rank
- #5563
- State rank
- #546 of 656 in OH
Livability — Wellsville
- Score
- 69/100
- State rank
- #505
- US rank
- #8502
Category grades
Schools grade is shown separately in the Schools card above.
Census & demographics
- Census place
- Wellsville, OH
- County
- Columbiana · 99,532 people
- Population (ZIP)
- 6,445
- Household income
- $62,172
- Rent vs Own
- Severe rent burden
- 11.8
Population outlook (Columbiana County) Hauer SSP2
- Today (2025)
- 98,353 people
- By 2030
- 94,225 · -4.2%
- By 2040
- 85,169 · -13.4%
- By 2050
- 76,157 · -22.6%
- By 2075
- 58,451 · -40.6%
- By 2100
- 42,805 · -56.5%
Race, ethnicity, and origin ACS 2023
- Neighborhood character
- Predominantly White (89%)
- Race & ethnicity
- White 89% Black 6% Two or more races 3%
- Common ancestry
- Serbian 5% Romanian 4% Iranian 2%
Political lean MEDSL · Columbiana
- 2024 margin
- Solid R (+49.0) · D 25.1% · R 74.1%
- 2008→2024 swing
- -41.4pp toward R · 2008: -7.6pp · 2024: -49.0pp
- All cycles
- 2024: R+49.0 2020: R+44.9 2016: R+41.6 2012: R+12.0 2008: R+7.6
Not yet ingested
- Civics
- —
Market trends
- HPI YoY
- ▲ 1.81%
- Current HPI
- 181.4494
- Rent YoY
- —
- Metro
- —
- State GDP YoY
- ▲ 1.98%
- F500 in state
- 48
Industry mix (Fortune 500 HQ in OH)
| Industry | F500 HQs | Revenue |
|---|---|---|
| Insurance | 3 | $145B |
|
||
| Industrial Machinery | 3 | $49B |
|
||
| Financial Services | 3 | $24B |
|
||
| Consumer Goods | 2 | $93B |
|
||
| Aerospace / Defense | 2 | $47B |
|
||
| Utilities | 2 | $33B |
|
||
Price history
-12.4% since first listed6 events — show timeline
- 2025-11-20 Listed $74,500 MLSNOW
- 2023-07-10 Listing Removed — MLSNOW
- 2023-05-25 Price Changed $78,000 MLSNOW
- 2023-05-08 Price Changed $83,000 MLSNOW
- 2023-04-10 Price Changed $86,000 MLSNOW
- 2023-04-10 Listed $85,000 MLSNOW
Property tax history
+10.4%/yrLatest (2025): $1,154 · +9.7% YoY. Source: county tax records.
Cash-flow waterfall
monthlySold comps — $/sqft
last 12 mo · ≤1 miLoading sold comps…