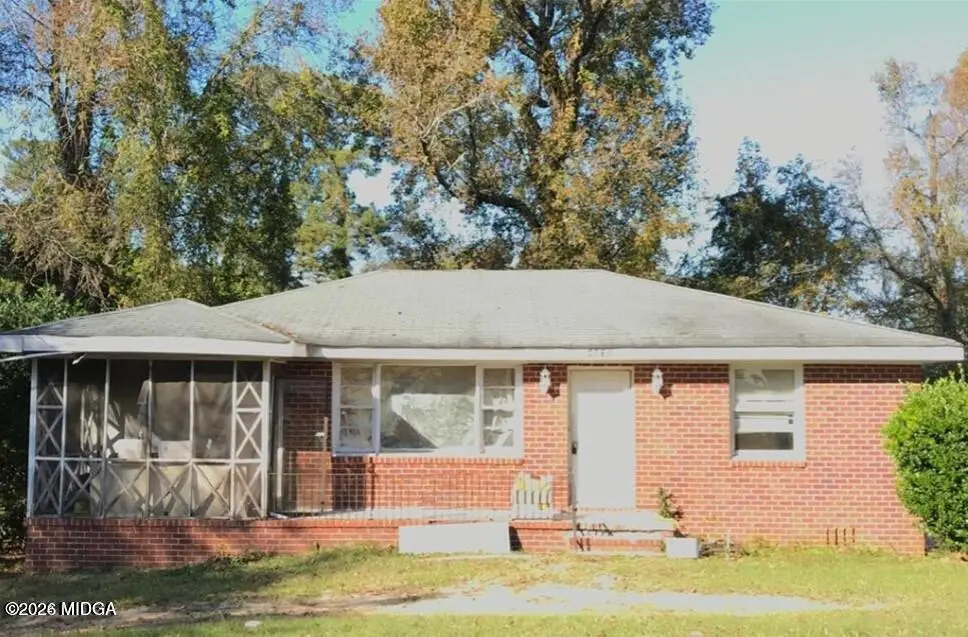
4071 Marse Allen Rd · Macon-Bibb County, GA
Flood risk 7/10 · Major
- FEMA flood zone
- X (unshaded)
- Chance of flooding over 30 yrs
- 0.77%
- Est. flood insurance / yr
- $473 – $860
Fire risk 3/10 · Minor
- Est. fire insurance / yr
- $963 – $1,789
Heat risk 7/10 · Major
- Hot days now (above 109°F)
- 7 days/yr
- Hot days in 30 yrs
- 18 days/yr
Wind risk 6/10 · Moderate
- Chance of severe wind over 30 yrs
- 68.0%
Air-quality risk 3/10 · Minor
- Unhealthy air days now
- 3 days/yr
- Unhealthy air days in 30 yrs
- 4 days/yr
Risk factors via First Street. Map © Google.
Why this score? — see what drove the B grade
The composite is a weighted blend of 9 inputs, each scored 0–100. Each bar is that input's sub-score; the figure is the points it added to the 100-point composite (weight × sub-score).
- Cash flow +30.0/30.0
- ARV discount +12.7/15.0
- 1% rule +10.0/10.0
- DSCR +10.0/10.0
- Rent growth +3.8/5.0
- Livability +2.5/5.0
- Condition / age +2.5/5.0
- Schools +1.2/10.0
- Appreciation +0.0/10.0
$75,000
🖨 Deal sheet 📄 Offer letter ✓ Due diligence
Listing remarks MLS
Spacious full brick home offering 4 bedrooms and 2 baths with room for everyone! This property features a huge living room with fireplace, formal dining room, and a nice-sized kitchen with plenty of cabinet space. The finished walk-out basement includes an additional living area, bedroom, and full bath, offering great space for guests, extended family, or flexible living arrangements. Enjoy the large backyard and relax on the covered, screened-in front porch. Full brick on all four sides for lasting durability and low maintenance. Currently rented with a long-term tenant in place for 5+ years, making this a great investment opportunity. Don't miss your chance to own this spacious home!
Key facts
- Large backyard
- Huge living room
- Full brick home
Tags
Property features AI
Finance
- Other: Property located in Bedingfield subdivision, Macon, GA 31206
- Financial info: Listing accepts Cash and Conventional financing; Special listing condition: Rental
- HOA & community: No HOA (no association fees); Street lights in community
Exterior
- Parking: Open parking with parking pad (2 spaces)
- Utilities: Public water; Public sewer; Electricity available; Cable available; High-speed internet available; Phone available
- Home design: Single-family house (residential); Two levels; Resale property
- Construction: Built in 1955; Brick construction; Block foundation; Composition roof
- Exterior features: City lot
Interior
- Kitchen: No appliances specified
- Bedrooms: 4 bedrooms total (3 on main level, 1 on lower level)
- Flooring: Carpet and other flooring
- Bathrooms: 2 full bathrooms (1 on main level, 1 on lower level)
- Heating & cooling: Central heating with heat pump; Central air and ceiling fans
- Interior features: Finished basement with interior entry; Masonry fireplace (1)
- Laundry & utility: Laundry features listed as Other
Neighborhood map
What this means for you Summary
Snapshot
- This is a 3-bed/2.0-bath single-family listed at $75k.
Deal economics
- At list price, monthly cash flow is $377 ($5k/yr) — positive.
- The deal already cash-flows at list — no discount required.
- Meets the 1% rule at list price ($1k rent vs $75k).
- Recommended offer: $73k (3.0% below list) — sets the bar for market timing.
- Cap rate 13.2% vs local median 5.4% in Macon-Bibb County — top-decile yield for the area; either an underpriced asset or a hidden risk that comps aren't pricing in. Stress-test before assuming the spread holds.
Location & tenants
- Location reads: area grade B — affects rentability + tenant quality, not the cash-flow math above.
- Bibb County (urban): math 11% / reading 18% proficiency, ranked #161 of 174 in GA (top 92%) — low school quality limits family demand, transient renter base, plan for 1-2y turnover; 75% free/reduced lunch — lower-income household profile, screen leases tightly.
- Zoned schools: Bruce Elementary School (math 2% / reading 2%, grade F, #1,204 of 1,228 statewide, top 100%, 434 students, 100% FRL); Rutland Middle School (math 12% / reading 28%, grade F, #349 of 470 statewide, top 75%, 812 students, 100% FRL); Rutland High School (math 2% / reading 8%, grade F, #394 of 424 statewide, top 97%, 907 students, 100% FRL) — zoned schools average 100% FRL vs 75% district-wide (25 pts higher); higher-poverty schools than district average — tighter screening recommended.
- Market conditions: Rents rising fast (+5.0%/yr); 207 active listings in the ZIP; 23 comparable units currently listed for rent nearby; rentals at typical pace (median 21d on market — plan ~3-4 weeks tenant-placement turnaround); 48% of comp listings sitting > 30 days — soft ceiling on asking rent; lower-income renter base — watch delinquency; 154 units permitted in Bibb County in 2024 (0 in 5+ unit buildings).
Forward outlook
- Local home prices are declining (-3.0%/yr); year-one equity from $519 of loan paydown is wiped out by about $2k of value loss. Plan a longer hold.
- Bibb County population projected at -12% by 2050 — secular population decline; favor cash flow + early exit over multi-decade hold.
- At projected returns (-3.0% appreciation + 5.0% rent growth), your $21k cash investment doubles in ~6 years — after that, you're playing with house money.
Negotiation context
- It's been on market 39 days — a 3% lower offer ($73k) is reasonable based on typical stale-listing flexibility.
- 8 sale attempts since 5y ago; this cycle's ask has dropped $5k (6%) from the opening price — seller is motivated, your offer sets the floor, not the list.
- Current owner paid $31k; list at $75k implies a 142% gain — meaningful room to come down on a strong offer.
Risks & watch-outs
- Watch-outs: flood insurance adds $56/mo; built in 1955 — expect roof / HVAC / electrical / plumbing capex.
- Climate carrying-cost: major flood risk; major wind risk, 68% chance of damaging wind over 30y; extreme-heat days projected 7→18/yr by 2055 (HVAC capex compounding) — expect insurance premiums to compound above CPI over the hold.
Questions for the listing agent
- It's been on market 39 days. Have you received any prior offers? Is the seller open to a 3% concession, seller financing, or rate buy-down credit?
- Built in 1955 — when were the roof, HVAC, electrical panel, plumbing, and water heater last replaced?
- What's the actual annual flood-insurance premium (NFIP or private), and is the property in a SFHA with mandatory coverage?
- Is there a deadline driving the sale (1031 exchange, divorce, estate, relocation)? That informs how much negotiation room exists.
- What's the average days-on-market for RENTAL listings here right now (not sales)? A rising rental-DOM trend means longer vacancies and softer asking-rent achievability than the comps imply.
- What's the recent tenant-quality profile in this submarket — average credit score on applications, eviction rate, late-payment / NSF rate, and stable-employment percentage? A property-management company in the area should have these aggregated.
- How much new for-sale + rental construction is in the pipeline within 1–3 miles? Heavy new supply typically softens prices + rents 12–24 months out; constrained supply supports both.
Investment metrics
- 1% rule
- 1.55% ✓
- Cap rate
- 13.22%
- Cash-on-cash
- 24.72%
- DSCR
- 2.10
- GRM
- 5.4
CMA / ARV
- ARV (median comp)
- $84,896
- List price
- $75,000
- Delta
- -11.66%
- Verdict
- UNDERPRICED
- Comps
- 20 within 1.0 mi
Show comp detail 12 sales within ~0.75 mi
| Address | Dist | Beds/Ba | Sqft | Sold | Price | $/sf | Match |
|---|---|---|---|---|---|---|---|
| 3930 Mathis St | 0.24mi | 3/2.0 | 1,720 (+2%) | 1mo | $72,000 | $42 | 84 |
| 4022 Cynthia Weir Ave | 0.20mi | 4/2.0 (+1) | 1,646 (-2%) | 10mo | $115,000 | $70 | 74 |
| 3855 Emory Dr | 0.27mi | 4/2.0 (+1) | 1,676 (-0%) | 21mo | $50,000 | $30 | 64 |
| 859 Charlotte St | 0.59mi | 3/2.0 | 1,620 (-4%) | 11mo | $132,500 | $82 | 58 |
| 836 Grady St S | 0.55mi | 3/2.0 | 1,572 (-6%) | 12mo | $36,900 | $23 | 54 |
| 3866 Myrtle Ct | 0.39mi | 4/2.0 (+1) | 1,515 (-10%) | 8mo | $40,000 | $26 | 54 |
| 3896 Tela Pl | 0.68mi | 3/1.0 | 1,691 (+1%) | 13mo | $115,000 | $68 | 53 |
| 1047 Newberg Ave | 0.68mi | 3/2.0 | 1,773 (+6%) | 10mo | $154,900 | $87 | 50 |
| 145 Hurley Park | 0.55mi | 3/2.0 | 1,512 (-10%) | 15mo | $150,000 | $99 | 45 |
| 935 Troupe St | 0.43mi | 4/2.0 (+1) | 1,430 (-15%) | 6mo | $85,000 | $59 | 45 |
| 966 W Grenada Ter | 0.57mi | 3/2.0 | 1,468 (-13%) | 12mo | $101,500 | $69 | 42 |
| 1308 Dewey St | 0.64mi | 4/2.0 (+1) | 1,456 (-13%) | 7mo | $138,000 | $95 | 37 |
Match score weights: distance 35% · size 25% · config 20% · recency 20%. Top-matched comps best support the ARV.
Projected returns pro-forma
-3.0% appreciation · 5.03% rent growth · sell at horizon
- IRR
- 16.5%
- Equity multiple
- 1.68×
- Total profit
- $14,312
- Equity at exit
- $11,183
- IRR
- 26.5%
- Equity multiple
- 3.56×
- Total profit
- $53,845
- Equity at exit
- $6,485
Cash invested: $21,000 (down + closing). Projections, not guarantees.
Landlord ↔ Tenant lean methodology
- Overall (STATE)
- 90 Strongly Landlord-Friendly
- State Georgia
- 90 Strongly Landlord-Friendly · R+3
- County
- — inherits STATE
- City
- — inherits STATE
ZIP-level market 31206
- Rents YoY
- 5.0%
- Active inventory
- 207
- Price-to-rent
- 5.4×
Monthly cashflow live
- Estimated rent
- $1,159 high interval (Pro) →
- Mortgage (P&I)
- −$393
- Tax from tax record
- −$58 /mo · $702/yr
- Insurance
- −$31
- Flood insurance flood zone
- −$56 /mo · $666/yr
- HOA
- −$0
- Vacancy / Maint / Mgmt
- −$243
- Net cashflow
- $377
Break-even live
UW: 25.0% down · 7.5% · 30yr · 1.5% tax · 5.0% vac · 8.0% maint · 8.0% mgmt
Financing live
Cash to close
- Down payment
- $18,750
- Closing costs
- $2,250
- Reserves months
- —
- Total cash needed
- —
Loan-product check · same deal, 3 products live
Conventional
25% down · 7.5% · 30yr
- Down + closing
- —
- Monthly P&I
- —
- Monthly cashflow
- —
- DSCR
- —
- Eligible?
- —
Personal DTI + credit; lowest rate.
DSCR
20% down · 8.5% · 30yr
- Down + closing
- —
- Monthly P&I
- —
- Monthly cashflow
- —
- DSCR
- —
- Eligible?
- —
No personal income docs; deal must DSCR.
Hard money
10% down · 12.0% · 12mo
- Down + closing
- —
- Monthly P&I
- —
- Monthly cashflow
- —
- DSCR
- —
- Eligible?
- —
Short-term bridge; refi at stabilization.
Rent comps 23 comps
| Address | Beds | Baths | Sqft | Rent | $/sqft | DOM | Units | Dist |
|---|---|---|---|---|---|---|---|---|
| 1240 Rocky Creek Rd Unit A Macon, GA | 4.0 | 1.0 | 1342 | $1,090 | $0.81 | 21d | 1 | 0.18mi |
| 1289 Rocky Creek Rd Macon, GA | 2.0 | 1.0 | 1404 | $750 | $0.53 | 43d | 1 | 0.20mi |
| 1148 N Beddingfield Dr Macon, GA | 3.0 | 1.0 | 1076 | $825 | $0.77 | 43d | 1 | 0.31mi |
| 1332 Hillridge Dr Macon, GA | 3.0 | 2.0 | 1050 | $1,050 | $1.00 | 13d | 1 | 0.36mi |
| 947 Troupe St Unit B Macon, GA | 2.0 | 2.0 | 1699 | $1,200 | $0.71 | 43d | 1 | 0.41mi |
| 947 Troupe St Macon, GA | 2.0 | 2.0 | 1699 | $1,200 | $0.71 | 21d | 1 | 0.41mi |
| 4052 Mikado Ave Macon, GA | 3.0 | 1.0 | 1624 | $1,300 | $0.80 | 13d | 1 | 0.44mi |
| 3685 Rice Mill Rd Macon, GA | 3.0 | 1.0 | 1152 | $1,450 | $1.26 | 43d | 1 | 0.50mi |
| 846 Bedingfield Ave Macon, GA | 3.0 | 1.5 | 1187 | $975 | $0.82 | 43d | 1 | 0.51mi |
| 832 Richmond St Macon, GA | 3.0 | 1.0 | 1364 | $925 | $0.68 | 21d | 1 | 0.53mi |
| 1164 Newberg Ave Macon, GA | 3.0 | 1.0 | 1100 | $1,195 | $1.09 | 43d | 1 | 0.60mi |
| 3837 Spencer Cir Macon, GA | 3.0 | 1.0 | 1080 | $1,300 | $1.20 | 43d | 1 | 0.66mi |
| 1334 Dewey St Macon, GA | 3.0 | 2.0 | 1942 | $1,300 | $0.67 | 21d | 1 | 0.66mi |
| 3238 Somerset Dr Macon, GA | 3.0 | 1.0 | 1100 | $975 | $0.89 | 13d | 1 | 0.69mi |
| 4322 Mikado Ave Macon, GA | 3.0 | 2.0 | 1344 | $1,230 | $0.92 | 21d | 1 | 0.69mi |
| 3709 Flamingo Dr Macon, GA | 3.0 | 1.0 | 1360 | $1,300 | $0.96 | 43d | 1 | 0.82mi |
| 3080 Rice Mill Rd Unit C-1 Macon, GA | 3.0 | 1.5 | 1100 | $925 | $0.84 | 21d | 1 | 0.96mi |
| 3080 Rice Mill Rd Macon, GA | 3.0 | 1.0 | 1100 | $950 | $0.86 | 43d | 1 | 0.96mi |
| 4011 Marion Ave Macon, GA | 2.0 | 1.0 | 1200 | $1,200 | $1.00 | 21d | 1 | 1.03mi |
| 524 Carmen Pl Macon, GA | 3.0 | 1.0 | 1175 | $1,050 | $0.89 | 43d | 1 | 1.17mi |
| 645 Rutherford Ave Macon, GA | 4.0 | 2.0 | 1481 | $1,395 | $0.94 | 43d | 1 | 1.26mi |
| 3733 Lindsey Dr Macon, GA | 3.0 | 2.0 | 1645 | $1,350 | $0.82 | 13d | 1 | 1.29mi |
| 1575 Winston Dr Macon, GA | 3.0 | 2.0 | 1215 | $1,350 | $1.11 | 21d | 1 | 1.33mi |
Listing history 34 events
-
2026-06-19days on market $75,000 Active 39 DOM
-
2026-06-18days on market $75,000 Active 38 DOM
-
2026-06-17days on market $75,000 Active 37 DOM
-
2026-06-16days on market $75,000 Active 36 DOM
-
2026-06-15days on market $75,000 Active 35 DOM
-
2026-06-14days on market $75,000 Active 33 DOM
-
2026-06-13statusdays on market $75,000 Active 32 DOM
-
2026-06-10days on market $75,000 Price Change 30 DOM
-
2026-06-09days on market $75,000 Price Change 29 DOM
-
2026-06-09pricestatusdays on market $75,000 Price Change 28 DOM
-
2026-06-07days on market $80,000 Active 27 DOM
-
2026-06-03days on market $80,000 Active 23 DOM
-
2026-06-02days on market $80,000 Active 22 DOM
-
2026-06-01days on market $80,000 Active 21 DOM
-
2026-05-31days on market $80,000 Active 20 DOM
-
2026-05-30days on market $80,000 Active 19 DOM
-
2026-05-11$80,000 Active 694-char remark
Show marketing remark (694 chars)
Spacious full brick home offering 4 bedrooms and 2 baths with room for everyone! This property features a huge living room with fireplace, formal dining room, and a nice-sized kitchen with plenty of cabinet space. The finished walk-out basement includes an additional living area, bedroom, and full bath, offering great space for guests, extended family, or flexible living arrangements. Enjoy the large backyard and relax on the covered, screened-in front porch. Full brick on all four sides for lasting durability and low maintenance. Currently rented with a long-term tenant in place for 5+ years, making this a great investment opportunity. Don't miss your chance to own this spacious home!
-
2026-05-06$80,000 Active 694-char remark
Show marketing remark (694 chars)
Spacious full brick home offering 4 bedrooms and 2 baths with room for everyone! This property features a huge living room with fireplace, formal dining room, and a nice-sized kitchen with plenty of cabinet space. The finished walk-out basement includes an additional living area, bedroom, and full bath, offering great space for guests, extended family, or flexible living arrangements. Enjoy the large backyard and relax on the covered, screened-in front porch. Full brick on all four sides for lasting durability and low maintenance. Currently rented with a long-term tenant in place for 5+ years, making this a great investment opportunity. Don't miss your chance to own this spacious home!
-
2026-05-05$80,000 New
-
2025-01-03status Under Contract
-
2025-01-03historical
-
2025-01-03$85,000 New
-
2024-11-29historical
-
2024-09-10historical Active Under Contract
-
2024-06-07$85,000 New
-
2021-06-23soldstatus $31,000 Sold
-
2021-06-23soldstatus $31,000
-
2021-06-23soldstatus $31,000
-
2021-06-07status Under Contract
-
2021-06-03$29,900 New
-
2021-06-03$29,900
-
2021-06-03$29,900
-
2002-09-11soldstatus $40,000
-
2002-05-07soldstatus $28,875
ⓘ Source: listings_history table (triggers on properties + properties_extension) + one-shot
backfill from property_details.listing_events for pre-trigger history.
Tax reassessment forecast GA · Resets to sale price
- Current annual tax
- $702 · $58/mo
- Projected year-2 tax
- $702 · $58/mo
- Expected delta
- $0/yr ($0/mo · 0.0%)
ⓘ Screening estimate from a state-policy table — verify with the county assessor before closing.
Climate risk First Street
- Flood 7/10 Severe FEMA zone X (unshaded) · 77% chance over 30 yrs
- Wildfire 3/10 Moderate
- Heat 7/10 Severe 7 d/yr ≥109°F today · 18 d/yr by 30 yrs out
- Wind 6/10 Major 68% chance of damaging wind over 30 yrs
- Air quality 3/10 Moderate 3 unhealthy d/yr today · 4 by 30 yrs out
Nearby sold comps map
Loading sold comps map…
Walkable amenities ~0.75 mi
Loading nearby amenities…
Taxation est. · year 1
- Rental income
- $13,910
- − Mortgage interest
- −$4,201
- − Property taxes
- −$702
- − Insurance
- −$1,042
- − Repairs & maintenance
- −$1,113
- − Management
- −$1,113
- − Depreciation
- −$2,182
- Taxable income
- $3,558
- Est. tax owed @ 24.0%
- −$854
- After-tax cash flow
- $3,672/yr
For passive investors: Depreciation is non-cash, so a rental often shows a tax loss while cash-flowing — sheltering income. Rental losses are passive: they offset passive income freely, and up to $25,000/yr can offset ordinary (W-2) income if you actively participate and your MAGI is under $100k (phasing out to $0 by $150k); unused losses carry forward. On sale, claimed depreciation is recaptured at up to 25%, and gains may owe capital-gains tax (a 1031 exchange can defer both). Figures are a year-1 estimate at your 24.0% rate — not tax advice; consult a CPA.
Schools (NCES district)
- District
- Bibb County
- NCES district ID
- 1300420
- Math proficiency
- 11% ▼ -14.00%
- Reading proficiency
- 18% ▼ -11.00%
- Median HH income
- $37,426
- Composite
- 12.13/100
- National rank
- #9654
- State rank
- #161 of 174 in GA
Livability — Macon-Bibb County
No livability data for this city. (Only ~50 U.S. cities are tracked.)
Census & demographics
- Census place
- Macon-Bibb County, GA
- County
- Bibb County · 164,332 people
- City population
- 143,186
- Metro
- Macon-Bibb County, GA
- Population (ZIP)
- 24,310
- Household income
- $30,042
- Rent vs Own
- Severe rent burden
- 1335.0
Population outlook (Bibb County) Hauer SSP2
- Today (2025)
- 148,772 people
- By 2030
- 145,904 · -1.9%
- By 2040
- 139,404 · -6.3%
- By 2050
- 131,603 · -11.5%
- By 2075
- 111,050 · -25.4%
- By 2100
- 83,346 · -44.0%
Race, ethnicity, and origin ACS 2023
- Neighborhood character
- Predominantly Black (76%)
- Race & ethnicity
- Black 76% White 12% Hispanic / Latino 8% Two or more races 4%
- Hispanic origin (detail)
- Mexican 5% Puerto Rican 1%
- Common ancestry
- Lithuanian 1% Italian 1%
- Foreign-born
- 4% · Canada
- Languages at home
- 91% English-only · Spanish 8%
Political lean MEDSL · Bibb
- 2024 margin
- Strong D (+22.4) · D 61.0% · R 38.5%
- 2008→2024 swing
- +4.4pp toward D · 2008: 18.0pp · 2024: 22.4pp
- All cycles
- 2024: D+22.4 2020: D+23.8 2016: D+20.2 2012: D+20.0 2008: D+18.0
Not yet ingested
- Civics
- —
Market trends
- HPI YoY
- ▼ -80.17%
- Current HPI
- 148.6765
- Rent YoY
- ▲ 5.03%
- Metro
- Macon-Bibb County, GA
- State GDP YoY
- ▲ 2.66%
- F500 in state
- 28
Industry mix (Fortune 500 HQ in GA)
| Industry | F500 HQs | Revenue |
|---|---|---|
| Paper / Packaging | 2 | $29B |
|
||
| Retail | 1 | $160B |
|
||
| Transportation / Logistics | 1 | $91B |
|
||
| Airlines | 1 | $62B |
|
||
| Consumer Goods | 1 | $47B |
|
||
| Utilities | 1 | $25B |
|
||
Price history
+159.7% since first listed21 events — show timeline
- 2026-06-08 Price Changed $75,000 MGMLS
- 2026-06-08 Price Changed $75,000 CGMLS
- 2026-06-08 Price Changed $75,000 GAMLS
- 2026-05-11 Listed $80,000 MGMLS
- 2026-05-06 Listed $80,000 CGMLS
- 2026-05-05 Listed $80,000 GAMLS
- 2025-01-03 Pending — GAMLS
- 2025-01-03 Listing Removed — GAMLS
- 2025-01-03 Listed $85,000 GAMLS
- 2024-11-29 Listing Removed — GAMLS
- 2024-09-10 Contingent — GAMLS
- 2024-06-07 Listed $85,000 GAMLS
- 2021-06-23 Sold (MLS) $31,000 CGMLS
- 2021-06-23 Sold (MLS) $31,000 MGMLS
- 2021-06-23 Sold (MLS) $31,000 GAMLS
- 2021-06-07 Pending — GAMLS
- 2021-06-03 Listed $29,900 CGMLS
- 2021-06-03 Listed $29,900 MGMLS
- 2021-06-03 Listed $29,900 GAMLS
- 2002-09-11 Sold (Public Records) $40,000 Public Records
- 2002-05-07 Sold (Public Records) $28,875 Public Records
Property tax history
+12.1%/yrLatest (2025): $702 · +39.6% YoY. Source: county tax records.
Cash-flow waterfall
monthlySold comps — $/sqft
last 12 mo · ≤1 miLoading sold comps…