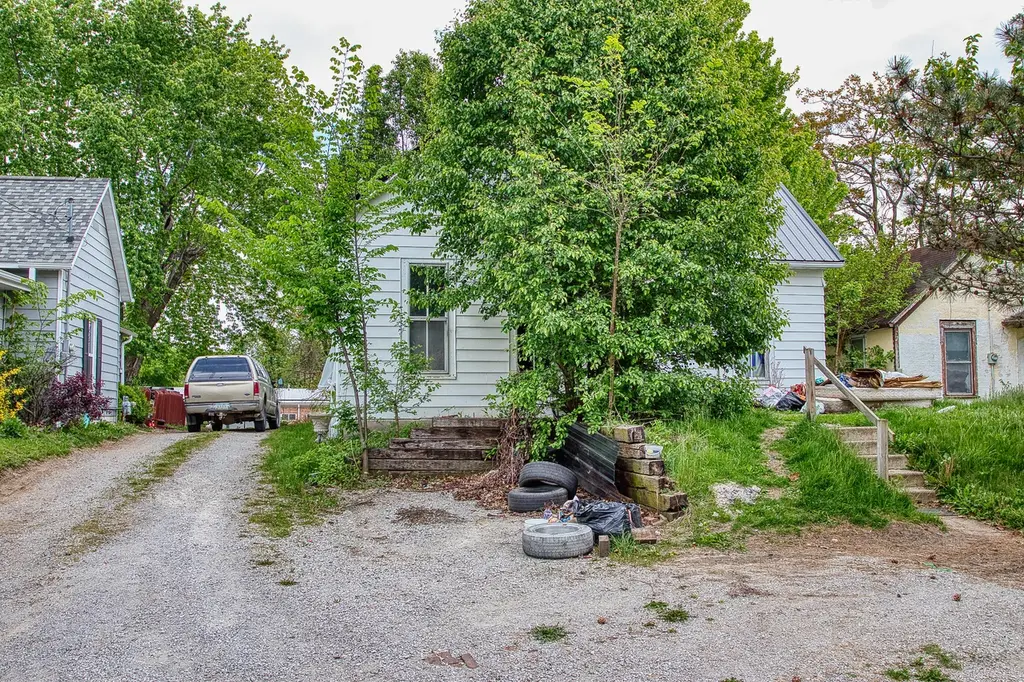
515 S 16th St · Centerville, IA
Flood risk 1/10 · Minimal
- FEMA flood zone
- X (unshaded)
- Chance of flooding over 30 yrs
- 0.0%
- Est. flood insurance / yr
- $473 – $860
Fire risk 2/10 · Minimal
- Est. fire insurance / yr
- $902 – $1,676
Heat risk 3/10 · Minor
- Hot days now (above 104°F)
- 7 days/yr
- Hot days in 30 yrs
- 14 days/yr
Wind risk 2/10 · Minimal
- Chance of severe wind over 30 yrs
- —
Air-quality risk 2/10 · Minimal
- Unhealthy air days now
- 1 days/yr
- Unhealthy air days in 30 yrs
- 3 days/yr
Risk factors via First Street. Map © Google.
Why this score? — see what drove the A- grade
The composite is a weighted blend of 9 inputs, each scored 0–100. Each bar is that input's sub-score; the figure is the points it added to the 100-point composite (weight × sub-score).
- Cash flow +30.0/30.0
- ARV discount +15.0/15.0
- 1% rule +10.0/10.0
- DSCR +10.0/10.0
- Appreciation +6.3/10.0
- Schools +5.0/10.0
- Livability +3.7/5.0
- Rent growth +2.5/5.0
- Condition / age +2.5/5.0
$43,900
🖨 Deal sheet 📄 Offer letter ✓ Due diligence
Listing remarks
Investor special with great potential! This 2 bed, 1 bath home offers 962 sq. ft. of living space and is priced to sell. Perfect opportunity for investors, flippers, or buyers looking to build equity. Features include a functional layout, spacious yard, and convenient location close to local amenities. Home is in need of updates and repairs but offers plenty of upside. Bring your vision and make this property shine! Being sold as-is.
Key facts
- Spacious yard
- Functional layout
- Convenient location
Tags
Property features AI
Exterior
- Parking: Gravel parking area
- Utilities: Public water; Public sewer
- Home design: One and one-half stories; Single-family residential
- Construction: Metal siding
- Exterior features: Gravel parking; Lot approximately 0.2 acres
Interior
- Bathrooms: 1 full bathroom
- Heating & cooling: Baseboard heating; No cooling
- Interior features: Basement present
Neighborhood map
What this means for you Summary
Snapshot
- This is a 2-bed/1.0-bath other listed at $44k.
Deal economics
- At list price, monthly cash flow is $353 ($4k/yr) — positive.
- The deal already cash-flows at list — no discount required.
- Meets the 1% rule at list price ($874 rent vs $44k).
- Recommended offer: $43k (3.0% below list) — sets the bar for market timing.
- Cap rate 15.9% vs local median 4.0% in Centerville — top-decile yield for the area; either an underpriced asset or a hidden risk that comps aren't pricing in. Stress-test before assuming the spread holds.
Location & tenants
- Location reads 73/100 on livability (#277 in IA) — a middle-class / working-renter tenant base. Strengths: cost of living A+, housing A+, health & safety A+; Watch: amenities F, commute F, employment F.
- Centerville Community School District (town): math 57% / reading 65% proficiency, ranked #251 of 289 in IA (top 87%) — acceptable for families but not a draw, mixed tenant base, ~2y average lease.
- Market conditions: 8 active listings in the ZIP; 6 units permitted in Appanoose County in 2024 (0 in 5+ unit buildings).
Forward outlook
- In year one you build about $1k of equity ($304 loan paydown + $1k appreciation (2.5% local appreciation)).
- Appanoose County population projected at -24% by 2050 — secular population decline; favor cash flow + early exit over multi-decade hold.
- At projected returns (2.5% appreciation + 3.0% rent growth), your $12k cash investment doubles in ~3 years — after that, you're playing with house money.
Negotiation context
- It's been on market 35 days — a 3% lower offer ($43k) is reasonable based on typical stale-listing flexibility.
- 4 sale attempts since 8y ago; this cycle's ask has dropped $10k (19%) from the opening price — seller is motivated, your offer sets the floor, not the list.
- Current owner paid $30k; 46% above their basis — modest negotiation headroom, anchor on the comps not their cost.
Risks & watch-outs
- Watch-outs: built in 1925 — expect roof / HVAC / electrical / plumbing capex.
Questions for the listing agent
- It's been on market 35 days. Have you received any prior offers? Is the seller open to a 3% concession, seller financing, or rate buy-down credit?
- Built in 1925 — when were the roof, HVAC, electrical panel, plumbing, and water heater last replaced?
- Is there a deadline driving the sale (1031 exchange, divorce, estate, relocation)? That informs how much negotiation room exists.
- Schools are A-rated — typically a magnet for longer-tenancy family renters. What's the average tenant stay here, and is there a school-zone premium baked into asking?
- What's the average days-on-market for RENTAL listings here right now (not sales)? A rising rental-DOM trend means longer vacancies and softer asking-rent achievability than the comps imply.
- What's the recent tenant-quality profile in this submarket — average credit score on applications, eviction rate, late-payment / NSF rate, and stable-employment percentage? A property-management company in the area should have these aggregated.
- How much new for-sale + rental construction is in the pipeline within 1–3 miles? Heavy new supply typically softens prices + rents 12–24 months out; constrained supply supports both.
Investment metrics
- 1% rule
- 1.99% ✓
- Cap rate
- 15.94%
- Cash-on-cash
- 34.46%
- DSCR
- 2.53
- GRM
- 4.2
CMA / ARV
- ARV (median comp)
- $74,661
- List price
- $43,900
- Delta
- -41.20%
- Verdict
- UNDERPRICED
- Comps
- 20 within 1.0 mi
Projected returns pro-forma
2.52% appreciation · 3.0% rent growth · sell at horizon
- IRR
- 39.4%
- Equity multiple
- 3.17×
- Total profit
- $26,700
- Equity at exit
- $18,563
- IRR
- 39.9%
- Equity multiple
- 6.29×
- Total profit
- $64,995
- Equity at exit
- $27,725
Cash invested: $12,292 (down + closing). Projections, not guarantees.
Landlord ↔ Tenant lean methodology
- Overall (STATE)
- 83 Strongly Landlord-Friendly
- State Iowa
- 83 Strongly Landlord-Friendly · R+6
- County
- — inherits STATE
- City
- — inherits STATE
ZIP-level market 52574
- Home prices YoY
- 3.2%
- Active inventory
- 8
- Price-to-rent
- 4.2×
Monthly cashflow live
- Estimated rent
- $874 medium interval (Pro) →
- Mortgage (P&I)
- −$230
- Tax from tax record
- −$89 /mo · $1,066/yr
- Insurance
- −$18
- HOA
- −$0
- Vacancy / Maint / Mgmt
- −$184
- Net cashflow
- $353
Break-even live
UW: 25.0% down · 7.5% · 30yr · 1.5% tax · 5.0% vac · 8.0% maint · 8.0% mgmt
Financing live
Cash to close
- Down payment
- $10,975
- Closing costs
- $1,317
- Reserves months
- —
- Total cash needed
- —
Loan-product check · same deal, 3 products live
Conventional
25% down · 7.5% · 30yr
- Down + closing
- —
- Monthly P&I
- —
- Monthly cashflow
- —
- DSCR
- —
- Eligible?
- —
Personal DTI + credit; lowest rate.
DSCR
20% down · 8.5% · 30yr
- Down + closing
- —
- Monthly P&I
- —
- Monthly cashflow
- —
- DSCR
- —
- Eligible?
- —
No personal income docs; deal must DSCR.
Hard money
10% down · 12.0% · 12mo
- Down + closing
- —
- Monthly P&I
- —
- Monthly cashflow
- —
- DSCR
- —
- Eligible?
- —
Short-term bridge; refi at stabilization.
Listing history 24 events
-
2026-06-18days on market $43,900 Active 35 DOM
-
2026-06-17days on market $43,900 Active 34 DOM
-
2026-06-16days on market $43,900 Active 33 DOM
-
2026-06-15days on market $43,900 Active 32 DOM
-
2026-06-13pricedays on market $43,900 Active 30 DOM
-
2026-06-12days on market $39,000 Active 31 DOM
-
2026-06-09days on market $39,000 Active 28 DOM
-
2026-06-08days on market $39,000 Active 27 DOM
-
2026-06-07days on market $39,000 Active 26 DOM
-
2026-06-07days on market $39,000 Active 25 DOM
-
2026-06-04days on market $39,000 Active 22 DOM
-
2026-06-02days on market $39,000 Active 21 DOM
-
2026-06-01price $39,000 Active 20 DOM
-
2026-06-01days on market $43,900 Active 20 DOM
-
2026-05-31days on market $43,900 Active 19 DOM
-
2026-05-31days on market $43,900 Active 18 DOM
-
2026-05-18price $43,900 436-char remark
-
2026-05-18price $43,900 437-char remark
-
2026-05-11$53,900 Active 436-char remark
-
2026-05-11$53,900 Active 437-char remark
-
2019-05-28soldstatus $30,000
-
2019-05-28soldstatus $30,000
-
2019-03-28$32,000
-
2018-09-17$39,500
ⓘ Source: listings_history table (triggers on properties + properties_extension) + one-shot
backfill from property_details.listing_events for pre-trigger history.
Tax reassessment forecast IA · Partial reset (capped growth)
- Current annual tax
- $1,066 · $89/mo
- Projected year-2 tax
- $1,066 · $89/mo
- Expected delta
- $0/yr ($0/mo · 0.0%)
ⓘ Screening estimate from a state-policy table — verify with the county assessor before closing.
Climate risk First Street
- Flood 1/10 Low FEMA zone X (unshaded) · 0% chance over 30 yrs
- Wildfire 2/10 Low
- Heat 3/10 Moderate 7 d/yr ≥104°F today · 14 d/yr by 30 yrs out
- Wind 2/10 Low
- Air quality 2/10 Low 1 unhealthy d/yr today · 3 by 30 yrs out
Nearby sold comps map
Loading sold comps map…
Walkable amenities ~0.75 mi
Loading nearby amenities…
Taxation est. · year 1
- Rental income
- $10,486
- − Mortgage interest
- −$2,459
- − Property taxes
- −$1,066
- − Insurance
- −$220
- − Repairs & maintenance
- −$839
- − Management
- −$839
- − Depreciation
- −$1,277
- Taxable income
- $3,787
- Est. tax owed @ 24.0%
- −$909
- After-tax cash flow
- $3,327/yr
For passive investors: Depreciation is non-cash, so a rental often shows a tax loss while cash-flowing — sheltering income. Rental losses are passive: they offset passive income freely, and up to $25,000/yr can offset ordinary (W-2) income if you actively participate and your MAGI is under $100k (phasing out to $0 by $150k); unused losses carry forward. On sale, claimed depreciation is recaptured at up to 25%, and gains may owe capital-gains tax (a 1031 exchange can defer both). Figures are a year-1 estimate at your 24.0% rate — not tax advice; consult a CPA.
Schools (NCES district)
- District
- Centerville Community School District
- NCES district ID
- 1906750
- Math proficiency
- 57% ▼ -8.00%
- Reading proficiency
- 65% ▼ -5.00%
- Median HH income
- $35,401
- Composite
- 50.48/100
- National rank
- #1854
- State rank
- #251 of 289 in IA
Livability — Centerville
- Score
- 73/100
- State rank
- #277
- US rank
- #5375
Category grades
Schools grade is shown separately in the Schools card above.
Census & demographics
- Census place
- Centerville, IA
- Population (ZIP)
- 484
Population outlook (Appanoose County) Hauer SSP2
- Today (2025)
- 11,726 people
- By 2030
- 11,194 · -4.5%
- By 2040
- 10,063 · -14.2%
- By 2050
- 8,976 · -23.5%
- By 2075
- 6,785 · -42.1%
- By 2100
- 4,819 · -58.9%
Race, ethnicity, and origin ACS 2023
- Neighborhood character
- Predominantly White (93%)
- Race & ethnicity
- White 93% Hispanic / Latino 6% Two or more races 6%
- Hispanic origin (detail)
- Mexican 6%
- Common ancestry
- Italian 6% Romanian 4% Iranian 1%
Political lean MEDSL · Appanoose
- 2024 margin
- Solid R (+46.7) · D 26.1% · R 72.8% · Other 1.2%
- 2008→2024 swing
- -44.8pp toward R · 2008: -1.9pp · 2024: -46.7pp
- All cycles
- 2024: R+46.7 2020: R+40.2 2016: R+36.4 2012: R+3.5 2008: R+1.9
Not yet ingested
- Civics
- —
Market trends
- HPI YoY
- ▲ 2.52%
- Current HPI
- 80.1573
- Rent YoY
- —
- Metro
- —
- State GDP YoY
- ▲ 2.48%
- F500 in state
- 4
Industry mix (Fortune 500 HQ in IA)
| Industry | F500 HQs | Revenue |
|---|---|---|
| Financial Services | 1 | $16B |
|
||
| Retail / Convenience | 1 | $15B |
|
||
Price history
-1.3% since first listed9 events — show timeline
- 2026-06-01 Price Changed $39,000 SWIAR
- 2026-05-18 Price Changed $43,900 IAR
- 2026-05-18 Price Changed $43,900 SWIAR
- 2026-05-11 Listed $53,900 IAR
- 2026-05-11 Listed $53,900 SWIAR
- 2019-05-28 Sold (Public Records) $30,000 Public Records
- 2019-05-28 Sold (MLS) $30,000 IAR
- 2019-03-28 Listed $32,000 IAR
- 2018-09-17 Listed $39,500 IAR
Property tax history
+4.6%/yrLatest (2025): $1,066 · +1.3% YoY. Source: county tax records.
Cash-flow waterfall
monthlySold comps — $/sqft
last 12 mo · ≤1 miLoading sold comps…