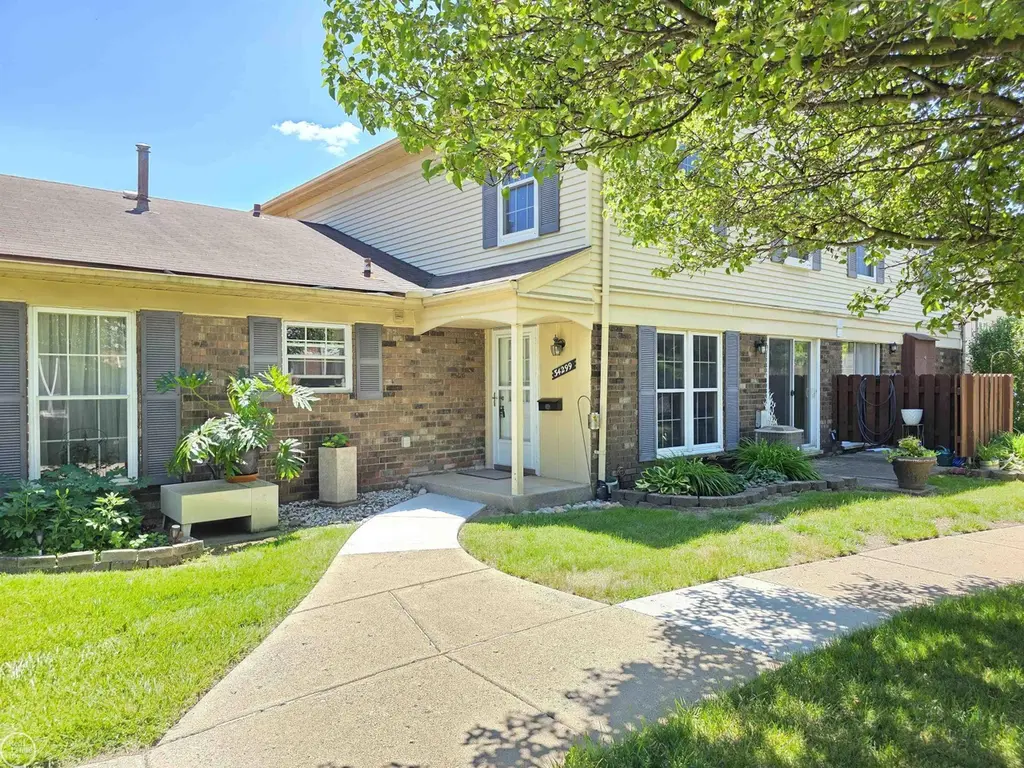
34299 Garfield Cir · Fraser, MI
Flood risk 8/10 · Major
- FEMA flood zone
- X (unshaded)
- Chance of flooding over 30 yrs
- 1.0%
- Est. flood insurance / yr
- $473 – $860
Fire risk 1/10 · Minimal
- Est. fire insurance / yr
- $784 – $1,456
Heat risk 3/10 · Minor
- Hot days now (above 96°F)
- 7 days/yr
- Hot days in 30 yrs
- 15 days/yr
Wind risk 1/10 · Minimal
- Chance of severe wind over 30 yrs
- —
Air-quality risk 3/10 · Minor
- Unhealthy air days now
- 3 days/yr
- Unhealthy air days in 30 yrs
- 4 days/yr
Risk factors via First Street. Map © Google.
Why this score? — see what drove the C grade
The composite is a weighted blend of 9 inputs, each scored 0–100. Each bar is that input's sub-score; the figure is the points it added to the 100-point composite (weight × sub-score).
- Cash flow +19.6/30.0
- 1% rule +8.3/10.0
- ARV discount +7.5/15.0
- DSCR +6.2/10.0
- Livability +4.0/5.0
- Condition / age +3.8/5.0
- Schools +3.2/10.0
- Rent growth +2.5/5.0
- Appreciation +0.0/10.0
$99,000
🖨 Deal sheet 📄 Offer letter ✓ Due diligence
Listing remarks
Well maintained 2-bedroom, 1 bath townhouse, centrally located off of Garfield in Fraser. Vinyl plank flooring throughout living room and dining room. Primary Bedroom has a large walk-in closet. First floor laundry. Central Air. Private Patio. Assigned Parking. All the conveniences of a condo at a great value!
Key facts
- $245 HOA
- Built 1971
- Listed 7 days
Property features AI
Finance
- Other: Property is in a residential zoning; Located in Fraser (city)
- HOA & community: Monthly association fee of $245; Association covers lawn maintenance, trash removal, water and sewer; Community grounds maintenance; Association contact phone available
Exterior
- Parking: Assigned parking spots: #179 and #180 (per directions)
- Utilities: Public water; Public sanitary sewer; Natural gas heating and gas water heater; Electric power (standard); Central A/C
- Home design: Condominium; 2-story; Built in 1971; Subdivision: Garfield Green
- Construction: Brick and vinyl siding exterior; Slab foundation
- Exterior features: Patio; Private road access; Pet policy: pets allowed (size limits may apply; call for details)
Interior
- Kitchen: Kitchen at entry level — approx. 8 x 7; Ceramic kitchen flooring; Range/oven; Refrigerator; Dishwasher
- Bedrooms: Bedroom 1 (Upper) — 16 x 10, carpet; Bedroom 2 (Upper) — 12 x 10, carpet
- Flooring: Carpet in bedrooms; Vinyl in dining room and living room; Ceramic in kitchen and bathroom
- Bathrooms: One full bathroom (Upper) with ceramic flooring — approx. 8 x 5
- Heating & cooling: Forced air heating; Central air conditioning
- Interior features: First-floor laundry; Living room; Dining room in an L-shape
- Laundry & utility: Washer; Dryer
Neighborhood map
What this means for you Summary
Snapshot
- This is a 2-bed/1.0-bath condo listed at $99k. Condition is rated good.
Deal economics
- At list price, monthly cash flow is $59 ($710/yr) — positive.
- The deal already cash-flows at list — no discount required.
- Meets the 1% rule at list price ($1k rent vs $99k).
- Cap rate 7.7% vs local median 3.5% in Fraser — top-decile yield for the area; either an underpriced asset or a hidden risk that comps aren't pricing in. Stress-test before assuming the spread holds.
Location & tenants
- Location reads 81/100 on livability (#68 in MI, #1,459 nationally) — a professional / high-income tenant draw. Strengths: cost of living A+, housing A+, commute A-; Watch: amenities F.
- Fraser Public Schools (suburban): math 31% / reading 43% proficiency, ranked #244 of 540 in MI (top 45%) — families likely to look elsewhere, expect single-tenant / working-renter base with shorter leases.
- Market conditions: 66 active listings in the ZIP; 14 comparable units currently listed for rent nearby; rentals at typical pace (median 24d on market — plan ~3-4 weeks tenant-placement turnaround); 1,321 units permitted in Macomb County in 2024 (86 in 5+ unit buildings).
Forward outlook
- Local home prices are declining (-3.0%/yr); year-one equity from $684 of loan paydown is wiped out by about $3k of value loss. Plan a longer hold.
- Macomb County population projected at +9% by 2050 — modest demand growth; plan on rents tracking national, not racing it.
Negotiation context
- Only 7 days on market — expect competitive offers; lowballing is unlikely to land.
- 2 sale attempts with the ask held roughly flat each time — persistent listings suggest the price (not the market) is what's stuck; bring a comps-based counter.
Risks & watch-outs
- Watch-outs: flood insurance adds $56/mo.
- Climate carrying-cost: severe flood risk — expect insurance premiums to compound above CPI over the hold.
Questions for the listing agent
- Built in 1971 — when were the roof, HVAC, electrical panel, plumbing, and water heater last replaced?
- What's the actual annual flood-insurance premium (NFIP or private), and is the property in a SFHA with mandatory coverage?
- What does the HOA fee cover, when was the last increase, and are there any pending special assessments or reserve-fund shortfalls?
- Any open or pending special assessments — roof, HVAC, plumbing, elevator, façade? What's the per-unit balance and payoff schedule, and is the seller paying it off at close or rolling it to the buyer?
- Is there a deadline driving the sale (1031 exchange, divorce, estate, relocation)? That informs how much negotiation room exists.
- Schools are B-rated — typically a magnet for longer-tenancy family renters. What's the average tenant stay here, and is there a school-zone premium baked into asking?
- What's the average days-on-market for RENTAL listings here right now (not sales)? A rising rental-DOM trend means longer vacancies and softer asking-rent achievability than the comps imply.
- What's the recent tenant-quality profile in this submarket — average credit score on applications, eviction rate, late-payment / NSF rate, and stable-employment percentage? A property-management company in the area should have these aggregated.
- How much new apartment / multifamily construction is in the pipeline within 1–3 miles? Heavy new supply (>2% of stock underway) typically softens rents 12–24 months out; light construction supports rent growth.
Investment metrics
- 1% rule
- 1.33% ✓
- Cap rate
- 7.68%
- Cash-on-cash
- 4.97%
- DSCR
- 1.22
- GRM
- 6.2
CMA / ARV
No comps found within radius.
Projected returns pro-forma
-3.0% appreciation · 3.0% rent growth · sell at horizon
- IRR
- -12.0%
- Equity multiple
- 0.56×
- Total profit
- $-12,069
- Equity at exit
- $14,761
- IRR
- -2.6%
- Equity multiple
- 0.83×
- Total profit
- $-4,826
- Equity at exit
- $8,560
Cash invested: $27,720 (down + closing). Projections, not guarantees.
Landlord ↔ Tenant lean methodology
- Overall (STATE)
- 62 Landlord-Friendly
- State Michigan
- 62 Landlord-Friendly · EVEN
- County
- — inherits STATE
- City
- — inherits STATE
ZIP-level market 48026
- Active inventory
- 66
- Price-to-rent
- 6.2×
Monthly cashflow live
- Estimated rent
- $1,321 high interval (Pro) →
- Mortgage (P&I)
- −$519
- Tax est. 1.5%
- −$124 /mo · $1,485/yr
- Insurance
- −$41
- Flood insurance flood zone
- −$56 /mo · $666/yr
- HOA
- −$245
- Vacancy / Maint / Mgmt
- −$277
- Net cashflow
- $59
Break-even live
UW: 25.0% down · 7.5% · 30yr · 1.5% tax · 5.0% vac · 8.0% maint · 8.0% mgmt
Financing live
Cash to close
- Down payment
- $24,750
- Closing costs
- $2,970
- Reserves months
- —
- Total cash needed
- —
Loan-product check · same deal, 3 products live
Conventional
25% down · 7.5% · 30yr
- Down + closing
- —
- Monthly P&I
- —
- Monthly cashflow
- —
- DSCR
- —
- Eligible?
- —
Personal DTI + credit; lowest rate.
DSCR
20% down · 8.5% · 30yr
- Down + closing
- —
- Monthly P&I
- —
- Monthly cashflow
- —
- DSCR
- —
- Eligible?
- —
No personal income docs; deal must DSCR.
Hard money
10% down · 12.0% · 12mo
- Down + closing
- —
- Monthly P&I
- —
- Monthly cashflow
- —
- DSCR
- —
- Eligible?
- —
Short-term bridge; refi at stabilization.
Rent comps 14 comps
| Address | Beds | Baths | Sqft | Rent | $/sqft | DOM | Units | Dist |
|---|---|---|---|---|---|---|---|---|
| 16525 Woodlane #138 Fraser, MI | 2.0 | 2.0 | 1061 | $1,400 | $1.32 | 43d | 1 | 0.25mi |
| 34632 Mercer Ln Fraser, MI | 2.0 | 1.0 | 894 | $1,295 | $1.45 | 2d | 1 | 0.29mi |
| 33630 Utica Rd Fraser, MI | 1.0 | 1.0 | 832 | $1,425 | $1.71 | 43d | 1 | 0.34mi |
| 34917 Hamilton Dr Fraser, MI | 2.0 | 1.0 | 800 | $1,395 | $1.74 | 24d | 1 | 0.36mi |
| 34673 Clarkson Dr E #78 Fraser, MI | 2.0 | 1.0 | 808 | $1,150 | $1.42 | 22d | 1 | 0.41mi |
| 16950 Kennedy Dr E Fraser, MI | 1.0–2.0 | 1.0 | 755 | $1,125 | $1.49 | 15d | 2 | 0.53mi |
| 16695 Washington Sq Clinton Twp, MI | 1.0–2.0 | 1.0 | 760 | $1,350 | $1.78 | 43d | 1 | 0.55mi |
| 16951 General Ave Fraser, MI | 2.0 | 1.0 | 900 | $1,250 | $1.39 | 5d | 1 | 0.95mi |
| 0 Woodland MDWS Update, MI | 1.0–2.0 | 1.0–2.0 | 1002 | $2,052 | $2.05 | 1d | 9 | 1.12mi |
| 18600 14 Mile Rd Fraser, MI | 2.0 | 1.0 | 1070 | $1,195 | $1.12 | 24d | 1 | 1.21mi |
| 36607 Holiday Cir E Clinton Twp, MI | 1.0–2.0 | 1.0 | 775 | $1,249 | $1.61 | 43d | 2 | 1.26mi |
| 32870 Kelly Rd Roseville, MI | 1.0 | 1.0 | 800 | $965 | $1.21 | 16d | 1 | 1.29mi |
| 18391 Masonic Apt 1 Fraser, MI | 2.0 | 1.0 | 720 | $995 | $1.38 | 16d | 1 | 1.37mi |
| 31577 Fraser Dr #3 Fraser, MI | 2.0 | 1.0 | 950 | $1,250 | $1.32 | 43d | 1 | 1.38mi |
HOA detail condo
- Monthly dues
- $245 · $2,940/yr
- Likely covers
- parking
- Assessments
- None detected in remarks — confirm with the listing agent.
Listing history 9 events
-
2026-06-19status $99,000 Pending 7 DOM
-
2026-06-18days on market $99,000 Active 7 DOM
-
2026-06-17days on market $99,000 Active 6 DOM
-
2026-06-16days on market $99,000 Active 5 DOM
-
2026-06-15days on market $99,000 Active 4 DOM
-
2026-06-13days on market $99,000 Active 2 DOM
-
2026-06-13status $99,000 Active 1 DOM
-
2026-06-10remarks 311-char remark
-
2026-06-10$99,000 Coming Soon 1 DOM
ⓘ Source: listings_history table (triggers on properties + properties_extension) + one-shot
backfill from property_details.listing_events for pre-trigger history.
Climate risk First Street
- Flood 8/10 Severe FEMA zone X (unshaded) · 100% chance over 30 yrs
- Wildfire 1/10 Low
- Heat 3/10 Moderate 7 d/yr ≥96°F today · 15 d/yr by 30 yrs out
- Wind 1/10 Low
- Air quality 3/10 Moderate 3 unhealthy d/yr today · 4 by 30 yrs out
Nearby sold comps map
Loading sold comps map…
Walkable amenities ~0.75 mi
Loading nearby amenities…
Taxation est. · year 1
- Rental income
- $15,856
- − Mortgage interest
- −$5,546
- − Property taxes
- −$1,485
- − Insurance
- −$1,162
- − Repairs & maintenance
- −$1,269
- − Management
- −$1,269
- − HOA
- −$2,940
- − Depreciation
- −$2,880
- Taxable loss
- −$693
- Est. tax savings @ 24.0%
- +$166
- After-tax cash flow
- $876/yr
For passive investors: Depreciation is non-cash, so a rental often shows a tax loss while cash-flowing — sheltering income. Rental losses are passive: they offset passive income freely, and up to $25,000/yr can offset ordinary (W-2) income if you actively participate and your MAGI is under $100k (phasing out to $0 by $150k); unused losses carry forward. On sale, claimed depreciation is recaptured at up to 25%, and gains may owe capital-gains tax (a 1031 exchange can defer both). Figures are a year-1 estimate at your 24.0% rate — not tax advice; consult a CPA.
Condition & rehab AI · 12 photos
A well-maintained 2-bedroom, 1-bath townhouse with good curb appeal and interior condition, ready for a fresh kitchen update and exterior paint to maximize value.
Repairs flagged
- Minor kitchen cabinets — Dated cabinetry could be updated for a fresh look.
Value-add opportunities
- Both Update kitchen cabinets — Fresh kitchen cabinets would enhance both resale and rental value.
- Both Paint exterior walls — Fresh paint would improve curb appeal and value.
- Both Landscaping — Enhanced landscaping would improve curb appeal and attract potential buyers/tenants.
Renovation cost estimate screening
| Repair item | Severity | Est. cost |
|---|---|---|
| kitchen cabinets · Dated cabinetry could be updated for a fresh look. | Minor | $500–3,000 |
| Total estimated repair cost · 1 items | $500–3,000 |
Value-add ROI direction
- Both Update kitchen cabinets — Fresh kitchen cabinets would enhance both resale and rental value. ↑
- Both Paint exterior walls — Fresh paint would improve curb appeal and value. ↑
- Both Landscaping — Enhanced landscaping would improve curb appeal and attract potential buyers/tenants. ↑
ⓘ Cost ranges are severity-bucket heuristics (US national rule-of-thumb). Get contractor quotes + a written scope before underwriting a rehab budget.
Schools (NCES district)
- District
- Fraser Public Schools
- NCES district ID
- 2614820
- Math proficiency
- 31% ▼ -12.00%
- Reading proficiency
- 43% ▼ -10.00%
- Median HH income
- $49,752
- Composite
- 31.94/100
- National rank
- #5846
- State rank
- #244 of 540 in MI
Livability — Fraser
- Score
- 81/100
- State rank
- #68
- US rank
- #1459
Category grades
Schools grade is shown separately in the Schools card above.
Census & demographics
- Census place
- Fraser, MI
- City population
- 14,604
- Population (ZIP)
- 14,604
Population outlook (Macomb County) Hauer SSP2
- Today (2025)
- 925,296 people
- By 2030
- 948,226 · +2.5%
- By 2040
- 983,961 · +6.3%
- By 2050
- 1,010,200 · +9.2%
- By 2075
- 1,076,222 · +16.3%
- By 2100
- 1,077,065 · +16.4%
Race, ethnicity, and origin ACS 2023
- Neighborhood character
- Predominantly White (81%)
- Race & ethnicity
- White 81% Black 9% Two or more races 6% Hispanic / Latino 3% Asian 2%
- Common ancestry
- Romanian 18% Lithuanian 3% Slovak 3%
- Foreign-born
- 7% · Canada, South Korea, China
- Languages at home
- 89% English-only · Other Indo-European 4% Arabic 2% Spanish 1%
Political lean MEDSL · Macomb
- 2024 margin
- R (+13.7) · D 42.2% · R 55.9% · Other 1.9%
- 2008→2024 swing
- -22.3pp toward R · 2008: 8.6pp · 2024: -13.7pp
- All cycles
- 2024: R+13.7 2020: R+8.1 2016: R+11.6 2012: D+4.0 2008: D+8.6
Not yet ingested
- Civics
- —
Market trends
- HPI YoY
- ▼ -210.50%
- Current HPI
- 184.7521
- Rent YoY
- —
- Metro
- —
- State GDP YoY
- ▲ 1.37%
- F500 in state
- 28
Industry mix (Fortune 500 HQ in MI)
| Industry | F500 HQs | Revenue |
|---|---|---|
| Automotive Parts | 3 | $48B |
|
||
| Automotive | 2 | $372B |
|
||
| Chemicals | 1 | $45B |
|
||
| Automotive Retail | 1 | $29B |
|
||
| Healthcare / Medical Devices | 1 | $23B |
|
||
| Automotive Technology | 1 | $20B |
|
||
Price history
+0.0% since first listed5 events — show timeline
- 2026-06-09 Coming Soon $99,000 MiRealSource-MiMLS
- 2026-06-09 Listing Removed — REALCOMP
- 2026-06-09 Listed $99,000 REALCOMP
- 2026-06-09 Listing Removed — MiRealSource-MiMLS
- 2026-06-09 Listed $99,000 MiRealSource-MiMLS
Cash-flow waterfall
monthlySold comps — $/sqft
last 12 mo · ≤1 miLoading sold comps…