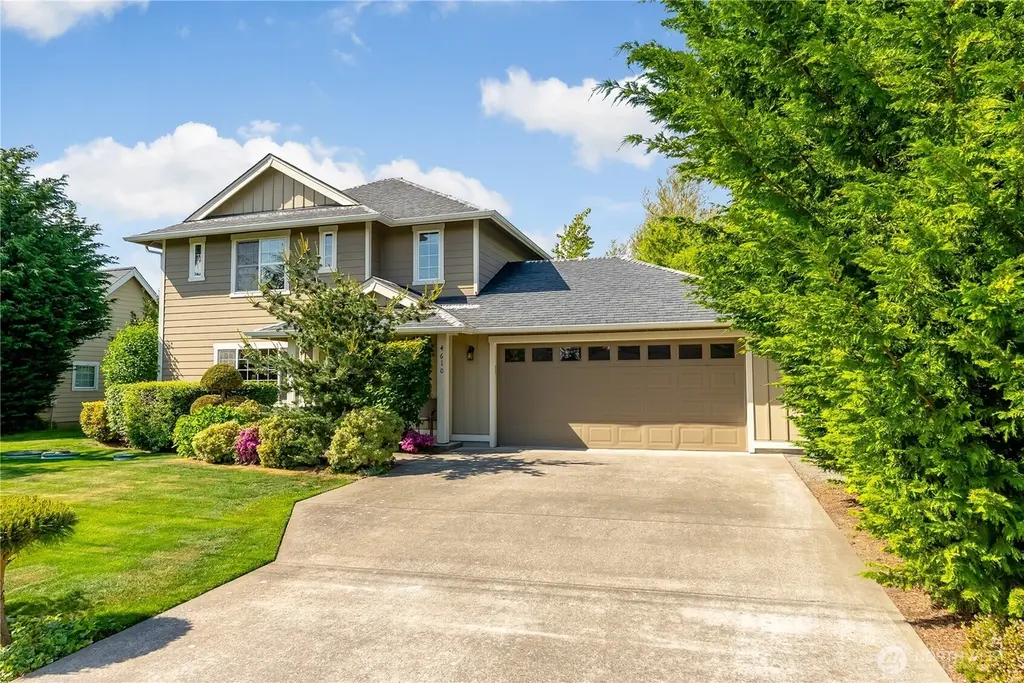
4610 Elmwood Dr · Blaine, WA
Flood risk 1/10 · Minimal
- FEMA flood zone
- X (unshaded)
- Chance of flooding over 30 yrs
- 0.0%
- Est. flood insurance / yr
- $507 – $1,088
Fire risk 1/10 · Minimal
- Est. fire insurance / yr
- $604 – $1,122
Heat risk 3/10 · Minor
- Hot days now (above 81°F)
- 7 days/yr
- Hot days in 30 yrs
- 19 days/yr
Wind risk 1/10 · Minimal
- Chance of severe wind over 30 yrs
- —
Air-quality risk 7/10 · Major
- Unhealthy air days now
- 11 days/yr
- Unhealthy air days in 30 yrs
- 11 days/yr
Risk factors via First Street. Map © Google.
Why this score? — see what drove the D grade
The composite is a weighted blend of 9 inputs, each scored 0–100. Each bar is that input's sub-score; the figure is the points it added to the 100-point composite (weight × sub-score).
- Appreciation +10.0/10.0
- ARV discount +9.9/15.0
- Cash flow +6.6/30.0
- Schools +4.7/10.0
- Livability +3.9/5.0
- Rent growth +3.3/5.0
- Condition / age +2.5/5.0
- DSCR +0.9/10.0
- 1% rule +0.7/10.0
$540,000
🖨 Deal sheet (PDF) 📄 Offer letter ✓ Due diligence
Listing remarks
Welcome to this beautiful 3-bedroom home just steps from the beach in the sought-after Harbor Shores Seaside Community! This well-maintained home features granite countertops in the kitchen and bathrooms, stainless steel appliances, a brand new garbage disposal, walk-in pantry, Luxury Vinyl Plank Flooring in the main living areas, and cozy carpeted bedrooms. A recently installed EV charger adds convenience in the garage. Enjoy the outdoors from your custom paver patio overlooking a private park-like backyard with over 100 hand-selected native trees. Several fruit trees as well including cherry, pear, apple, and peach trees. Beautifully landscaped and low maintenance, this serene setting is
Key facts
- Custom paver patio
- Granite countertops
- Walk-in pantry
Tags
Property features AI
Finance
- Financial info: Accepts Cash, Conventional, FHA, and VA financing
Exterior
- Parking: Attached garage; Covered parking for 2 vehicles
- Utilities: Electric energy source; Public water; STEP sewer; Power provided by PSE
- Home design: Single-family residence; Two-story house; Built on lot
- Construction: Cement plank (fiber cement) siding; Composition roof; Slab foundation; Built as a two-story house
- Exterior features: Cement-planked exterior; Patio; Electric car charging; Sidewalk; Fruit trees; Garden space; Wooded lot; Community waterfront / private beach access; Level topography; Has view
Interior
- Kitchen: Dishwasher; Garbage disposal; Microwave; Refrigerator; Stove/Range
- Bedrooms: 3 bedrooms (all on upper level); primary bedroom on second level
- Flooring: Ceramic tile; Hardwood; Vinyl plank; Carpet
- Bathrooms: 1 full bath; 1 three-quarter bath; 1 half bath
- Heating & cooling: Baseboard heating; No central air / cooling
- Interior features: Pantry; Living room; Dining room; Kitchen with eating space; Utility room
- Laundry & utility: Washer; Dryer; Utility room on main level
Neighborhood map
What this means for you Summary
Snapshot
- This is a 3-bed/2.5-bath single-family listed at $540k.
Deal economics
- At list price, monthly cash flow is $-885 ($-11k/yr) — negative.
- To cash-flow at today's rent, offer at most $384k (28.9% below list).
- To meet the 1% rule (rent ≥ 1% of price), the offer needs to be $309k (42.7% below list).
- Recommended offer: $309k (42.7% below list) — sets the bar for 1% rule.
- Cap rate 4.3% vs local median 2.2% in Blaine — top-decile yield for the area; either an underpriced asset or a hidden risk that comps aren't pricing in. Stress-test before assuming the spread holds.
Location & tenants
- Location reads 78/100 on livability (#125 in WA, #2,491 nationally) — a middle-class / working-renter tenant base. Strengths: commute A+, health & safety A+, housing A; Watch: amenities F, cost of living F.
- Blaine School District (town): math 49% / reading 55% proficiency, ranked #120 of 291 in WA (top 41%) — acceptable for families but not a draw, mixed tenant base, ~2y average lease.
- Zoned schools: Blaine Elementary School (463 students, 54% FRL); Blaine Middle School (459 students, 54% FRL); Blaine High School (609 students, 46% FRL) — zoned schools average 51% FRL vs 33% district-wide (18 pts higher); higher-poverty schools than district average — tighter screening recommended.
- Market conditions: Rents rising (+3.1%/yr); 461 active listings in the ZIP; 2 comparable units currently listed for rent nearby; solid renter incomes; 1,190 units permitted in Whatcom County in 2024 (327 in 5+ unit buildings).
- This rent runs 43% of the median local income ($87k/yr) — at the standard rent-burdened threshold; future hikes will face affordability resistance.
Forward outlook
- In year one you build about $58k of equity ($4k loan paydown + $54k appreciation (10.0% local appreciation)).
- Whatcom County population projected at +28% by 2050 — long-run rental-demand tailwind backs the buy-and-hold thesis.
- By year 2, paydown + projected appreciation supports a ~$93k cash-out refi (75% LTV) — recoverable capital for the next deal without selling this one.
Negotiation context
- It's been on market 30 days — a 2% lower offer ($532k) is reasonable based on typical stale-listing flexibility.
- 3 sale attempts since 13y ago with the ask held roughly flat each time — persistent listings suggest the price (not the market) is what's stuck; bring a comps-based counter.
- Current owner paid $247k; list at $540k implies a 119% gain — meaningful room to come down on a strong offer.
Questions for the listing agent
- What do current leases actually rent for vs. the listed asking? Can we see a recent rent roll and the last 12 months of T-12 income?
- Is there a deadline driving the sale (1031 exchange, divorce, estate, relocation)? That informs how much negotiation room exists.
- Schools are B-rated — typically a magnet for longer-tenancy family renters. What's the average tenant stay here, and is there a school-zone premium baked into asking?
- The area grade is low — what's the realistic commute time and amenity access for the typical tenant pool here? Any planned neighborhood developments (good or bad) we should know about?
- What's the average days-on-market for RENTAL listings here right now (not sales)? A rising rental-DOM trend means longer vacancies and softer asking-rent achievability than the comps imply.
- What's the recent tenant-quality profile in this submarket — average credit score on applications, eviction rate, late-payment / NSF rate, and stable-employment percentage? A property-management company in the area should have these aggregated.
- How much new for-sale + rental construction is in the pipeline within 1–3 miles? Heavy new supply typically softens prices + rents 12–24 months out; constrained supply supports both.
Investment metrics
- 1% rule
- 0.57% ✗
- Cap rate
- 4.33%
- Cash-on-cash
- -7.02%
- DSCR
- 0.69
- GRM
- 14.5
CMA / ARV
- ARV (on-the-fly)
- $570,768
- Comps found
- 6
Show comp detail 6 sales within ~0.75 mi
| Address | Dist | Beds/Ba | Sqft | Sold | Price | $/sf | Match |
|---|---|---|---|---|---|---|---|
| 4590 Elmwood Dr | 0.05mi | 3/2.5 | 1,500 (-1%) | 1mo | $569,000 | $379 | 95 |
| 4606 Hall Rd | 0.06mi | 3/2.0 | 1,712 (+13%) | 12mo | $530,000 | $310 | 64 |
| 1163 Rene Ct | 0.60mi | 3/2.5 | 1,584 (+4%) | 2mo | $620,000 | $391 | 63 |
| 1416 Wilson Ave | 0.55mi | 3/2.0 | 1,574 (+4%) | 12mo | $522,500 | $332 | 56 |
| 1323 Wilson Ave | 0.58mi | 3/2.0 | 1,418 (-7%) | 9mo | $532,500 | $376 | 52 |
| 1321 Wilson Ave | 0.60mi | 3/2.0 | 1,326 (-13%) | 11mo | $499,000 | $376 | 40 |
Match score weights: distance 35% · size 25% · config 20% · recency 20%. Top-matched comps best support the ARV.
Projected returns pro-forma
10.0% appreciation · 3.1% rent growth · sell at horizon
- IRR
- 19.3%
- Equity multiple
- 2.57×
- Total profit
- $237,850
- Equity at exit
- $486,475
- IRR
- 17.8%
- Equity multiple
- 5.93×
- Total profit
- $744,983
- Equity at exit
- $1,049,101
Cash invested: $151,200 (down + closing). Projections, not guarantees.
Landlord ↔ Tenant lean methodology
- Overall (STATE)
- 28 Tenant-Leaning
- State Washington
- 28 Tenant-Leaning · D+8
- County
- — inherits STATE
- City
- — inherits STATE
ZIP-level market 98230
- Home prices YoY
- 14.0%
- Rents YoY
- 3.1%
- Active inventory
- 461
- Price-to-rent
- 14.5×
Monthly cashflow live
- Estimated rent
- $3,093 medium interval (Pro) →
- Mortgage (P&I)
- −$2,832
- Tax from tax record
- −$272 /mo · $3,260/yr
- Insurance
- −$225
- HOA
- −$0
- Vacancy / Maint / Mgmt
- −$650
- Net cashflow
- $-885
Break-even live
Sensitivity live
| Price | -10% $-579 | -5% $-732 | +0% $-885 | +5% $-1,038 | +10% $-1,191 |
|---|---|---|---|---|---|
| Rent | -10% $-1,129 | -5% $-1,007 | +0% $-885 | +5% $-763 | +10% $-641 |
| Rate | -1.0pp $-613 | -0.5pp $-748 | base $-885 | +0.5pp $-1,025 | +1.0pp $-1,167 |
UW: 25.0% down · 7.5% · 30yr · 1.5% tax · 5.0% vac · 8.0% maint · 8.0% mgmt
Financing live
Cash to close
- Down payment
- $135,000
- Closing costs
- $16,200
- Reserves months
- —
- Total cash needed
- —
Loan-product check · same deal, 3 products live
Conventional
25% down · 7.5% · 30yr
- Down + closing
- —
- Monthly P&I
- —
- Monthly cashflow
- —
- DSCR
- —
- Eligible?
- —
Personal DTI + credit; lowest rate.
DSCR
20% down · 8.5% · 30yr
- Down + closing
- —
- Monthly P&I
- —
- Monthly cashflow
- —
- DSCR
- —
- Eligible?
- —
No personal income docs; deal must DSCR.
Hard money
10% down · 12.0% · 12mo
- Down + closing
- —
- Monthly P&I
- —
- Monthly cashflow
- —
- DSCR
- —
- Eligible?
- —
Short-term bridge; refi at stabilization.
Rent comps 2 comps
| Address | Beds | Baths | Sqft | Rent | $/sqft | DOM | Units | Dist |
|---|---|---|---|---|---|---|---|---|
| 1350 Mitchell Ave Blaine, WA | 2.0 | 1.0 | 1302 | $2,095 | $1.61 | 45d | 1 | 1.25mi |
| 8638 Harborview Rd Blaine, WA | 3.0 | 3.0 | 2200 | $4,250 | $1.93 | 15d | 1 | 1.26mi |
Listing history 24 events
-
2026-06-21days on market $540,000 Active 30 DOM
-
2026-06-18price $540,000 Active 27 DOM
-
2026-06-18days on market $550,000 Active 27 DOM
-
2026-06-17days on market $550,000 Active 26 DOM
-
2026-06-16days on market $550,000 Active 25 DOM
-
2026-06-15days on market $550,000 Active 24 DOM
-
2026-06-14days on market $550,000 Active 22 DOM
-
2026-06-13days on market $550,000 Active 21 DOM
-
2026-06-10days on market $550,000 Active 19 DOM
-
2026-06-09days on market $550,000 Active 18 DOM
-
2026-06-08days on market $550,000 Active 17 DOM
-
2026-06-07days on market $550,000 Active 16 DOM
-
2026-06-05days on market $550,000 Active 13 DOM
-
2026-06-02days on market $550,000 Active 11 DOM
-
2026-06-01days on market $550,000 Active 10 DOM
-
2026-05-31days on market $550,000 Active 9 DOM
-
2026-05-30days on market $550,000 Active 8 DOM
-
2026-05-22status Active
-
2026-05-21$550,000 Active
-
2013-11-15soldstatus $247,000 Sold
-
2013-10-29status Pending
-
2013-10-10status Pending Inspection
-
2013-09-17$249,900 Active
-
2005-10-19soldstatus $1,050,000
ⓘ Source: listings_history table (triggers on properties + properties_extension) + one-shot
backfill from property_details.listing_events for pre-trigger history.
Tax reassessment forecast WA · Resets to sale price
- Current annual tax
- $3,260 · $272/mo
- Projected year-2 tax
- $5,292 · $441/mo
- Expected delta
- +$2,032/yr (+$169/mo · 62.3%)
ⓘ Screening estimate from a state-policy table — verify with the county assessor before closing.
Climate risk First Street
- Flood 1/10 Low FEMA zone X (unshaded) · 0% chance over 30 yrs
- Wildfire 1/10 Low
- Heat 3/10 Moderate 7 d/yr ≥81°F today · 19 d/yr by 30 yrs out
- Wind 1/10 Low
- Air quality 7/10 Severe 11 unhealthy d/yr today · 11 by 30 yrs out
Nearby sold comps map
Loading sold comps map…
Walkable amenities ~0.75 mi
Loading nearby amenities…
Taxation est. · year 1
- Rental income
- $37,118
- − Mortgage interest
- −$30,248
- − Property taxes
- −$3,260
- − Insurance
- −$2,700
- − Repairs & maintenance
- −$2,969
- − Management
- −$2,969
- − Depreciation
- −$15,709
- Taxable loss
- −$20,738
- Est. tax savings @ 24.0%
- +$4,977
- After-tax cash flow
- $-5,641/yr
For passive investors: Depreciation is non-cash, so a rental often shows a tax loss while cash-flowing — sheltering income. Rental losses are passive: they offset passive income freely, and up to $25,000/yr can offset ordinary (W-2) income if you actively participate and your MAGI is under $100k (phasing out to $0 by $150k); unused losses carry forward. On sale, claimed depreciation is recaptured at up to 25%, and gains may owe capital-gains tax (a 1031 exchange can defer both). Figures are a year-1 estimate at your 24.0% rate — not tax advice; consult a CPA.
Schools (NCES district)
- District
- Blaine School District
- NCES district ID
- 5300570
- Math proficiency
- 49% ▼ -1.00%
- Reading proficiency
- 55% ▼ -2.00%
- Median HH income
- $57,085
- Composite
- 47.05/100
- National rank
- #5128
- State rank
- #120 of 291 in WA
Livability — Blaine
- Score
- 78/100
- State rank
- #125
- US rank
- #2491
Category grades
Schools grade is shown separately in the Schools card above.
Census & demographics
- County
- Whatcom County · 209,776 people
- Metro
- Bellingham, WA
- Population (ZIP)
- 18,744
- Household income
- $86,623
- Rent vs Own
- Severe rent burden
- 454.0
Population outlook (Whatcom County) Hauer SSP2
- Today (2025)
- 240,408 people
- By 2030
- 254,667 · +5.9%
- By 2040
- 281,365 · +17.0%
- By 2050
- 307,592 · +27.9%
- By 2075
- 375,576 · +56.2%
- By 2100
- 421,637 · +75.4%
Race, ethnicity, and origin ACS 2023
- Neighborhood character
- Predominantly White (77%)
- Race & ethnicity
- White 77% Two or more races 11% Hispanic / Latino 9% Asian 3% Pacific Islander 2% Black 1%
- Hispanic origin (detail)
- Mexican 5%
- Common ancestry
- Portuguese 6% Iranian 4% Lithuanian 3%
- Foreign-born
- 13% · Canada, China
- Languages at home
- 89% English-only · Spanish 4% Russian/Polish/Slavic 1% Other Indo-European 1%
Political lean MEDSL · Whatcom
- 2024 margin
- Strong D (+24.9) · D 60.8% · R 35.9% · Other 3.3%
- 2008→2024 swing
- +6.9pp toward D · 2008: 18.0pp · 2024: 24.9pp
- All cycles
- 2024: D+24.9 2020: D+23.9 2016: D+17.7 2012: D+12.1 2008: D+18.0
Not yet ingested
- Civics
- —
Market trends
- HPI YoY
- ▲ 106.58%
- Current HPI
- 868.68
- Rent YoY
- ▲ 3.10%
- Metro
- Bellingham, WA
- State GDP YoY
- ▲ 4.65%
- F500 in state
- 22
Industry mix (Fortune 500 HQ in WA)
| Industry | F500 HQs | Revenue |
|---|---|---|
| Retail | 2 | $269B |
|
||
| Technology / Retail | 1 | $638B |
|
||
| Technology | 1 | $245B |
|
||
| Telecommunications | 1 | $38B |
|
||
| Food / Beverage | 1 | $36B |
|
||
| Automotive / Trucks | 1 | $34B |
|
||
Price history
-47.6% since first listed7 events — show timeline
- 2026-05-22 Relisted — NWMLS as Distributed by MLS Grid
- 2026-05-21 Listed $550,000 NWMLS as Distributed by MLS Grid
- 2013-11-15 Sold (MLS) $247,000 NWMLS as Distributed by MLS Grid
- 2013-10-29 Pending — NWMLS as Distributed by MLS Grid
- 2013-10-10 Pending — NWMLS as Distributed by MLS Grid
- 2013-09-17 Listed $249,900 NWMLS as Distributed by MLS Grid
- 2005-10-19 Sold (Public Records) $1,050,000 Public Records
Property tax history
+16.8%/yrLatest (2026): $3,260 · +1.8% YoY. Source: county tax records.
Cash-flow waterfall
monthlySold comps — $/sqft
last 12 mo · ≤1 miLoading sold comps…