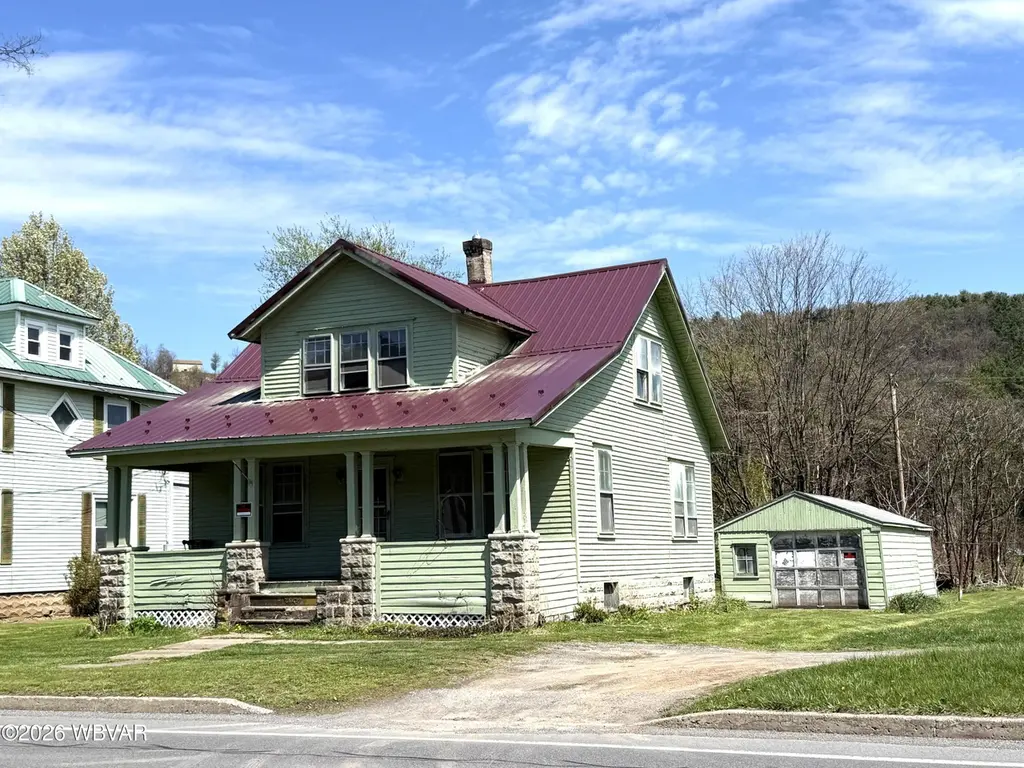
247 S Main St · Picture Rocks, PA
Flood risk 4/10 · Minor
- FEMA flood zone
- X (shaded)
- Chance of flooding over 30 yrs
- 0.23%
- Est. flood insurance / yr
- $473 – $860
Fire risk 2/10 · Minimal
- Est. fire insurance / yr
- $511 – $949
Heat risk 4/10 · Minor
- Hot days now (above 96°F)
- 8 days/yr
- Hot days in 30 yrs
- 17 days/yr
Wind risk 2/10 · Minimal
- Chance of severe wind over 30 yrs
- 3.0%
Air-quality risk 2/10 · Minimal
- Unhealthy air days now
- 0 days/yr
- Unhealthy air days in 30 yrs
- 1 days/yr
Risk factors via First Street. Map © Google.
Why this score? — see what drove the C grade
The composite is a weighted blend of 9 inputs, each scored 0–100. Each bar is that input's sub-score; the figure is the points it added to the 100-point composite (weight × sub-score).
- Cash flow +18.8/30.0
- ARV discount +7.5/15.0
- DSCR +5.9/10.0
- 1% rule +5.0/10.0
- Appreciation +5.0/10.0
- Schools +4.9/10.0
- Livability +3.6/5.0
- Rent growth +2.5/5.0
- Condition / age +2.2/5.0
$120,000
🖨 Deal sheet 📄 Offer letter ✓ Due diligence
Listing remarks
Make this home yours!! Many possibilties for this quaint bungalow on the outskirts of Picture Rocks. Wood floors, vintage cast iron sink and bathtub, good bones, garage, nice lot and just minutes to Hughesville. * * * Do not block half moon drive way! Park in front or on the side of the house. * * Proof of funds letter or bank pre-approval letter required. * * Under the eaves attic storage
Key facts
- Wood floors
- Quaint bungalow
- 9,148 sq ft lot
Tags
Property features AI
Finance
- Other: Zoning: RES
Exterior
- Parking: Gravel parking
- Utilities: Private well water; Electric with circuit breakers
- Home design: Residential property; Frame construction with wood siding
- Construction: Metal roof; Block foundation; Built as frame construction with wood siding
- Exterior features: Porch; Level lot
Interior
- Kitchen: Includes freezer
- Bedrooms: Total of 5 rooms (bedrooms count not specified)
- Flooring: Wood flooring; Vinyl flooring
- Bathrooms: 1 full bathroom
- Heating & cooling: Natural gas heating; Baseboard heating; No cooling
- Interior features: Freezer, Washer, Dryer; Wood and vinyl flooring; No fireplace
- Laundry & utility: Washer and dryer included
Neighborhood map
What this means for you Summary
Snapshot
- This is a 2-bed/1.0-bath single-family listed at $120k. Condition is rated fair.
Deal economics
- At list price, monthly cash flow is $122 ($1k/yr) — positive.
- The deal already cash-flows at list — no discount required.
- Meets the 1% rule at list price ($1k rent vs $120k).
Location & tenants
- Location reads 72/100 on livability (#667 in PA) — a middle-class / working-renter tenant base. Strengths: cost of living A+, housing A+, employment A; Watch: health & safety D, amenities F, commute F.
- East Lycoming SD (town): math 52% / reading 62% proficiency, ranked #93 of 539 in PA (top 17%) — acceptable for families but not a draw, mixed tenant base, ~2y average lease.
- Market conditions: 1 active listings in the ZIP; 73 units permitted in Lycoming County in 2024 (15 in 5+ unit buildings).
Forward outlook
- In year one you build about $4k of equity ($830 loan paydown + $4k appreciation (3.0% local appreciation)).
- Lycoming County population projected to shrink 10% by 2050 — rents likely to lag national; underwrite the cash flow, not the appreciation.
- At projected returns (3.0% appreciation + 3.0% rent growth), your $34k cash investment doubles in ~5 years — after that, you're playing with house money.
- By year 8, paydown + projected appreciation supports a ~$33k cash-out refi (75% LTV) — recoverable capital for the next deal without selling this one.
Negotiation context
- Only 10 days on market — expect competitive offers; lowballing is unlikely to land.
Risks & watch-outs
- Watch-outs: built in 1901 — expect roof / HVAC / electrical / plumbing capex.
Questions for the listing agent
- Have any recent inspections been done? Can we get a copy of the seller's disclosures and any deferred-maintenance estimates?
- Built in 1901 — when were the roof, HVAC, electrical panel, plumbing, and water heater last replaced?
- Is there a deadline driving the sale (1031 exchange, divorce, estate, relocation)? That informs how much negotiation room exists.
- Schools are A-rated — typically a magnet for longer-tenancy family renters. What's the average tenant stay here, and is there a school-zone premium baked into asking?
- What's the average days-on-market for RENTAL listings here right now (not sales)? A rising rental-DOM trend means longer vacancies and softer asking-rent achievability than the comps imply.
- What's the recent tenant-quality profile in this submarket — average credit score on applications, eviction rate, late-payment / NSF rate, and stable-employment percentage? A property-management company in the area should have these aggregated.
- How much new for-sale + rental construction is in the pipeline within 1–3 miles? Heavy new supply typically softens prices + rents 12–24 months out; constrained supply supports both.
Investment metrics
- 1% rule
- 1.00% ✓
- Cap rate
- 7.51%
- Cash-on-cash
- 4.35%
- DSCR
- 1.19
- GRM
- 8.3
CMA / ARV
- ARV (median comp)
- $299,449
- List price
- $120,000
- Delta
- -59.93%
- Verdict
- UNDERPRICED
- Comps
- 3 within 1.0 mi
Show comp detail 1 sale within ~0.75 mi
| Address | Dist | Beds/Ba | Sqft | Sold | Price | $/sf | Match |
|---|---|---|---|---|---|---|---|
| 64 Spring Rd | 0.57mi | 1/3.0 (-1) | 1,728 (+10%) | 7mo | $350,000 | $203 | 38 |
Match score weights: distance 35% · size 25% · config 20% · recency 20%. Top-matched comps best support the ARV.
Projected returns pro-forma
3.0% appreciation · 3.0% rent growth · sell at horizon
- IRR
- 11.6%
- Equity multiple
- 1.66×
- Total profit
- $22,234
- Equity at exit
- $53,957
- IRR
- 13.7%
- Equity multiple
- 3.03×
- Total profit
- $68,320
- Equity at exit
- $83,154
Cash invested: $33,600 (down + closing). Projections, not guarantees.
Landlord ↔ Tenant lean methodology
- Overall (STATE)
- 62 Landlord-Friendly
- State Pennsylvania
- 62 Landlord-Friendly · EVEN
- County
- — inherits STATE
- City
- — inherits STATE
ZIP-level market 17762
- Active inventory
- 1
- Price-to-rent
- 8.3×
Monthly cashflow live
- Estimated rent
- $1,204 medium interval (Pro) →
- Mortgage (P&I)
- −$629
- Tax est. 1.5%
- −$150 /mo · $1,800/yr
- Insurance
- −$50
- HOA
- −$0
- Vacancy / Maint / Mgmt
- −$253
- Net cashflow
- $122
Break-even live
UW: 25.0% down · 7.5% · 30yr · 1.5% tax · 5.0% vac · 8.0% maint · 8.0% mgmt
Financing live
Cash to close
- Down payment
- $30,000
- Closing costs
- $3,600
- Reserves months
- —
- Total cash needed
- —
Loan-product check · same deal, 3 products live
Conventional
25% down · 7.5% · 30yr
- Down + closing
- —
- Monthly P&I
- —
- Monthly cashflow
- —
- DSCR
- —
- Eligible?
- —
Personal DTI + credit; lowest rate.
DSCR
20% down · 8.5% · 30yr
- Down + closing
- —
- Monthly P&I
- —
- Monthly cashflow
- —
- DSCR
- —
- Eligible?
- —
No personal income docs; deal must DSCR.
Hard money
10% down · 12.0% · 12mo
- Down + closing
- —
- Monthly P&I
- —
- Monthly cashflow
- —
- DSCR
- —
- Eligible?
- —
Short-term bridge; refi at stabilization.
Listing history 2 events
-
2026-05-03status Pending 396-char remark
-
2026-04-20$120,000 Active 396-char remark
ⓘ Source: listings_history table (triggers on properties + properties_extension) + one-shot
backfill from property_details.listing_events for pre-trigger history.
Climate risk First Street
- Flood 4/10 Moderate FEMA zone X (shaded) · 23% chance over 30 yrs
- Wildfire 2/10 Low
- Heat 4/10 Moderate 8 d/yr ≥96°F today · 17 d/yr by 30 yrs out
- Wind 2/10 Low 3% chance of damaging wind over 30 yrs
- Air quality 2/10 Low 0 unhealthy d/yr today · 1 by 30 yrs out
Nearby sold comps map
Loading sold comps map…
Walkable amenities ~0.75 mi
Loading nearby amenities…
Taxation est. · year 1
- Rental income
- $14,448
- − Mortgage interest
- −$6,722
- − Property taxes
- −$1,800
- − Insurance
- −$600
- − Repairs & maintenance
- −$1,156
- − Management
- −$1,156
- − Depreciation
- −$3,491
- Taxable loss
- −$477
- Est. tax savings @ 24.0%
- +$114
- After-tax cash flow
- $1,577/yr
For passive investors: Depreciation is non-cash, so a rental often shows a tax loss while cash-flowing — sheltering income. Rental losses are passive: they offset passive income freely, and up to $25,000/yr can offset ordinary (W-2) income if you actively participate and your MAGI is under $100k (phasing out to $0 by $150k); unused losses carry forward. On sale, claimed depreciation is recaptured at up to 25%, and gains may owe capital-gains tax (a 1031 exchange can defer both). Figures are a year-1 estimate at your 24.0% rate — not tax advice; consult a CPA.
Condition & rehab AI · 13 photos
This quaint bungalow requires moderate renovations, primarily in the kitchen and bathroom, to significantly increase its resale and rental value. Exterior improvements would also enhance curb appeal.
Repairs flagged
- Major Kitchen floor — Exposed subfloor and damage indicate significant structural issue
- Major Bath floor — Exposed subfloor and damage indicate significant structural issue
- Minor Exterior siding — Photos don't show condition, but siding appears intact
- Minor Exterior roof — Photos don't show condition, but roof appears intact
- Minor Interior walls — Paint appears chipped, but photos don't show condition
Value-add opportunities
- Resale Kitchen renovation — Modern kitchen with updated appliances and cabinets would significantly increase appeal
- Resale Bathroom renovation — Modern bathroom with updated fixtures and flooring would significantly increase appeal
- Both Exterior painting and landscaping — Fresh paint and landscaping would improve curb appeal and increase both resale and rental value
Renovation cost estimate screening
| Repair item | Severity | Est. cost |
|---|---|---|
| Kitchen floor · Exposed subfloor and damage indicate significant structural issue | Major | $15,000–50,000 |
| Bath floor · Exposed subfloor and damage indicate significant structural issue | Major | $15,000–50,000 |
| Exterior siding · Photos don't show condition, but siding appears intact | Minor | $500–3,000 |
| Exterior roof · Photos don't show condition, but roof appears intact | Minor | $500–3,000 |
| Interior walls · Paint appears chipped, but photos don't show condition | Minor | $500–3,000 |
| Total estimated repair cost · 5 items | $31,500–109,000 |
Value-add ROI direction
- Resale Kitchen renovation — Modern kitchen with updated appliances and cabinets would significantly increase appeal ↑
- Resale Bathroom renovation — Modern bathroom with updated fixtures and flooring would significantly increase appeal ↑
- Both Exterior painting and landscaping — Fresh paint and landscaping would improve curb appeal and increase both resale and rental value ↑
ⓘ Cost ranges are severity-bucket heuristics (US national rule-of-thumb). Get contractor quotes + a written scope before underwriting a rehab budget.
Schools (NCES district)
- District
- East Lycoming SD
- NCES district ID
- 4208490
- Math proficiency
- 52% ▼ -12.00%
- Reading proficiency
- 62% ▼ -12.00%
- Median HH income
- $53,360
- Composite
- 48.88/100
- National rank
- #2083
- State rank
- #93 of 539 in PA
Livability — Picture Rocks
- Score
- 72/100
- State rank
- #667
- US rank
- #6510
Category grades
Schools grade is shown separately in the Schools card above.
Census & demographics
- Census place
- Picture Rocks, PA
- City population
- 560
- Population (ZIP)
- 560
Population outlook (Lycoming County) Hauer SSP2
- Today (2025)
- 114,164 people
- By 2030
- 112,221 · -1.7%
- By 2040
- 107,613 · -5.7%
- By 2050
- 102,950 · -9.8%
- By 2075
- 92,987 · -18.5%
- By 2100
- 80,924 · -29.1%
Race, ethnicity, and origin ACS 2023
- Neighborhood character
- Predominantly White (97%)
- Race & ethnicity
- White 97% Two or more races 3%
- Common ancestry
- Lithuanian 5% Italian 2% Serbian 2%
- Languages at home
- 98% English-only · Other Indo-European 2%
Political lean MEDSL · Lycoming
- 2024 margin
- Solid R (+41.5) · D 28.8% · R 70.3%
- 2008→2024 swing
- -17.3pp toward R · 2008: -24.2pp · 2024: -41.5pp
- All cycles
- 2024: R+41.5 2020: R+41.3 2016: R+44.8 2012: R+33.3 2008: R+24.2
Not yet ingested
- Civics
- —
Market trends
- HPI YoY
- —
- Current HPI
- —
- Rent YoY
- —
- Metro
- —
- State GDP YoY
- ▲ 1.68%
- F500 in state
- 34
Industry mix (Fortune 500 HQ in PA)
| Industry | F500 HQs | Revenue |
|---|---|---|
| Healthcare | 2 | $309B |
|
||
| Insurance | 2 | $27B |
|
||
| Telecommunications / Media | 1 | $124B |
|
||
| Industrial Distribution | 1 | $22B |
|
||
| Financial Services | 1 | $20B |
|
||
| Chemicals / Materials | 1 | $18B |
|
||
Price history
2 events — show timeline
- 2026-05-03 Pending — WBVAR
- 2026-04-20 Listed $120,000 WBVAR
Cash-flow waterfall
monthlySold comps — $/sqft
last 12 mo · ≤1 miLoading sold comps…