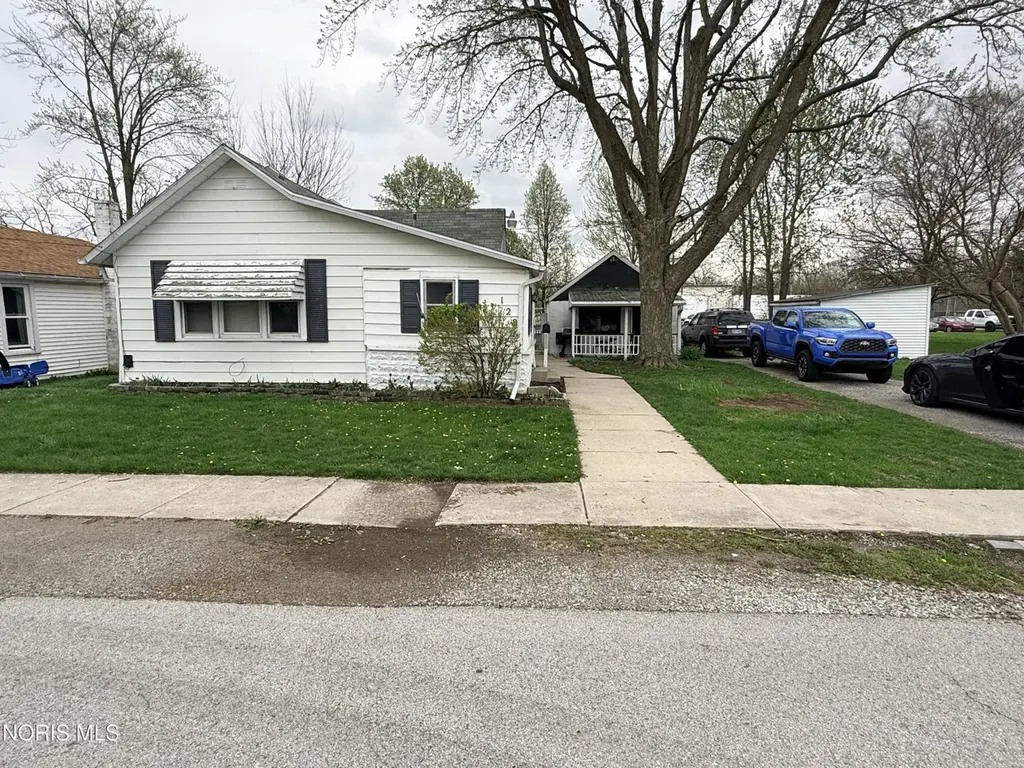
128 Zihlman Ave · North Baltimore, OH
Flood risk 1/10 · Minimal
- FEMA flood zone
- X (unshaded)
- Chance of flooding over 30 yrs
- 0.0%
- Est. flood insurance / yr
- $507 – $1,088
Fire risk 1/10 · Minimal
- Est. fire insurance / yr
- $713 – $1,323
Heat risk 3/10 · Minor
- Hot days now (above 99°F)
- 7 days/yr
- Hot days in 30 yrs
- 16 days/yr
Wind risk 2/10 · Minimal
- Chance of severe wind over 30 yrs
- —
Air-quality risk 2/10 · Minimal
- Unhealthy air days now
- 1 days/yr
- Unhealthy air days in 30 yrs
- 2 days/yr
Risk factors via First Street. Map © Google.
Why this score? — see what drove the B+ grade
The composite is a weighted blend of 9 inputs, each scored 0–100. Each bar is that input's sub-score; the figure is the points it added to the 100-point composite (weight × sub-score).
- Cash flow +30.0/30.0
- ARV discount +15.0/15.0
- DSCR +10.0/10.0
- 1% rule +9.9/10.0
- Schools +4.4/10.0
- Livability +3.9/5.0
- Rent growth +2.5/5.0
- Condition / age +2.5/5.0
- Appreciation +0.0/10.0
$74,900
🖨 Deal sheet 📄 Offer letter ✓ Due diligence
Listing remarks MLS
Located in North Baltimore, this home is a great opportunity for a first-time buyer or investor ready to bring new life to a property with plenty of promise. Offering two bedrooms with the possibility for a third, a large backyard, and a distinctive vintage garage, it has the space and character to become something truly special with the right vision and updates.
Key facts
- 6,098 sq ft lot
- Garage
- Built 1944
Neighborhood map
What this means for you Summary
Snapshot
- This is a 2-bed/1.0-bath single-family listed at $75k.
Deal economics
- At list price, monthly cash flow is $400 ($5k/yr) — positive.
- The deal already cash-flows at list — no discount required.
- Meets the 1% rule at list price ($1k rent vs $75k).
- Recommended offer: $73k (3.0% below list) — sets the bar for market timing.
- Cap rate 12.7% vs local median 5.9% in North Baltimore — top-decile yield for the area; either an underpriced asset or a hidden risk that comps aren't pricing in. Stress-test before assuming the spread holds.
Location & tenants
- Location reads 78/100 on livability (#159 in OH, #2,395 nationally) — a middle-class / working-renter tenant base. Strengths: cost of living A+, housing A+, health & safety A+; Watch: amenities F, commute F.
- North Baltimore Local (town): math 45% / reading 58% proficiency, ranked #424 of 656 in OH (top 65%) — acceptable for families but not a draw, mixed tenant base, ~2y average lease.
- Market conditions: 32 active listings in the ZIP; 493 units permitted in Wood County in 2024 (48 in 5+ unit buildings).
Forward outlook
- Local home prices are declining (-3.0%/yr); year-one equity from $518 of loan paydown is wiped out by about $2k of value loss. Plan a longer hold.
- Wood County population projected at +14% by 2050 — modest demand growth; plan on rents tracking national, not racing it.
- At projected returns (-3.0% appreciation + 3.0% rent growth), your $21k cash investment doubles in ~6 years — after that, you're playing with house money.
Negotiation context
- It's been on market 60 days — a 3% lower offer ($73k) is reasonable based on typical stale-listing flexibility.
- 2 sale attempts with the ask held roughly flat each time — persistent listings suggest the price (not the market) is what's stuck; bring a comps-based counter.
- Current owner paid $65k; 15% above their basis — modest negotiation headroom, anchor on the comps not their cost.
Risks & watch-outs
- Watch-outs: built in 1944 — expect roof / HVAC / electrical / plumbing capex.
Questions for the listing agent
- It's been on market 60 days. Have you received any prior offers? Is the seller open to a 3% concession, seller financing, or rate buy-down credit?
- Built in 1944 — when were the roof, HVAC, electrical panel, plumbing, and water heater last replaced?
- Is there a deadline driving the sale (1031 exchange, divorce, estate, relocation)? That informs how much negotiation room exists.
- Schools are B-rated — typically a magnet for longer-tenancy family renters. What's the average tenant stay here, and is there a school-zone premium baked into asking?
- What's the average days-on-market for RENTAL listings here right now (not sales)? A rising rental-DOM trend means longer vacancies and softer asking-rent achievability than the comps imply.
- What's the recent tenant-quality profile in this submarket — average credit score on applications, eviction rate, late-payment / NSF rate, and stable-employment percentage? A property-management company in the area should have these aggregated.
- How much new for-sale + rental construction is in the pipeline within 1–3 miles? Heavy new supply typically softens prices + rents 12–24 months out; constrained supply supports both.
Investment metrics
- 1% rule
- 1.49% ✓
- Cap rate
- 12.70%
- Cash-on-cash
- 22.88%
- DSCR
- 2.02
- GRM
- 5.6
CMA / ARV
- ARV (median comp)
- $140,466
- List price
- $74,900
- Delta
- -46.68%
- Verdict
- UNDERPRICED
- Comps
- 20 within 1.0 mi
Show comp detail 10 sales within ~0.75 mi
| Address | Dist | Beds/Ba | Sqft | Sold | Price | $/sf | Match |
|---|---|---|---|---|---|---|---|
| 109 Smith St | 0.14mi | 2/1.0 | 1,032 (+3%) | 6mo | $147,500 | $143 | 84 |
| 508 E Water St | 0.11mi | 2/1.0 | 944 (-6%) | 6mo | $85,000 | $90 | 80 |
| 115 N Beecher St | 0.27mi | 2/1.0 | 1,040 (+4%) | 12mo | $109,900 | $106 | 71 |
| 520 Eastview Dr | 0.71mi | 3/1.0 (+1) | 1,014 (+1%) | 4mo | $150,000 | $148 | 57 |
| 902 E South St | 0.25mi | 2/1.0 | 1,112 (+11%) | 17mo | $26,000 | $23 | 56 |
| 1000 E South St | 0.30mi | 3/1.0 (+1) | 897 (-11%) | 10mo | $152,000 | $169 | 55 |
| 212 N Gillette St | 0.32mi | 3/1.0 (+1) | 1,121 (+12%) | 20mo | $142,000 | $127 | 44 |
| 221 E Broadway St | 0.30mi | 3/1.0 (+1) | 1,134 (+13%) | 22mo | $151,500 | $134 | 41 |
| 524 Eastview Dr | 0.74mi | 3/1.0 (+1) | 1,014 (+1%) | 24mo | $135,000 | $133 | 39 |
| 522 Eastview Dr | 0.72mi | 3/1.0 (+1) | 1,066 (+6%) | 23mo | $180,000 | $169 | 32 |
Match score weights: distance 35% · size 25% · config 20% · recency 20%. Top-matched comps best support the ARV.
Projected returns pro-forma
-3.0% appreciation · 3.0% rent growth · sell at horizon
- IRR
- 15.8%
- Equity multiple
- 1.64×
- Total profit
- $13,329
- Equity at exit
- $11,168
- IRR
- 24.4%
- Equity multiple
- 3.12×
- Total profit
- $44,386
- Equity at exit
- $6,476
Cash invested: $20,972 (down + closing). Projections, not guarantees.
Landlord ↔ Tenant lean methodology
- Overall (STATE)
- 73 Landlord-Friendly
- State Ohio
- 73 Landlord-Friendly · R+6
- County
- — inherits STATE
- City
- — inherits STATE
ZIP-level market 45872
- Home prices YoY
- -11.5%
- Active inventory
- 32
- Price-to-rent
- 5.6×
Monthly cashflow live
- Estimated rent
- $1,117 medium interval (Pro) →
- Mortgage (P&I)
- −$393
- Tax from tax record
- −$59 /mo · $705/yr
- Insurance
- −$31
- HOA
- −$0
- Vacancy / Maint / Mgmt
- −$235
- Net cashflow
- $400
Break-even live
UW: 25.0% down · 7.5% · 30yr · 1.5% tax · 5.0% vac · 8.0% maint · 8.0% mgmt
Financing live
Cash to close
- Down payment
- $18,725
- Closing costs
- $2,247
- Reserves months
- —
- Total cash needed
- —
Loan-product check · same deal, 3 products live
Conventional
25% down · 7.5% · 30yr
- Down + closing
- —
- Monthly P&I
- —
- Monthly cashflow
- —
- DSCR
- —
- Eligible?
- —
Personal DTI + credit; lowest rate.
DSCR
20% down · 8.5% · 30yr
- Down + closing
- —
- Monthly P&I
- —
- Monthly cashflow
- —
- DSCR
- —
- Eligible?
- —
No personal income docs; deal must DSCR.
Hard money
10% down · 12.0% · 12mo
- Down + closing
- —
- Monthly P&I
- —
- Monthly cashflow
- —
- DSCR
- —
- Eligible?
- —
Short-term bridge; refi at stabilization.
Listing history 20 events
-
2026-06-18days on market $74,900 Active 60 DOM
-
2026-06-17days on market $74,900 Active 59 DOM
-
2026-06-16days on market $74,900 Active 58 DOM
-
2026-06-15days on market $74,900 Active 57 DOM
-
2026-06-13days on market $74,900 Active 55 DOM
-
2026-06-12days on market $74,900 Active 54 DOM
-
2026-06-09days on market $74,900 Active 51 DOM
-
2026-06-08days on market $74,900 Active 50 DOM
-
2026-06-08days on market $74,900 Active 49 DOM
-
2026-06-07days on market $74,900 Active 48 DOM
-
2026-06-04days on market $74,900 Active 45 DOM
-
2026-06-02days on market $74,900 Active 44 DOM
-
2026-06-01days on market $74,900 Active 43 DOM
-
2026-05-31days on market $74,900 Active 42 DOM
-
2026-04-19$74,900 Active 365-char remark
Show marketing remark (365 chars)
Located in North Baltimore, this home is a great opportunity for a first-time buyer or investor ready to bring new life to a property with plenty of promise. Offering two bedrooms with the possibility for a third, a large backyard, and a distinctive vintage garage, it has the space and character to become something truly special with the right vision and updates.
-
2026-04-16historical $74,900 365-char remark
Show marketing remark (365 chars)
Located in North Baltimore, this home is a great opportunity for a first-time buyer or investor ready to bring new life to a property with plenty of promise. Offering two bedrooms with the possibility for a third, a large backyard, and a distinctive vintage garage, it has the space and character to become something truly special with the right vision and updates.
-
2025-12-23soldstatus $65,000 Closed 459-char remark
Show marketing remark (459 chars)
Welcome to North Baltimore! With a little bit of love, this charming home has the potential to shine - whether you're a first-time homebuyer or an investor looking for your next opportunity. Featuring two bedrooms with the potential of for a third, a spacious backyard, and a neat historical garage, there's plenty of room to make this home your own. Don't miss the chance to add your personal touch and bring out the full potential of this inviting property!
-
2025-09-25historical Contingent 459-char remark
Show marketing remark (459 chars)
Welcome to North Baltimore! With a little bit of love, this charming home has the potential to shine - whether you're a first-time homebuyer or an investor looking for your next opportunity. Featuring two bedrooms with the potential of for a third, a spacious backyard, and a neat historical garage, there's plenty of room to make this home your own. Don't miss the chance to add your personal touch and bring out the full potential of this inviting property!
-
2025-08-28$79,900 Active 459-char remark
Show marketing remark (459 chars)
Welcome to North Baltimore! With a little bit of love, this charming home has the potential to shine - whether you're a first-time homebuyer or an investor looking for your next opportunity. Featuring two bedrooms with the potential of for a third, a spacious backyard, and a neat historical garage, there's plenty of room to make this home your own. Don't miss the chance to add your personal touch and bring out the full potential of this inviting property!
-
2020-09-04soldstatus $40,000
ⓘ Source: listings_history table (triggers on properties + properties_extension) + one-shot
backfill from property_details.listing_events for pre-trigger history.
Tax reassessment forecast OH · Partial reset (capped growth)
- Current annual tax
- $705 · $59/mo
- Projected year-2 tax
- $937 · $78/mo
- Expected delta
- +$232/yr (+$19/mo · 32.8%)
ⓘ Screening estimate from a state-policy table — verify with the county assessor before closing.
Climate risk First Street
- Flood 1/10 Low FEMA zone X (unshaded) · 0% chance over 30 yrs
- Wildfire 1/10 Low
- Heat 3/10 Moderate 7 d/yr ≥99°F today · 16 d/yr by 30 yrs out
- Wind 2/10 Low
- Air quality 2/10 Low 1 unhealthy d/yr today · 2 by 30 yrs out
Nearby sold comps map
Loading sold comps map…
Walkable amenities ~0.75 mi
Loading nearby amenities…
Taxation est. · year 1
- Rental income
- $13,408
- − Mortgage interest
- −$4,196
- − Property taxes
- −$705
- − Insurance
- −$374
- − Repairs & maintenance
- −$1,073
- − Management
- −$1,073
- − Depreciation
- −$2,179
- Taxable income
- $3,808
- Est. tax owed @ 24.0%
- −$914
- After-tax cash flow
- $3,885/yr
For passive investors: Depreciation is non-cash, so a rental often shows a tax loss while cash-flowing — sheltering income. Rental losses are passive: they offset passive income freely, and up to $25,000/yr can offset ordinary (W-2) income if you actively participate and your MAGI is under $100k (phasing out to $0 by $150k); unused losses carry forward. On sale, claimed depreciation is recaptured at up to 25%, and gains may owe capital-gains tax (a 1031 exchange can defer both). Figures are a year-1 estimate at your 24.0% rate — not tax advice; consult a CPA.
Schools (NCES district)
- District
- North Baltimore Local
- NCES district ID
- 3905070
- Math proficiency
- 45% ▼ -21.00%
- Reading proficiency
- 58% ▼ -12.00%
- Median HH income
- $47,242
- Composite
- 43.72/100
- National rank
- #2951
- State rank
- #424 of 656 in OH
Livability — North Baltimore
- Score
- 78/100
- State rank
- #159
- US rank
- #2395
Category grades
Schools grade is shown separately in the Schools card above.
Census & demographics
- Census place
- North Baltimore, OH
- County
- Wood · 127,168 people
- City population
- 4,572
- Metro
- Toledo, OH
- Population (ZIP)
- 4,572
- Household income
- $62,380
- Rent vs Own
- Severe rent burden
- 3.8
Population outlook (Wood County) Hauer SSP2
- Today (2025)
- 138,744 people
- By 2030
- 143,189 · +3.2%
- By 2040
- 150,896 · +8.8%
- By 2050
- 158,589 · +14.3%
- By 2075
- 182,166 · +31.3%
- By 2100
- 196,533 · +41.7%
Race, ethnicity, and origin ACS 2023
- Neighborhood character
- Predominantly White (94%)
- Race & ethnicity
- White 94% Hispanic / Latino 4% Two or more races 2% Black 2%
- Common ancestry
- Iranian 4% Romanian 2% Slovak 1%
- Foreign-born
- 0%
- Languages at home
- 98% English-only · Spanish 2%
Political lean MEDSL · Wood
- 2024 margin
- R (+10.2) · D 44.4% · R 54.6%
- 2008→2024 swing
- -17.3pp toward R · 2008: 7.1pp · 2024: -10.2pp
- All cycles
- 2024: R+10.2 2020: R+7.6 2016: R+8.5 2012: D+4.2 2008: D+7.1
Not yet ingested
- Civics
- —
Market trends
- HPI YoY
- ▼ -29.19%
- Current HPI
- 225.1072
- Rent YoY
- —
- Metro
- —
- State GDP YoY
- ▲ 1.98%
- F500 in state
- 48
Industry mix (Fortune 500 HQ in OH)
| Industry | F500 HQs | Revenue |
|---|---|---|
| Insurance | 3 | $145B |
|
||
| Industrial Machinery | 3 | $49B |
|
||
| Financial Services | 3 | $24B |
|
||
| Consumer Goods | 2 | $93B |
|
||
| Aerospace / Defense | 2 | $47B |
|
||
| Utilities | 2 | $33B |
|
||
Price history
+87.2% since first listed6 events — show timeline
- 2026-04-19 Listed $74,900 NORIS
- 2026-04-16 Coming Soon $74,900 NORIS
- 2025-12-23 Sold (MLS) $65,000 NORIS
- 2025-09-25 Contingent — NORIS
- 2025-08-28 Listed $79,900 NORIS
- 2020-09-04 Sold (Public Records) $40,000 Public Records
Property tax history
+16.9%/yrLatest (2025): $705 · +1.4% YoY. Source: county tax records.
Cash-flow waterfall
monthlySold comps — $/sqft
last 12 mo · ≤1 miLoading sold comps…