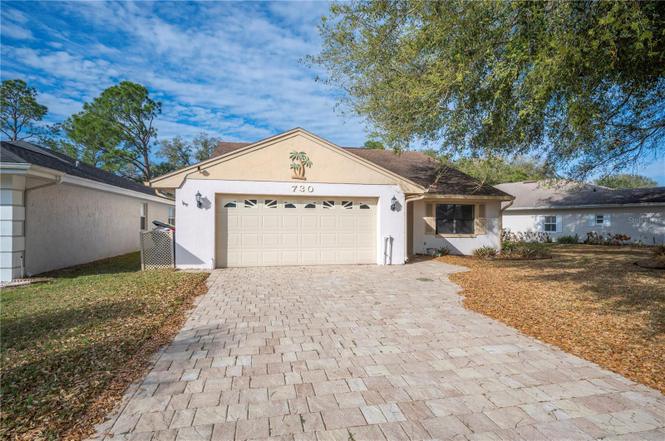
730 Canberra Rd · Winter Haven, FL
Flood risk 1/10 · Minimal
- FEMA flood zone
- X (unshaded)
- Chance of flooding over 30 yrs
- 0.0%
- Est. flood insurance / yr
- $507 – $1,088
Fire risk 3/10 · Minor
- Est. fire insurance / yr
- $947 – $1,759
Heat risk 8/10 · Major
- Hot days now (above 108°F)
- 7 days/yr
- Hot days in 30 yrs
- 25 days/yr
Wind risk 9/10 · Severe
- Chance of severe wind over 30 yrs
- 99.0%
Air-quality risk 1/10 · Minimal
- Unhealthy air days now
- 0 days/yr
- Unhealthy air days in 30 yrs
- 0 days/yr
Risk factors via First Street. Map © Google.
Why this score? — see what drove the D- grade
The composite is a weighted blend of 9 inputs, each scored 0–100. Each bar is that input's sub-score; the figure is the points it added to the 100-point composite (weight × sub-score).
- Cash flow +12.4/30.0
- ARV discount +7.5/15.0
- DSCR +3.7/10.0
- Livability +3.7/5.0
- Schools +3.5/10.0
- 1% rule +3.4/10.0
- Rent growth +3.0/5.0
- Condition / age +2.5/5.0
- Appreciation +0.0/10.0
$225,000
🖨 Deal sheet (PDF) 📄 Offer letter ✓ Due diligence
Listing remarks
The property you are inquiring about is located in Winter Haven, FL, in the Cypresswood area of Polk County. This is a price induced-to-sell home, located in a gated, guarded, golfing community. This is on the fairway so no backyard neighbors, and in a private, peaceful setting. This is a 2-bedrrom, 2-bath, 1,571 sq. ft. home with an open area concept. This house is looking for new owners to make it their own. Divided bedrooms, country-dine in kitchen, plus a gathering room for desired use. Additional enclosed lanai for added space, plus an oversized 2-car garage. Easy to view - call, text, email, and see it today! * Agents, please read MLS remarks. *
Key facts
- Gated community
- Clubhouse
- Private fairway view
Tags
Property features AI
Finance
- Other: Total acreage approximately 0.15 acres (less than 1/4 acre)
- Financial info: No lease restrictions indicated; Property is homesteaded
- HOA & community: Has HOA; annual association fee of $200 and a second annual association fee of $1,482 (monthly HOA amount listed as $16.67); Community amenities include clubhouse, golf, and pool; Pets allowed
Exterior
- Parking: Driveway; 2-car attached garage with opener
- Utilities: Public water; Public sewer; Water connected
- Home design: Single family residence; One story; South-facing
- Construction: Block and stucco construction; Shingle roof; Slab foundation; Built as residential (single family)
- Exterior features: Other exterior features; Paved road access
Interior
- Kitchen: Dishwasher; Microwave; Range; Refrigerator
- Bedrooms: 2 bedrooms
- Flooring: Carpet; Tile; Vinyl
- Bathrooms: 2 full bathrooms
- Heating & cooling: Central heating; Central air conditioning
- Interior features: Ceiling fans; Blinds and curtain rods
- Laundry & utility: Laundry area (other)
Neighborhood map
What this means for you Summary
Snapshot
- This is a 2-bed/2.0-bath single-family listed at $225k.
Deal economics
- At list price, monthly cash flow is $-38 ($-452/yr) — negative.
- To cash-flow at today's rent, offer at most $218k (3.0% below list).
- To meet the 1% rule (rent ≥ 1% of price), the offer needs to be $189k (16.2% below list).
- Recommended offer: $189k (16.2% below list) — sets the bar for 1% rule.
Location & tenants
- Location reads 74/100 on livability (#291 in FL, #4,898 nationally) — a middle-class / working-renter tenant base. Strengths: cost of living A+, housing A+, health & safety A; Watch: schools C-, employment C-, amenities F.
- Polk (suburban): math 39% / reading 43% proficiency, ranked #62 of 73 in FL (top 85%) — families likely to look elsewhere, expect single-tenant / working-renter base with shorter leases.
- Market conditions: Rents rising (+1.9%/yr); 680 active listings in the ZIP; 9 comparable units currently listed for rent nearby; rentals at typical pace (median 25d on market — plan ~3-4 weeks tenant-placement turnaround); 10,384 units permitted in Polk County in 2024 (1,716 in 5+ unit buildings).
- This rent runs 32% of the median local income ($70k/yr) — at the standard rent-burdened threshold; future hikes will face affordability resistance.
Forward outlook
- Local home prices are declining (-3.0%/yr); year-one equity from $2k of loan paydown is wiped out by about $7k of value loss. Plan a longer hold.
- Polk County population projected at +33% by 2050 — long-run rental-demand tailwind backs the buy-and-hold thesis.
Negotiation context
- It's been on market 53 days — a 3% lower offer ($218k) is reasonable based on typical stale-listing flexibility.
- 3 sale attempts; this cycle's ask has dropped $25k (10%) from the opening price — seller is motivated, your offer sets the floor, not the list.
- Current owner paid $106k; list at $225k implies a 112% gain — meaningful room to come down on a strong offer.
Risks & watch-outs
- Climate carrying-cost: severe wind risk, 99% chance of damaging wind over 30y; extreme-heat days projected 7→25/yr by 2055 (HVAC capex compounding) — expect insurance premiums to compound above CPI over the hold.
Questions for the listing agent
- What do current leases actually rent for vs. the listed asking? Can we see a recent rent roll and the last 12 months of T-12 income?
- It's been on market 53 days. Have you received any prior offers? Is the seller open to a 16% concession, seller financing, or rate buy-down credit?
- What does the HOA fee cover, when was the last increase, and are there any pending special assessments or reserve-fund shortfalls?
- Is there a deadline driving the sale (1031 exchange, divorce, estate, relocation)? That informs how much negotiation room exists.
- The area grade is low — what's the realistic commute time and amenity access for the typical tenant pool here? Any planned neighborhood developments (good or bad) we should know about?
- What's the average days-on-market for RENTAL listings here right now (not sales)? A rising rental-DOM trend means longer vacancies and softer asking-rent achievability than the comps imply.
- What's the recent tenant-quality profile in this submarket — average credit score on applications, eviction rate, late-payment / NSF rate, and stable-employment percentage? A property-management company in the area should have these aggregated.
- How much new for-sale + rental construction is in the pipeline within 1–3 miles? Heavy new supply typically softens prices + rents 12–24 months out; constrained supply supports both.
Investment metrics
- 1% rule
- 0.84% ✗
- Cap rate
- 6.09%
- Cash-on-cash
- -0.72%
- DSCR
- 0.97
- GRM
- 9.9
CMA / ARV
No comps found within radius.
Projected returns pro-forma
-3.0% appreciation · 1.9% rent growth · sell at horizon
- IRR
- -18.7%
- Equity multiple
- 0.35×
- Total profit
- $-40,911
- Equity at exit
- $33,548
- IRR
- -13.4%
- Equity multiple
- 0.25×
- Total profit
- $-46,952
- Equity at exit
- $19,454
Cash invested: $63,000 (down + closing). Projections, not guarantees.
Landlord ↔ Tenant lean methodology
- Overall (STATE)
- 87 Strongly Landlord-Friendly
- State Florida
- 87 Strongly Landlord-Friendly · R+3
- County
- — inherits STATE
- City
- — inherits STATE
ZIP-level market 33884
- Home prices YoY
- -34.1%
- Rents YoY
- 1.9%
- Active inventory
- 680
- Price-to-rent
- 9.9×
Monthly cashflow live
- Estimated rent
- $1,886 high interval (Pro) →
- Mortgage (P&I)
- −$1,180
- Tax from tax record
- −$114 /mo · $1,363/yr
- Insurance
- −$94
- HOA
- −$140
- Vacancy / Maint / Mgmt
- −$396
- Net cashflow
- $-38
Break-even live
Sensitivity live
| Price | -10% $90 | -5% $26 | +0% $-38 | +5% $-101 | +10% $-165 |
|---|---|---|---|---|---|
| Rent | -10% $-187 | -5% $-112 | +0% $-38 | +5% $37 | +10% $111 |
| Rate | -1.0pp $76 | -0.5pp $20 | base $-38 | +0.5pp $-96 | +1.0pp $-155 |
UW: 25.0% down · 7.5% · 30yr · 1.5% tax · 5.0% vac · 8.0% maint · 8.0% mgmt
Financing live
Cash to close
- Down payment
- $56,250
- Closing costs
- $6,750
- Reserves months
- —
- Total cash needed
- —
Loan-product check · same deal, 3 products live
Conventional
25% down · 7.5% · 30yr
- Down + closing
- —
- Monthly P&I
- —
- Monthly cashflow
- —
- DSCR
- —
- Eligible?
- —
Personal DTI + credit; lowest rate.
DSCR
20% down · 8.5% · 30yr
- Down + closing
- —
- Monthly P&I
- —
- Monthly cashflow
- —
- DSCR
- —
- Eligible?
- —
No personal income docs; deal must DSCR.
Hard money
10% down · 12.0% · 12mo
- Down + closing
- —
- Monthly P&I
- —
- Monthly cashflow
- —
- DSCR
- —
- Eligible?
- —
Short-term bridge; refi at stabilization.
Rent comps 9 comps
| Address | Beds | Baths | Sqft | Rent | $/sqft | DOM | Units | Dist |
|---|---|---|---|---|---|---|---|---|
| 612 Turnberry Ct Winter Haven, FL | 3.0 | 2.0 | 1578 | $1,695 | $1.07 | 24d | 1 | 0.24mi |
| 443 Sandestin Dr Winter Haven, FL | 3.0 | 2.0 | 2136 | $2,039 | $0.95 | 4d | 1 | 0.35mi |
| 36 Enclave Dr Winter Haven, FL | 3.0 | 2.0 | 1532 | $1,990 | $1.30 | 24d | 1 | 0.58mi |
| 702 Lemon Ave Dundee, FL | 3.0 | 2.0 | 1198 | $1,800 | $1.50 | 15d | 1 | 0.82mi |
| 2065 Whispering Trails Blvd Winter Haven, FL | 3.0 | 2.0 | 1432 | $2,000 | $1.40 | 15d | 1 | 0.92mi |
| 604 Lime Ave Dundee, FL | 3.0 | 3.0 | 1694 | $2,400 | $1.42 | 24d | 1 | 0.95mi |
| 2845 Whispering Trails Dr Winter Haven, FL | 3.0 | 2.0 | 1553 | $1,800 | $1.16 | 24d | 1 | 1.00mi |
| 217 Betty Ave S Dundee, FL | 3.0 | 2.0 | 1150 | $1,650 | $1.43 | 24d | 1 | 1.14mi |
| 567 Cody Caleb Dr Winter Haven, FL | 3.0 | 2.0 | 1642 | $1,899 | $1.16 | 24d | 1 | 1.20mi |
HOA detail
- Monthly dues
- $140 · $1,680/yr
- Likely covers
- security
Listing history 10 events
-
2026-05-11status Pending
-
2026-04-28status Active
-
2026-04-28price $225,000
-
2026-04-11status Pending
-
2026-04-11historical
-
2026-03-09status Active
-
2026-03-04status Pending
-
2026-02-24$250,000 Active
-
2000-12-19soldstatus $106,000
-
1987-12-01soldstatus $88,800
ⓘ Source: listings_history table (triggers on properties + properties_extension) + one-shot
backfill from property_details.listing_events for pre-trigger history.
Tax reassessment forecast FL · Resets to sale price
- Current annual tax
- $1,363 · $114/mo
- Projected year-2 tax
- $1,868 · $156/mo
- Expected delta
- +$505/yr (+$42/mo · 37.0%)
ⓘ Screening estimate from a state-policy table — verify with the county assessor before closing.
Climate risk First Street
- Flood 1/10 Low FEMA zone X (unshaded) · 0% chance over 30 yrs
- Wildfire 3/10 Moderate
- Heat 8/10 Severe 7 d/yr ≥108°F today · 25 d/yr by 30 yrs out
- Wind 9/10 Extreme 99% chance of damaging wind over 30 yrs
- Air quality 1/10 Low 0 unhealthy d/yr today · 0 by 30 yrs out
Nearby sold comps map
Loading sold comps map…
Walkable amenities ~0.75 mi
Loading nearby amenities…
Taxation est. · year 1
- Rental income
- $22,626
- − Mortgage interest
- −$12,603
- − Property taxes
- −$1,363
- − Insurance
- −$1,125
- − Repairs & maintenance
- −$1,810
- − Management
- −$1,810
- − HOA
- −$1,680
- − Depreciation
- −$6,545
- Taxable loss
- −$4,310
- Est. tax savings @ 24.0%
- +$1,034
- After-tax cash flow
- $583/yr
For passive investors: Depreciation is non-cash, so a rental often shows a tax loss while cash-flowing — sheltering income. Rental losses are passive: they offset passive income freely, and up to $25,000/yr can offset ordinary (W-2) income if you actively participate and your MAGI is under $100k (phasing out to $0 by $150k); unused losses carry forward. On sale, claimed depreciation is recaptured at up to 25%, and gains may owe capital-gains tax (a 1031 exchange can defer both). Figures are a year-1 estimate at your 24.0% rate — not tax advice; consult a CPA.
Schools (NCES district)
- District
- Polk
- NCES district ID
- 1201590
- Math proficiency
- 39% ▼ -11.00%
- Reading proficiency
- 43% ▼ -4.00%
- Median HH income
- $43,979
- Composite
- 34.74/100
- National rank
- #5132
- State rank
- #62 of 73 in FL
Livability — Winter Haven
- Score
- 74/100
- State rank
- #291
- US rank
- #4898
Category grades
Schools grade is shown separately in the Schools card above.
Census & demographics
- County
- Polk County · 740,051 people
- City population
- 121,740
- Metro
- Lakeland-Winter Haven, FL
- Population (ZIP)
- 37,561
- Household income
- $70,443
- Rent vs Own
- Severe rent burden
- 949.0
Population outlook (Polk County) Hauer SSP2
- Today (2025)
- 752,975 people
- By 2030
- 804,621 · +6.9%
- By 2040
- 906,117 · +20.3%
- By 2050
- 1,000,476 · +32.9%
- By 2075
- 1,197,520 · +59.0%
- By 2100
- 1,271,518 · +68.9%
Race, ethnicity, and origin ACS 2023
- Neighborhood character
- Diverse neighborhood (Simpson 0.55)
- Race & ethnicity
- White 63% Hispanic / Latino 19% Black 14% Two or more races 7% Asian 2%
- Hispanic origin (detail)
- Mexican 2% Puerto Rican 10% Cuban 2%
- Common ancestry
- Romanian 2% Lithuanian 2% Hispanic 2%
- Foreign-born
- 7% · Canada, Jamaica
- Languages at home
- 84% English-only · Spanish 12% French/Haitian/Cajun 1% Other Indo-European 1%
Political lean MEDSL · Polk
- 2024 margin
- Strong R (+20.7) · D 39.2% · R 59.9%
- 2008→2024 swing
- -14.6pp toward R · 2008: -6.1pp · 2024: -20.7pp
- All cycles
- 2024: R+20.7 2020: R+14.4 2016: R+14.1 2012: R+6.8 2008: R+6.1
Not yet ingested
- Civics
- —
Market trends
- HPI YoY
- ▼ -134.69%
- Current HPI
- 260.1421
- Rent YoY
- ▲ 1.90%
- Metro
- Lakeland-Winter Haven, FL
- State GDP YoY
- ▲ 3.28%
- F500 in state
- 36
Industry mix (Fortune 500 HQ in FL)
| Industry | F500 HQs | Revenue |
|---|---|---|
| Industrial Technology | 2 | $29B |
|
||
| Insurance | 2 | $17B |
|
||
| Retail | 1 | $60B |
|
||
| Technology Distribution | 1 | $58B |
|
||
| Homebuilding | 1 | $35B |
|
||
| Technology Manufacturing | 1 | $35B |
|
||
Price history
+153.4% since first listed10 events — show timeline
- 2026-05-11 Pending — Stellar MLS as Distributed by MLS Grid
- 2026-04-28 Relisted — Stellar MLS as Distributed by MLS Grid
- 2026-04-28 Price Changed $225,000 Stellar MLS as Distributed by MLS Grid
- 2026-04-11 Pending — Stellar MLS as Distributed by MLS Grid
- 2026-04-11 Listing Removed — Stellar MLS as Distributed by MLS Grid
- 2026-03-09 Relisted — Stellar MLS as Distributed by MLS Grid
- 2026-03-04 Pending — Stellar MLS as Distributed by MLS Grid
- 2026-02-24 Listed $250,000 Stellar MLS as Distributed by MLS Grid
- 2000-12-19 Sold (Public Records) $106,000 Public Records
- 1987-12-01 Sold (Public Records) $88,800 Public Records
Property tax history
+4.1%/yrLatest (2025): $1,363 · +13.0% YoY. Source: county tax records.
Cash-flow waterfall
monthlySold comps — $/sqft
last 12 mo · ≤1 miLoading sold comps…