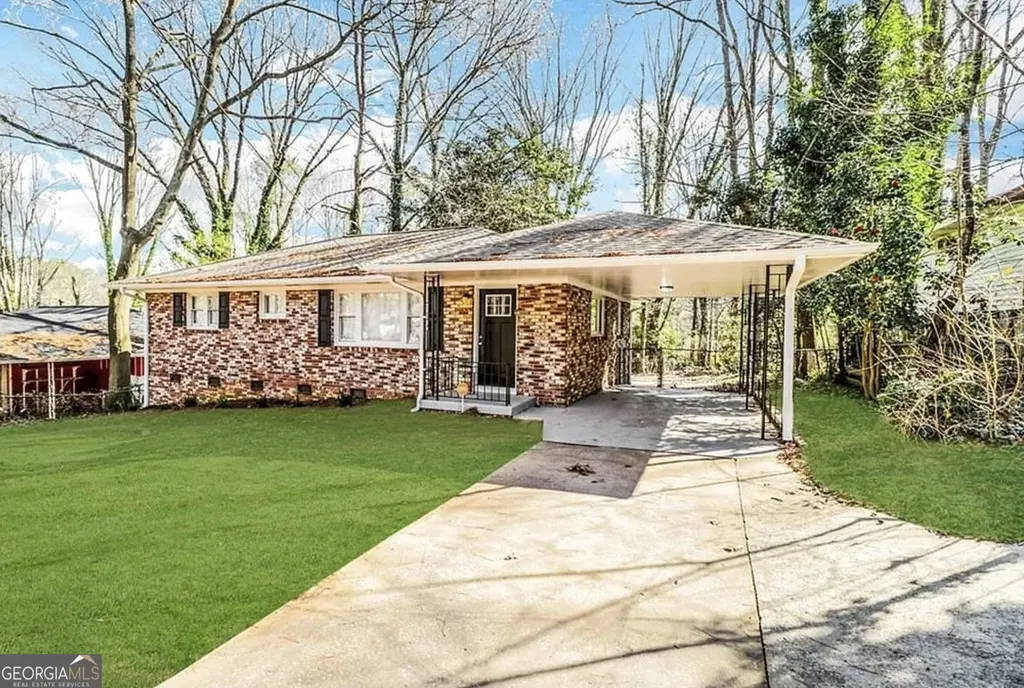
2748 Bonnybrook Dr SW · Atlanta, GA
Flood risk 1/10 · Minimal
- FEMA flood zone
- X (unshaded)
- Chance of flooding over 30 yrs
- 0.0%
- Est. flood insurance / yr
- $473 – $860
Fire risk 1/10 · Minimal
- Est. fire insurance / yr
- $963 – $1,789
Heat risk 5/10 · Moderate
- Hot days now (above 103°F)
- 7 days/yr
- Hot days in 30 yrs
- 18 days/yr
Wind risk 6/10 · Moderate
- Chance of severe wind over 30 yrs
- 27.0%
Air-quality risk 3/10 · Minor
- Unhealthy air days now
- 3 days/yr
- Unhealthy air days in 30 yrs
- 3 days/yr
Risk factors via First Street. Map © Google.
Why this score? — see what drove the C- grade
The composite is a weighted blend of 9 inputs, each scored 0–100. Each bar is that input's sub-score; the figure is the points it added to the 100-point composite (weight × sub-score).
- Cash flow +17.1/30.0
- ARV discount +15.0/15.0
- DSCR +5.3/10.0
- 1% rule +4.5/10.0
- Livability +4.2/5.0
- Schools +2.7/10.0
- Rent growth +2.5/5.0
- Condition / age +2.5/5.0
- Appreciation +0.0/10.0
$183,300
🖨 Deal sheet (PDF) 📄 Offer letter ✓ Due diligence
Listing remarks MLS
Cute as a button, Won't last long BRICK 3 bedroom 1 bath with fenced yard in town, ready to go (Don't miss the 3D Matterport tour) no FHA, no blind offers, Agent is Manager for the Seller.
Key facts
- Large level lot
- Updated flooring
- Granite countertops
Tags
Property features AI
Finance
- Other: Lot size approximately 0.28 acres (public records)
- HOA & community: No HOA; No association fees
Exterior
- Parking: Carport
- Security: Smoke detector(s)
- Utilities: Public water; Public sewer; Cable available
- Home design: Single-family house; Residential property; One story; Resale property; Subdivision: Bonnybrook Estates
- Construction: Brick construction; Composition roof; Built in 1959; Crawl space foundation
- Exterior features: Deck; Patio; Porch; Private lot
Interior
- Kitchen: Dishwasher
- Bedrooms: 3 bedrooms on the main level
- Flooring: Hardwood flooring; Tile flooring
- Bathrooms: 1 full bathroom (main level)
- Heating & cooling: Forced air heating; Other heating; Ceiling fan(s); Other cooling
- Interior features: Other interior features; One-level layout; Crawl space basement
- Laundry & utility: Other laundry features
Neighborhood map
What this means for you Summary
Snapshot
- This is a 3-bed/1.0-bath single-family listed at $183k.
Deal economics
- At list price, monthly cash flow is $128 ($2k/yr) — positive.
- The deal already cash-flows at list — no discount required.
- To meet the 1% rule (rent ≥ 1% of price), the offer needs to be $175k (4.7% below list).
- Recommended offer: $175k (4.7% below list) — sets the bar for 1% rule.
- Cap rate 7.1% vs local median 3.1% in Atlanta — top-decile yield for the area; either an underpriced asset or a hidden risk that comps aren't pricing in. Stress-test before assuming the spread holds.
Location & tenants
- Location reads 83/100 on livability (#6 in GA, #919 nationally) — a professional / high-income tenant draw. Strengths: amenities A+, commute A+, housing A+; Watch: cost of living C-.
- Atlanta Public Schools (urban): math 28% / reading 35% proficiency, ranked #80 of 174 in GA (top 46%) — families likely to look elsewhere, expect single-tenant / working-renter base with shorter leases; 71% free/reduced lunch — lower-income household profile, screen leases tightly.
- Zoned schools: Continental Colony Elementary School (math 2% / reading 2%, grade F, #1,204 of 1,228 statewide, top 100%, 371 students, 100% FRL); Ralph Bunche Middle School (math 2% / reading 12%, grade F, #449 of 470 statewide, top 97%, 824 students, 100% FRL); D. M. Therrell High School (math 5% / reading 10%, grade F, #378 of 424 statewide, top 91%, 973 students, 100% FRL) — zoned schools average 100% FRL vs 71% district-wide (29 pts higher); higher-poverty schools than district average — tighter screening recommended.
- Zoned-school proficiency averages 6% at this address vs 32% district-wide (-26 pts) — the specific schools serving this property underperform the Atlanta Public Schools average; the district grade overstates school quality for this exact location.
- Market conditions: Rents soft (-0.2%/yr); 245 active listings in the ZIP; 37 comparable units currently listed for rent nearby; rentals at typical pace (median 23d on market — plan ~3-4 weeks tenant-placement turnaround); 11,565 units permitted in Fulton County in 2024 (8,159 in 5+ unit buildings).
Forward outlook
- Local home prices are declining (-3.0%/yr); year-one equity from $1k of loan paydown is wiped out by about $5k of value loss. Plan a longer hold.
- Fulton County population projected at +38% by 2050 — long-run rental-demand tailwind backs the buy-and-hold thesis.
Negotiation context
- It's been on market 56 days — a 3% lower offer ($178k) is reasonable based on typical stale-listing flexibility.
- 11 sale attempts since 12y ago; this cycle's ask has dropped $20k (10%) from the opening price — seller is motivated, your offer sets the floor, not the list.
- Current owner paid $129k; 42% above their basis — modest negotiation headroom, anchor on the comps not their cost.
Risks & watch-outs
- Watch-outs: built in 1959 — expect roof / HVAC / electrical / plumbing capex.
- Climate carrying-cost: major wind risk, 27% chance of damaging wind over 30y; extreme-heat days projected 7→18/yr by 2055 (HVAC capex compounding) — expect insurance premiums to compound above CPI over the hold.
Questions for the listing agent
- It's been on market 56 days. Have you received any prior offers? Is the seller open to a 5% concession, seller financing, or rate buy-down credit?
- Built in 1959 — when were the roof, HVAC, electrical panel, plumbing, and water heater last replaced?
- Is there a deadline driving the sale (1031 exchange, divorce, estate, relocation)? That informs how much negotiation room exists.
- What's the average days-on-market for RENTAL listings here right now (not sales)? A rising rental-DOM trend means longer vacancies and softer asking-rent achievability than the comps imply.
- What's the recent tenant-quality profile in this submarket — average credit score on applications, eviction rate, late-payment / NSF rate, and stable-employment percentage? A property-management company in the area should have these aggregated.
- How much new for-sale + rental construction is in the pipeline within 1–3 miles? Heavy new supply typically softens prices + rents 12–24 months out; constrained supply supports both.
Investment metrics
- 1% rule
- 0.95% ✗
- Cap rate
- 7.13%
- Cash-on-cash
- 2.98%
- DSCR
- 1.13
- GRM
- 8.7
CMA / ARV
- ARV (median comp)
- $229,653
- List price
- $183,300
- Delta
- -20.18%
- Verdict
- UNDERPRICED
- Comps
- 20 within 1.0 mi
Show comp detail 12 sales within ~0.75 mi
| Address | Dist | Beds/Ba | Sqft | Sold | Price | $/sf | Match |
|---|---|---|---|---|---|---|---|
| 2818 Connally Dr SW | 0.13mi | 3/1.5 | 1,092 (-2%) | 4mo | $110,000 | $101 | 85 |
| 2715 Connally Dr SW | 0.04mi | 3/1.5 | 1,140 (+2%) | 11mo | $170,000 | $149 | 84 |
| 2537 Bonnybrook Dr SW | 0.23mi | 3/1.5 | 1,050 (-6%) | 10mo | $173,000 | $165 | 68 |
| 2126 Ivydale St | 0.62mi | 3/1.0 | 1,100 (-2%) | 0mo | $163,000 | $148 | 68 |
| 2665 Ivydale Ct SW | 0.41mi | 3/2.0 | 1,184 (+6%) | 1mo | $250,000 | $211 | 67 |
| 2670 Ivydale Ct SW | 0.36mi | 3/2.0 | 1,184 (+6%) | 4mo | $250,000 | $211 | 66 |
| 2826 Ben Hill Rd | 0.53mi | 3/2.0 | 1,116 (-0%) | 11mo | $145,000 | $130 | 62 |
| 2178 Maxwell Dr SW | 0.26mi | 3/2.0 | 1,246 (+11%) | 8mo | $258,000 | $207 | 58 |
| 2309 Bryant Dr | 0.39mi | 3/1.5 | 1,238 (+11%) | 5mo | $155,000 | $125 | 58 |
| 2261 Headland Ter | 0.69mi | 3/2.0 | 1,146 (+2%) | 13mo | $190,000 | $166 | 49 |
| 1937 Windsor Dr SW | 0.71mi | 3/1.5 | 1,212 (+8%) | 9mo | $188,500 | $156 | 43 |
| 1939 Sandringham Dr SW | 0.68mi | 3/2.0 | 1,242 (+11%) | 11mo | $295,000 | $238 | 36 |
Match score weights: distance 35% · size 25% · config 20% · recency 20%. Top-matched comps best support the ARV.
Projected returns pro-forma
-3.0% appreciation · 0.0% rent growth · sell at horizon
- IRR
- -15.0%
- Equity multiple
- 0.48×
- Total profit
- $-26,683
- Equity at exit
- $27,331
- IRR
- -12.4%
- Equity multiple
- 0.37×
- Total profit
- $-32,495
- Equity at exit
- $15,848
Cash invested: $51,324 (down + closing). Projections, not guarantees.
Landlord ↔ Tenant lean methodology
- Overall (STATE)
- 90 Strongly Landlord-Friendly
- State Georgia
- 90 Strongly Landlord-Friendly · R+3
- County
- — inherits STATE
- City
- — inherits STATE
ZIP-level market 30311
- Home prices YoY
- -33.3%
- Rents YoY
- -0.2%
- Active inventory
- 245
- Price-to-rent
- 8.7×
Monthly cashflow live
- Estimated rent
- $1,748 high interval (Pro) →
- Mortgage (P&I)
- −$961
- Tax from tax record
- −$215 /mo · $2,585/yr
- Insurance
- −$76
- HOA
- −$0
- Vacancy / Maint / Mgmt
- −$367
- Net cashflow
- $128
Break-even live
Sensitivity live
| Price | -10% $231 | -5% $179 | +0% $128 | +5% $76 | +10% $24 |
|---|---|---|---|---|---|
| Rent | -10% $-11 | -5% $59 | +0% $128 | +5% $197 | +10% $266 |
| Rate | -1.0pp $220 | -0.5pp $174 | base $128 | +0.5pp $80 | +1.0pp $32 |
UW: 25.0% down · 7.5% · 30yr · 1.5% tax · 5.0% vac · 8.0% maint · 8.0% mgmt
Financing live
Cash to close
- Down payment
- $45,825
- Closing costs
- $5,499
- Reserves months
- —
- Total cash needed
- —
Loan-product check · same deal, 3 products live
Conventional
25% down · 7.5% · 30yr
- Down + closing
- —
- Monthly P&I
- —
- Monthly cashflow
- —
- DSCR
- —
- Eligible?
- —
Personal DTI + credit; lowest rate.
DSCR
20% down · 8.5% · 30yr
- Down + closing
- —
- Monthly P&I
- —
- Monthly cashflow
- —
- DSCR
- —
- Eligible?
- —
No personal income docs; deal must DSCR.
Hard money
10% down · 12.0% · 12mo
- Down + closing
- —
- Monthly P&I
- —
- Monthly cashflow
- —
- DSCR
- —
- Eligible?
- —
Short-term bridge; refi at stabilization.
Rent comps 37 comps
| Address | Beds | Baths | Sqft | Rent | $/sqft | DOM | Units | Dist |
|---|---|---|---|---|---|---|---|---|
| 2641 Connally Dr East Point, GA | 2.0 | 1.0 | 1000 | $1,500 | $1.50 | 44d | 1 | 0.18mi |
| 2675 Headland Dr Atlanta, GA | 3.0 | 2.0 | 1408 | $1,600 | $1.14 | 18d | 1 | 0.20mi |
| 2467 Calvin Ave Atlanta, GA | 3.0 | 2.0 | 1200 | $1,950 | $1.62 | 25d | 1 | 0.53mi |
| 2909 Campbellton Rd SW Atlanta, GA | 1.0–3.0 | 1.0–2.0 | 917 | $1,299 | $1.42 | 25d | 1 | 0.55mi |
| 2640 Campbellton Rd SW Atlanta, GA | 1.0–2.0 | 1.0 | 775 | $899 | $1.16 | 8d | 1 | 0.57mi |
| 2900 Landrum Dr SW Atlanta, GA | 2.0–3.0 | 2.0 | 1045 | $1,472 | $1.41 | 18d | 6 | 0.75mi |
| 1994 Bent Creek Way SW Atlanta, GA | 1.0–3.0 | 1.0–2.0 | 1041 | $1,455 | $1.40 | 8d | 1 | 0.78mi |
| 2514 Riggs Dr Atlanta, GA | 4.0 | 2.0 | 1274 | $2,000 | $1.57 | 44d | 1 | 0.85mi |
| 2610 Harmony Way Atlanta, GA | 3.0 | 1.0 | 1100 | $1,095 | $1.00 | 25d | 1 | 0.85mi |
| 1788 Dodson Dr SW Atlanta, GA | 3.0 | 2.0 | 1212 | $1,950 | $1.61 | 14d | 1 | 0.87mi |
| 2039 Bent Creek Way SW Atlanta, GA | 1.0–2.0 | 1.0 | 898 | $1,200 | $1.34 | 8d | 1 | 0.87mi |
| 2284 Headland Dr Atlanta, GA | 3.0 | 3.5 | 1117 | $1,502 | $1.34 | 13d | 1 | 0.89mi |
| 2400 Campbellton Rd SW Atlanta, GA | 1.0–3.0 | 1.0–2.5 | 1350 | $1,450 | $1.07 | 8d | 2 | 0.91mi |
| 2400 Campbellton Rd SW Atlanta, GA | 2.0–3.0 | 1.5–2.5 | 1237 | $1,450 | $1.17 | 17d | 3 | 0.91mi |
| 2400 Campbellton Rd SW Atlanta, GA | 2.0 | 2.0 | 1125 | $1,250 | $1.11 | 25d | 1 | 0.91mi |
| 2656 Westchester Dr Atlanta, GA | 3.0 | 1.0 | 1025 | $1,600 | $1.56 | 20d | 1 | 0.97mi |
| 2523 Ben Hill Rd Atlanta, GA | 3.0 | 1.5 | 1412 | $3,000 | $2.12 | 22d | 1 | 0.99mi |
| 2328 Campbellton Rd SW Atlanta, GA | 1.0–3.0 | 1.0–2.0 | 1014 | $1,400 | $1.38 | 25d | 9 | 1.01mi |
| 2560 Wood Valley Dr Atlanta, GA | 4.0 | 2.5 | 1141 | $1,900 | $1.67 | 25d | 1 | 1.05mi |
| 2560 Wood Valley Dr Atlanta, GA | 4.0 | 2.5 | 1141 | $1,900 | $1.67 | 18d | 1 | 1.05mi |
| 1736 Devon Dr SW Atlanta, GA | 3.0 | 2.5 | 1354 | $2,000 | $1.48 | 25d | 1 | 1.06mi |
| 1735 Willis Mill Rd SW Atlanta, GA | 3.0 | 2.0 | 1461 | $2,173 | $1.49 | 17d | 1 | 1.12mi |
| 2999 Continental Colony Pkwy SW Atlanta, GA | 1.0–2.0 | 1.0–2.0 | 947 | $1,429 | $1.51 | 3d | 5 | 1.14mi |
| 2764 Riggs Dr Atlanta, GA | 3.0 | 2.0 | 1147 | $2,050 | $1.79 | 44d | 1 | 1.16mi |
| 2206 Delowe Dr Unit 2206D East Point, GA | 2.0 | 1.0 | 860 | $1,300 | $1.51 | 25d | 1 | 1.19mi |
| 2186 Delowe Dr Unit 2186J East Point, GA | 2.0 | 1.0 | 860 | $1,050 | $1.22 | 22d | 1 | 1.19mi |
| 2140 Delowe Dr Unit 2140A East Point, GA | 2.0 | 1.0 | 860 | $1,300 | $1.51 | 25d | 1 | 1.22mi |
| 2124 Delowe Dr Unit 2124J East Point, GA | 3.0 | 1.0 | 920 | $1,500 | $1.63 | 25d | 1 | 1.22mi |
| 2756 Plantation Dr Atlanta, GA | 3.0 | 2.0 | 1119 | $1,950 | $1.74 | 21d | 1 | 1.28mi |
| 2065 Alison Ct SW Unit 7 Atlanta, GA | 2.0 | 1.5 | 760 | $995 | $1.31 | 3d | 1 | 1.35mi |
| 2060 Alison Ct SW Atlanta, GA | 2.0 | 1.0 | 850 | $995 | $1.17 | 22d | 1 | 1.36mi |
| 2055 Alison Ct SW Unit 3 Atlanta, GA | 2.0 | 1.5 | 760 | $995 | $1.31 | 3d | 1 | 1.37mi |
| 2045 Alison Ct SW Unit 4 Atlanta, GA | 2.0 | 1.5 | 760 | $995 | $1.31 | 3d | 1 | 1.40mi |
| 3488 Cardinal Dr SW Atlanta, GA | 3.0 | 2.5 | 1421 | $2,100 | $1.48 | 25d | 1 | 1.46mi |
| 1867 Myrtle Dr SW #24 Atlanta, GA | 3.0 | 2.5 | 1400 | $1,400 | $1.00 | 19d | 1 | 1.47mi |
| 2311 Cherry Blossom Dr SW Atlanta, GA | 3.0 | 2.0 | 1311 | $1,750 | $1.33 | 25d | 1 | 1.47mi |
| 3381 Greenbriar Pkwy SW Atlanta, GA | 1.0–2.0 | 1.0–2.0 | 836 | $1,416 | $1.69 | 25d | 1 | 1.48mi |
Listing history 50 events
-
2026-06-18days on market $183,300 Active 56 DOM
-
2026-06-17days on market $183,300 Active 55 DOM
-
2026-06-16days on market $183,300 Active 54 DOM
-
2026-06-15days on market $183,300 Active 53 DOM
-
2026-06-13days on market $183,300 Active 51 DOM
-
2026-06-13days on market $183,300 Active 50 DOM
-
2026-06-09days on market $183,300 Active 47 DOM
-
2026-06-08days on market $183,300 Active 46 DOM
-
2026-06-07days on market $183,300 Active 45 DOM
-
2026-06-04statusdays on market $183,300 Active 42 DOM
-
2026-06-03days on market $183,300 Price Change 41 DOM
-
2026-06-02days on market $183,300 Price Change 40 DOM
-
2026-06-02pricestatus $183,300 Price Change 39 DOM
-
2026-06-01days on market $192,900 Active 39 DOM
-
2026-05-31days on market $192,900 Active 38 DOM
-
2026-05-07price $192,900 313-char remark
-
2026-04-23$203,000 New 313-char remark
-
2023-12-14historical $1,450
-
2023-11-21price $1,450
-
2023-10-31$1,495
-
2019-10-03soldstatus $129,000
-
2019-09-30soldstatus $129,000 Closed 188-char remark
Show marketing remark (188 chars)
Cute as a button, Won't last long BRICK 3 bedroom 1 bath with fenced yard in town, ready to go (Don't miss the 3D Matterport tour) no FHA, no blind offers, Agent is Manager for the Seller.
-
2019-09-30soldstatus $129,000 Sold
Show marketing remark (188 chars)
Cute as a button, Won't last long BRICK 3 bedroom 1 bath with fenced yard in town, ready to go (Don't miss the 3D Matterport tour) no FHA, no blind offers, Agent is Manager for the Seller.
-
2019-09-22status Under Contract
Show marketing remark (188 chars)
Cute as a button, Won't last long BRICK 3 bedroom 1 bath with fenced yard in town, ready to go (Don't miss the 3D Matterport tour) no FHA, no blind offers, Agent is Manager for the Seller.
-
2019-09-22status Pending 188-char remark
Show marketing remark (188 chars)
Cute as a button, Won't last long BRICK 3 bedroom 1 bath with fenced yard in town, ready to go (Don't miss the 3D Matterport tour) no FHA, no blind offers, Agent is Manager for the Seller.
-
2019-09-07price $139,900
Show marketing remark (188 chars)
Cute as a button, Won't last long BRICK 3 bedroom 1 bath with fenced yard in town, ready to go (Don't miss the 3D Matterport tour) no FHA, no blind offers, Agent is Manager for the Seller.
-
2019-09-07price $139,900 188-char remark
Show marketing remark (188 chars)
Cute as a button, Won't last long BRICK 3 bedroom 1 bath with fenced yard in town, ready to go (Don't miss the 3D Matterport tour) no FHA, no blind offers, Agent is Manager for the Seller.
-
2019-08-29price $144,900
Show marketing remark (188 chars)
Cute as a button, Won't last long BRICK 3 bedroom 1 bath with fenced yard in town, ready to go (Don't miss the 3D Matterport tour) no FHA, no blind offers, Agent is Manager for the Seller.
-
2019-08-29price $144,900 188-char remark
Show marketing remark (188 chars)
Cute as a button, Won't last long BRICK 3 bedroom 1 bath with fenced yard in town, ready to go (Don't miss the 3D Matterport tour) no FHA, no blind offers, Agent is Manager for the Seller.
-
2019-08-10$149,900 Active 188-char remark
Show marketing remark (188 chars)
Cute as a button, Won't last long BRICK 3 bedroom 1 bath with fenced yard in town, ready to go (Don't miss the 3D Matterport tour) no FHA, no blind offers, Agent is Manager for the Seller.
-
2019-08-10$149,900 New
Show marketing remark (188 chars)
Cute as a button, Won't last long BRICK 3 bedroom 1 bath with fenced yard in town, ready to go (Don't miss the 3D Matterport tour) no FHA, no blind offers, Agent is Manager for the Seller.
-
2019-07-18soldstatus $88,000
-
2015-08-11soldstatus $67,000
-
2015-08-06soldstatus $67,000 Sold
-
2015-08-06soldstatus $67,000 Sold
-
2015-07-15status Under Contract
-
2015-07-15historical Pending
-
2015-05-27$67,000 New
-
2015-05-27$67,000 Active
-
2015-05-27historical
-
2015-05-18status Back On Market
-
2015-05-13status Under Contract
-
2015-05-06status Active
-
2015-05-02historical
-
2015-03-10price $30,000
-
2015-01-16price $67,000
-
2015-01-13price $68,000
-
2015-01-10price $69,000
-
2015-01-06price $70,000
-
2014-12-30price $71,000
ⓘ Source: listings_history table (triggers on properties + properties_extension) + one-shot
backfill from property_details.listing_events for pre-trigger history.
Tax reassessment forecast GA · Resets to sale price
- Current annual tax
- $2,585 · $215/mo
- Projected year-2 tax
- $2,585 · $215/mo
- Expected delta
- $0/yr ($0/mo · 0.0%)
ⓘ Screening estimate from a state-policy table — verify with the county assessor before closing.
Climate risk First Street
- Flood 1/10 Low FEMA zone X (unshaded) · 0% chance over 30 yrs
- Wildfire 1/10 Low
- Heat 5/10 Major 7 d/yr ≥103°F today · 18 d/yr by 30 yrs out
- Wind 6/10 Major 27% chance of damaging wind over 30 yrs
- Air quality 3/10 Moderate 3 unhealthy d/yr today · 3 by 30 yrs out
Nearby sold comps map
Loading sold comps map…
Walkable amenities ~0.75 mi
Loading nearby amenities…
Taxation est. · year 1
- Rental income
- $20,971
- − Mortgage interest
- −$10,268
- − Property taxes
- −$2,585
- − Insurance
- −$916
- − Repairs & maintenance
- −$1,678
- − Management
- −$1,678
- − Depreciation
- −$5,332
- Taxable loss
- −$1,486
- Est. tax savings @ 24.0%
- +$357
- After-tax cash flow
- $1,887/yr
For passive investors: Depreciation is non-cash, so a rental often shows a tax loss while cash-flowing — sheltering income. Rental losses are passive: they offset passive income freely, and up to $25,000/yr can offset ordinary (W-2) income if you actively participate and your MAGI is under $100k (phasing out to $0 by $150k); unused losses carry forward. On sale, claimed depreciation is recaptured at up to 25%, and gains may owe capital-gains tax (a 1031 exchange can defer both). Figures are a year-1 estimate at your 24.0% rate — not tax advice; consult a CPA.
Schools (NCES district)
- District
- Atlanta Public Schools
- NCES district ID
- 1300120
- Math proficiency
- 28% ▼ -6.00%
- Reading proficiency
- 35% ▼ -2.00%
- Median HH income
- $48,306
- Composite
- 27.27/100
- National rank
- #7006
- State rank
- #80 of 174 in GA
Livability — Atlanta
- Score
- 83/100
- State rank
- #6
- US rank
- #919
Category grades
Schools grade is shown separately in the Schools card above.
Census & demographics
- Census place
- Atlanta, GA
- County
- Fulton County · 1,094,430 people
- City population
- 629,525
- Metro
- Atlanta-Sandy Springs-Alpharetta, GA
- Population (ZIP)
- 34,953
- Household income
- $50,649
- Rent vs Own
- Severe rent burden
- 2825.0
Population outlook (Fulton County) Hauer SSP2
- Today (2025)
- 1,203,707 people
- By 2030
- 1,299,706 · +8.0%
- By 2040
- 1,488,256 · +23.6%
- By 2050
- 1,664,580 · +38.3%
- By 2075
- 2,036,072 · +69.2%
- By 2100
- 2,222,402 · +84.6%
Race, ethnicity, and origin ACS 2023
- Neighborhood character
- Predominantly Black (89%)
- Race & ethnicity
- Black 89% Hispanic / Latino 4% Two or more races 4% White 3%
- Common ancestry
- Hispanic 1%
- Foreign-born
- 5% · Canada
- Languages at home
- 93% English-only · Spanish 3% French/Haitian/Cajun 1% Korean 1%
Political lean MEDSL · Fulton
- 2024 margin
- Solid D (+44.9) · D 71.9% · R 27.0% · Other 1.1%
- 2008→2024 swing
- +9.8pp toward D · 2008: 35.0pp · 2024: 44.9pp
- All cycles
- 2024: D+44.9 2020: D+46.4 2016: D+42.1 2012: D+29.6 2008: D+35.0
Not yet ingested
- Civics
- —
Market trends
- HPI YoY
- ▼ -129.99%
- Current HPI
- 259.954
- Rent YoY
- ▼ -0.19%
- Metro
- Atlanta-Sandy Springs-Alpharetta, GA
- State GDP YoY
- ▲ 2.66%
- F500 in state
- 28
Industry mix (Fortune 500 HQ in GA)
| Industry | F500 HQs | Revenue |
|---|---|---|
| Paper / Packaging | 2 | $29B |
|
||
| Retail | 1 | $160B |
|
||
| Transportation / Logistics | 1 | $91B |
|
||
| Airlines | 1 | $62B |
|
||
| Consumer Goods | 1 | $47B |
|
||
| Utilities | 1 | $25B |
|
||
Price history
+133.5% since first listed53 events — show timeline
- 2026-06-01 Price Changed $183,300 GAMLS
- 2026-05-07 Price Changed $192,900 GAMLS
- 2026-04-23 Listed $203,000 GAMLS
- 2023-12-14 Rental Removed $1,450 GAMLS
- 2023-11-21 Price Changed $1,450 GAMLS
- 2023-10-31 Listed for Rent $1,495 GAMLS
- 2019-10-03 Sold (Public Records) $129,000 Public Records
- 2019-09-30 Sold (MLS) $129,000 GAMLS
- 2019-09-30 Sold (MLS) $129,000 FMLS
- 2019-09-22 Pending — GAMLS
- 2019-09-22 Pending — FMLS
- 2019-09-07 Price Changed $139,900 GAMLS
- 2019-09-07 Price Changed $139,900 FMLS
- 2019-08-29 Price Changed $144,900 GAMLS
- 2019-08-29 Price Changed $144,900 FMLS
- 2019-08-10 Listed $149,900 GAMLS
- 2019-08-10 Listed $149,900 FMLS
- 2019-07-18 Sold (Public Records) $88,000 Public Records
- 2015-08-11 Sold (Public Records) $67,000 Public Records
- 2015-08-06 Sold (MLS) $67,000 GAMLS
- 2015-08-06 Sold (MLS) $67,000 FMLS
- 2015-07-15 Pending — GAMLS
- 2015-07-15 Contingent — FMLS
- 2015-05-27 Listed $67,000 GAMLS
- 2015-05-27 Listed $67,000 FMLS
- 2015-05-27 Listing Removed — GAMLS
- 2015-05-18 Relisted — GAMLS
- 2015-05-13 Pending — GAMLS
- 2015-05-06 Relisted — GAMLS
- 2015-05-02 Listing Removed — GAMLS
- 2015-03-10 Price Changed $30,000 GAMLS
- 2015-01-16 Price Changed $67,000 GAMLS
- 2015-01-13 Price Changed $68,000 GAMLS
- 2015-01-10 Price Changed $69,000 GAMLS
- 2015-01-06 Price Changed $70,000 GAMLS
- 2014-12-30 Price Changed $71,000 GAMLS
- 2014-12-24 Price Changed $72,000 GAMLS
- 2014-12-23 Price Changed $73,000 GAMLS
- 2014-12-20 Price Changed $74,000 GAMLS
- 2014-11-20 Price Changed $75,000 GAMLS
- 2014-11-03 Listed $85,900 GAMLS
- 2014-09-15 Price Changed $30,000 FMLS
- 2014-09-15 Listing Removed — GAMLS
- 2014-09-15 Listing Removed — FMLS
- 2014-09-10 Sold (MLS) $30,000 GAMLS
- 2014-09-10 Sold (MLS) $30,000 FMLS
- 2014-09-10 Price Changed $32,000 FMLS
- 2014-08-08 Pending — GAMLS
- 2014-08-08 Pending — FMLS
- 2014-08-07 Price Changed $32,000 GAMLS
- 2014-07-25 Listed $32,000 GAMLS
- 2014-07-25 Listed $32,000 FMLS
- 1999-11-16 Sold (Public Records) $78,500 Public Records
Property tax history
+11.3%/yrLatest (2025): $2,585 · -0.1% YoY. Source: county tax records.
Cash-flow waterfall
monthlySold comps — $/sqft
last 12 mo · ≤1 miLoading sold comps…