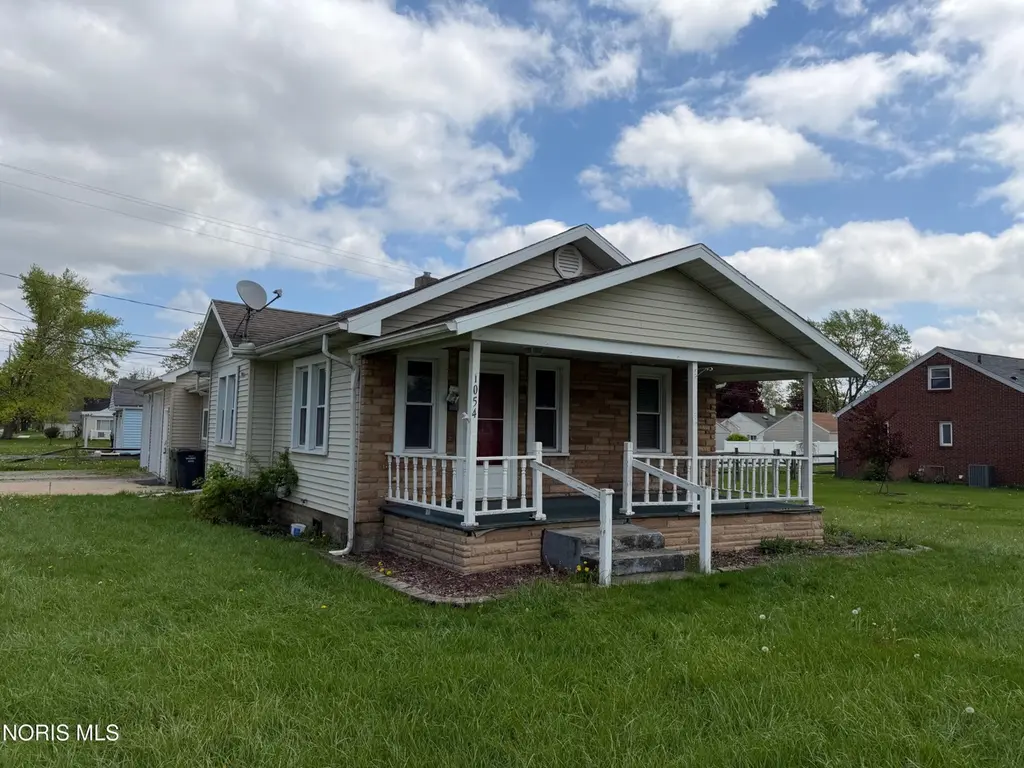
1054 Scott St · Maumee, OH
Flood risk 1/10 · Minimal
- FEMA flood zone
- X (unshaded)
- Chance of flooding over 30 yrs
- 0.0%
- Est. flood insurance / yr
- $507 – $1,088
Fire risk 1/10 · Minimal
- Est. fire insurance / yr
- $713 – $1,323
Heat risk 3/10 · Minor
- Hot days now (above 100°F)
- 7 days/yr
- Hot days in 30 yrs
- 16 days/yr
Wind risk 2/10 · Minimal
- Chance of severe wind over 30 yrs
- —
Air-quality risk 2/10 · Minimal
- Unhealthy air days now
- 1 days/yr
- Unhealthy air days in 30 yrs
- 2 days/yr
Risk factors via First Street. Map © Google.
Why this score? — see what drove the B+ grade
The composite is a weighted blend of 9 inputs, each scored 0–100. Each bar is that input's sub-score; the figure is the points it added to the 100-point composite (weight × sub-score).
- Cash flow +30.0/30.0
- ARV discount +15.0/15.0
- 1% rule +10.0/10.0
- DSCR +10.0/10.0
- Schools +5.6/10.0
- Livability +3.8/5.0
- Rent growth +2.5/5.0
- Condition / age +2.5/5.0
- Appreciation +0.0/10.0
$110,000
🖨 Deal sheet (PDF) 📄 Offer letter ✓ Due diligence
Listing remarks MLS
ADORABLE HOME WITH UPDATED KITCHEN, FURNACE, H20 HEATER, ROOF LESS THAN 10 YRS, UPDATED ELECTRIC, NEWER CARPET IN LIV RM & DIN RM, FENCED YARD, GREAT FRONT PORCH. GAS & ELEC HOOK UP FOR STOVE & DRYER.WASHER AND DRYER INCLUDED, GREAT STARTER HOME.
Key facts
- 6,300 sq ft lot
- 2 garage spots
- Built 1922
Property features AI
Exterior
- Parking: Attached oversized garage with garage door opener; 2 garage spaces; Driveway parking; Total parking for 4 vehicles
- Utilities: Public water; Public sewer; Electricity connected (200+ amp service); Natural gas connected; Fiber available
- Home design: Single-family house; One story; Not attached to other structures; No common walls
- Construction: Vinyl siding; Shingle roof; Crawl space and slab foundation; Built in public-records year (source: public records)
- Exterior features: Deck; Corner lot
Interior
- Kitchen: Electric range; Microwave; Dishwasher; Refrigerator
- Bedrooms: Bedroom 2 on the main level; Bedroom 3 on the main level
- Flooring: Carpet; Laminate
- Bathrooms: 1 full bathroom and 1 half bathroom (1.5 total)
- Heating & cooling: Central heating (forced air); Central air conditioning
- Interior features: Six total rooms; Other interior features; Dryer, Dishwasher, Electric Range, Microwave, Refrigerator, Washer
- Laundry & utility: Washer and dryer included; Laundry located on main level
Neighborhood map
What this means for you Summary
Snapshot
- This is a 3-bed/1.0-bath single-family listed at $110k.
Deal economics
- At list price, monthly cash flow is $448 ($5k/yr) — positive.
- The deal already cash-flows at list — no discount required.
- Meets the 1% rule at list price ($2k rent vs $110k).
- Recommended offer: $108k (1.5% below list) — sets the bar for market timing.
- Cap rate 11.2% vs local median 2.8% in Maumee — top-decile yield for the area; either an underpriced asset or a hidden risk that comps aren't pricing in. Stress-test before assuming the spread holds.
Location & tenants
- Location reads 76/100 on livability (#221 in OH, #3,442 nationally) — a middle-class / working-renter tenant base. Strengths: cost of living A+, housing A+, employment A-; Watch: amenities F, commute F, health & safety F.
- Maumee City (suburban): math 65% / reading 67% proficiency, ranked #194 of 656 in OH (top 30%) — acceptable for families but not a draw, mixed tenant base, ~2y average lease.
- Zoned schools: Fort Miami Elementary School (math 62% / reading 42%, grade C-, #851 of 1,584 statewide, top 56%, 330 students, 30% FRL); Maumee High School (math 67% / reading 76%, grade B+, #98 of 781 statewide, top 13%, 648 students, 26% FRL) — zoned schools at 28% FRL track the district average.
- Market conditions: 113 active listings in the ZIP; 6 comparable units currently listed for rent nearby; rentals at typical pace (median 24d on market — plan ~3-4 weeks tenant-placement turnaround); solid renter incomes; 415 units permitted in Lucas County in 2024 (122 in 5+ unit buildings).
Forward outlook
- Local home prices are declining (-3.0%/yr); year-one equity from $761 of loan paydown is wiped out by about $3k of value loss. Plan a longer hold.
- Lucas County population projected at -16% by 2050 — secular population decline; favor cash flow + early exit over multi-decade hold.
- At projected returns (-3.0% appreciation + 3.0% rent growth), your $31k cash investment doubles in ~7 years — after that, you're playing with house money.
Negotiation context
- It's been on market 21 days — a 2% lower offer ($108k) is reasonable based on typical stale-listing flexibility.
- 9 sale attempts since 25y ago with the ask held roughly flat each time — persistent listings suggest the price (not the market) is what's stuck; bring a comps-based counter.
Risks & watch-outs
- Watch-outs: property tax is 3.2% of price; built in 1922 — expect roof / HVAC / electrical / plumbing capex.
Questions for the listing agent
- Built in 1922 — when were the roof, HVAC, electrical panel, plumbing, and water heater last replaced?
- Property tax is high relative to price — has the assessment been appealed recently, and will the sale trigger a re-assessment?
- Is there a deadline driving the sale (1031 exchange, divorce, estate, relocation)? That informs how much negotiation room exists.
- Schools are A-rated — typically a magnet for longer-tenancy family renters. What's the average tenant stay here, and is there a school-zone premium baked into asking?
- What's the average days-on-market for RENTAL listings here right now (not sales)? A rising rental-DOM trend means longer vacancies and softer asking-rent achievability than the comps imply.
- What's the recent tenant-quality profile in this submarket — average credit score on applications, eviction rate, late-payment / NSF rate, and stable-employment percentage? A property-management company in the area should have these aggregated.
- How much new for-sale + rental construction is in the pipeline within 1–3 miles? Heavy new supply typically softens prices + rents 12–24 months out; constrained supply supports both.
Investment metrics
- 1% rule
- 1.57% ✓
- Cap rate
- 11.18%
- Cash-on-cash
- 17.44%
- DSCR
- 1.78
- GRM
- 5.3
CMA / ARV
- ARV (median comp)
- $189,357
- List price
- $110,000
- Delta
- -41.91%
- Verdict
- UNDERPRICED
- Comps
- 20 within 1.0 mi
Show comp detail 12 sales within ~0.75 mi
| Address | Dist | Beds/Ba | Sqft | Sold | Price | $/sf | Match |
|---|---|---|---|---|---|---|---|
| 1014 Hugo St | 0.13mi | 3/1.0 | 925 (-10%) | 3mo | $183,000 | $198 | 75 |
| 1313 Birch Ave | 0.38mi | 3/1.0 | 999 (-3%) | 3mo | $247,000 | $247 | 74 |
| 1371 Junior Dr | 0.46mi | 3/1.0 | 1,010 (-2%) | 2mo | $206,000 | $204 | 73 |
| 1033 Anderson Ave | 0.18mi | 3/2.0 | 925 (-10%) | 3mo | $229,000 | $248 | 68 |
| 3222 Escott Ave | 0.59mi | 3/1.0 | 1,111 (+8%) | 1mo | $159,000 | $143 | 59 |
| 716 Ransom St | 0.64mi | 2/1.0 (-1) | 1,058 (+2%) | 2mo | $180,000 | $170 | 59 |
| 5022 Stengel Ave | 0.56mi | 3/1.0 | 960 (-7%) | 6mo | $166,500 | $173 | 58 |
| 715 Carew Ln | 0.48mi | 3/1.0 | 1,153 (+12%) | 1mo | $200,000 | $173 | 57 |
| 1419 7th St | 0.49mi | 3/1.5 | 1,170 (+13%) | 2mo | $235,000 | $201 | 51 |
| 1381 Junior Dr | 0.44mi | 3/2.0 | 912 (-12%) | 6mo | $214,000 | $235 | 51 |
| 3205 Penrose Ave | 0.67mi | 3/1.5 | 1,114 (+8%) | 6mo | $149,900 | $135 | 48 |
| 629 Pierce St | 0.56mi | 3/1.0 | 884 (-14%) | 5mo | $210,000 | $238 | 46 |
Match score weights: distance 35% · size 25% · config 20% · recency 20%. Top-matched comps best support the ARV.
Projected returns pro-forma
-3.0% appreciation · 3.0% rent growth · sell at horizon
- IRR
- 8.9%
- Equity multiple
- 1.35×
- Total profit
- $10,812
- Equity at exit
- $16,401
- IRR
- 18.2%
- Equity multiple
- 2.51×
- Total profit
- $46,625
- Equity at exit
- $9,511
Cash invested: $30,800 (down + closing). Projections, not guarantees.
Landlord ↔ Tenant lean methodology
- Overall (STATE)
- 73 Landlord-Friendly
- State Ohio
- 73 Landlord-Friendly · R+6
- County
- — inherits STATE
- City
- — inherits STATE
ZIP-level market 43537
- Home prices YoY
- -29.6%
- Active inventory
- 113
- Price-to-rent
- 5.3×
Monthly cashflow live
- Estimated rent
- $1,725 high interval (Pro) →
- Mortgage (P&I)
- −$577
- Tax from tax record
- −$292 /mo · $3,506/yr
- Insurance
- −$46
- HOA
- −$0
- Vacancy / Maint / Mgmt
- −$362
- Net cashflow
- $448
Break-even live
Sensitivity live
| Price | -10% $510 | -5% $479 | +0% $448 | +5% $417 | +10% $385 |
|---|---|---|---|---|---|
| Rent | -10% $311 | -5% $380 | +0% $448 | +5% $516 | +10% $584 |
| Rate | -1.0pp $503 | -0.5pp $476 | base $448 | +0.5pp $419 | +1.0pp $390 |
UW: 25.0% down · 7.5% · 30yr · 1.5% tax · 5.0% vac · 8.0% maint · 8.0% mgmt
Financing live
Cash to close
- Down payment
- $27,500
- Closing costs
- $3,300
- Reserves months
- —
- Total cash needed
- —
Loan-product check · same deal, 3 products live
Conventional
25% down · 7.5% · 30yr
- Down + closing
- —
- Monthly P&I
- —
- Monthly cashflow
- —
- DSCR
- —
- Eligible?
- —
Personal DTI + credit; lowest rate.
DSCR
20% down · 8.5% · 30yr
- Down + closing
- —
- Monthly P&I
- —
- Monthly cashflow
- —
- DSCR
- —
- Eligible?
- —
No personal income docs; deal must DSCR.
Hard money
10% down · 12.0% · 12mo
- Down + closing
- —
- Monthly P&I
- —
- Monthly cashflow
- —
- DSCR
- —
- Eligible?
- —
Short-term bridge; refi at stabilization.
Rent comps 6 comps
| Address | Beds | Baths | Sqft | Rent | $/sqft | DOM | Units | Dist |
|---|---|---|---|---|---|---|---|---|
| 1106 Hugo St Maumee, OH | 3.0 | 1.0 | 1006 | $1,595 | $1.59 | 44d | 1 | 0.06mi |
| 1027 Valley Side Dr Maumee, OH | 2.0 | 1.5 | 1260 | $1,495 | $1.19 | 24d | 1 | 0.36mi |
| 1010 Valley Side Dr Unit 1010 Maumee, OH | 2.0 | 1.5 | 1260 | $1,395 | $1.11 | 14d | 1 | 0.39mi |
| 3025 S Byrne Rd Unit 1 Toledo, OH | 3.0 | 1.0 | 1064 | $1,095 | $1.03 | 21d | 1 | 0.94mi |
| 2647 Eastgate Rd Toledo, OH | 1.0–2.0 | 1.0 | 722 | $1,209 | $1.67 | 24d | 1 | 0.97mi |
| 3165 Glanzman Rd Toledo, OH | 1.0–2.0 | 1.0 | 658 | $799 | $1.21 | 44d | 1 | 1.38mi |
Listing history 30 events
-
2026-04-29$110,000 Active 395-char remark
-
2026-04-27historical
-
2026-04-21price $140,000
-
2026-04-15status Active
-
2026-04-10historical Contingent
-
2026-04-09price $169,000
-
2026-04-06status Active
-
2026-04-01historical Contingent
-
2026-03-27$172,000 Active
-
2026-03-12historical
-
2025-10-14price $81,400
Show marketing remark (258 chars)
ADORABLE HOME WITH UPDATED KITCHEN, FURNACE, H20 HEATER, ROOF LESS THAN 10 YRS, UPDATED ELECTRIC, NEWER CARPET IN LIV RM & DIN RM, FENCED YARD, GREAT FRONT PORCH. GAS & ELEC HOOK UP FOR STOVE & DRYER.WASHER AND DRYER INCLUDED, GREAT STARTER HOME.
-
2020-03-13soldstatus $132,000
-
2020-03-09price $132,000
-
2020-01-03$128,000
-
2015-05-22soldstatus $112,000
-
2015-05-18$112,000
-
2015-05-15soldstatus $112,000
-
2004-06-07soldstatus $96,800
-
2004-06-05soldstatus $96,800
-
2004-05-10price $96,800
-
2004-05-10$95,000
-
2002-04-12soldstatus $81,400
-
2002-04-09soldstatus $81,400
Show marketing remark (258 chars)
ADORABLE HOME WITH UPDATED KITCHEN, FURNACE, H20 HEATER, ROOF LESS THAN 10 YRS, UPDATED ELECTRIC, NEWER CARPET IN LIV RM & DIN RM, FENCED YARD, GREAT FRONT PORCH. GAS & ELEC HOOK UP FOR STOVE & DRYER.WASHER AND DRYER INCLUDED, GREAT STARTER HOME.
-
2001-10-24historical
-
2001-10-23$85,000
Show marketing remark (258 chars)
ADORABLE HOME WITH UPDATED KITCHEN, FURNACE, H20 HEATER, ROOF LESS THAN 10 YRS, UPDATED ELECTRIC, NEWER CARPET IN LIV RM & DIN RM, FENCED YARD, GREAT FRONT PORCH. GAS & ELEC HOOK UP FOR STOVE & DRYER.WASHER AND DRYER INCLUDED, GREAT STARTER HOME.
-
2001-07-26$89,900
-
1997-10-07soldstatus $74,000
-
1993-10-14soldstatus $48,500
-
1990-01-18soldstatus $43,500
-
1987-04-27soldstatus $33,840
ⓘ Source: listings_history table (triggers on properties + properties_extension) + one-shot
backfill from property_details.listing_events for pre-trigger history.
Tax reassessment forecast OH · Partial reset (capped growth)
- Current annual tax
- $3,506 · $292/mo
- Projected year-2 tax
- $3,506 · $292/mo
- Expected delta
- $0/yr ($0/mo · 0.0%)
ⓘ Screening estimate from a state-policy table — verify with the county assessor before closing.
Climate risk First Street
- Flood 1/10 Low FEMA zone X (unshaded) · 0% chance over 30 yrs
- Wildfire 1/10 Low
- Heat 3/10 Moderate 7 d/yr ≥100°F today · 16 d/yr by 30 yrs out
- Wind 2/10 Low
- Air quality 2/10 Low 1 unhealthy d/yr today · 2 by 30 yrs out
Nearby sold comps map
Loading sold comps map…
Walkable amenities ~0.75 mi
Loading nearby amenities…
Taxation est. · year 1
- Rental income
- $20,697
- − Mortgage interest
- −$6,162
- − Property taxes
- −$3,506
- − Insurance
- −$550
- − Repairs & maintenance
- −$1,656
- − Management
- −$1,656
- − Depreciation
- −$3,200
- Taxable income
- $3,968
- Est. tax owed @ 24.0%
- −$952
- After-tax cash flow
- $4,420/yr
For passive investors: Depreciation is non-cash, so a rental often shows a tax loss while cash-flowing — sheltering income. Rental losses are passive: they offset passive income freely, and up to $25,000/yr can offset ordinary (W-2) income if you actively participate and your MAGI is under $100k (phasing out to $0 by $150k); unused losses carry forward. On sale, claimed depreciation is recaptured at up to 25%, and gains may owe capital-gains tax (a 1031 exchange can defer both). Figures are a year-1 estimate at your 24.0% rate — not tax advice; consult a CPA.
Schools (NCES district)
- District
- Maumee City
- NCES district ID
- 3904436
- Math proficiency
- 65% ▼ -10.00%
- Reading proficiency
- 67% ▼ -7.00%
- Median HH income
- $53,412
- Composite
- 56.38/100
- National rank
- #1162
- State rank
- #194 of 656 in OH
Livability — Maumee
- Score
- 76/100
- State rank
- #221
- US rank
- #3442
Category grades
Schools grade is shown separately in the Schools card above.
Census & demographics
- Census place
- Maumee, OH
- County
- Lucas County · 380,724 people
- City population
- 30,111
- Metro
- Toledo, OH
- Population (ZIP)
- 30,111
- Household income
- $82,752
- Rent vs Own
- Severe rent burden
- 592.0
Population outlook (Lucas County) Hauer SSP2
- Today (2025)
- 420,751 people
- By 2030
- 410,187 · -2.5%
- By 2040
- 384,019 · -8.7%
- By 2050
- 355,125 · -15.6%
- By 2075
- 291,683 · -30.7%
- By 2100
- 233,670 · -44.5%
Race, ethnicity, and origin ACS 2023
- Neighborhood character
- Predominantly White (83%)
- Race & ethnicity
- White 83% Hispanic / Latino 6% Black 6% Two or more races 6% Asian 1%
- Hispanic origin (detail)
- Mexican 4%
- Common ancestry
- Romanian 9% Lithuanian 4% Slovak 2%
- Foreign-born
- 3% · Canada
- Languages at home
- 95% English-only · Spanish 2% Other Indo-European 1% German/W. Germanic 1%
Political lean MEDSL · Lucas
- 2024 margin
- D (+12.6) · D 55.8% · R 43.2%
- 2008→2024 swing
- -18.9pp toward R · 2008: 31.4pp · 2024: 12.6pp
- All cycles
- 2024: D+12.6 2020: D+16.8 2016: D+17.4 2012: D+30.4 2008: D+31.4
Not yet ingested
- Civics
- —
Market trends
- HPI YoY
- ▼ -85.67%
- Current HPI
- 203.8449
- Rent YoY
- —
- Metro
- Toledo, OH
- State GDP YoY
- ▲ 1.98%
- F500 in state
- 48
Industry mix (Fortune 500 HQ in OH)
| Industry | F500 HQs | Revenue |
|---|---|---|
| Insurance | 3 | $145B |
|
||
| Industrial Machinery | 3 | $49B |
|
||
| Financial Services | 3 | $24B |
|
||
| Consumer Goods | 2 | $93B |
|
||
| Aerospace / Defense | 2 | $47B |
|
||
| Utilities | 2 | $33B |
|
||
Price history
+299.8% since first listed32 events — show timeline
- 2026-06-05 Sold (MLS) $135,300 NORIS
- 2026-05-20 Pending — NORIS
- 2026-04-29 Listed $110,000 NORIS
- 2026-04-27 Listing Removed — NORIS
- 2026-04-21 Price Changed $140,000 NORIS
- 2026-04-15 Relisted — NORIS
- 2026-04-10 Contingent — NORIS
- 2026-04-09 Price Changed $169,000 NORIS
- 2026-04-06 Relisted — NORIS
- 2026-04-01 Contingent — NORIS
- 2026-03-27 Listed $172,000 NORIS
- 2026-03-12 Coming Soon — NORIS
- 2025-10-14 Price Changed $81,400 NORIS
- 2020-03-13 Sold (MLS) $132,000 NORIS
- 2020-03-09 Price Changed $132,000 NORIS
- 2020-01-03 Listed $128,000 NORIS
- 2015-05-22 Sold (MLS) $112,000 NORIS
- 2015-05-18 Listed $112,000 NORIS
- 2015-05-15 Sold (Public Records) $112,000 Public Records
- 2004-06-07 Sold (Public Records) $96,800 Public Records
- 2004-06-05 Sold (MLS) $96,800 NORIS
- 2004-05-10 Price Changed $96,800 NORIS
- 2004-05-10 Listed $95,000 NORIS
- 2002-04-12 Sold (Public Records) $81,400 Public Records
- 2002-04-09 Sold (MLS) $81,400 NORIS
- 2001-10-24 Listing Removed — NORIS
- 2001-10-23 Listed $85,000 NORIS
- 2001-07-26 Listed $89,900 NORIS
- 1997-10-07 Sold (Public Records) $74,000 Public Records
- 1993-10-14 Sold (Public Records) $48,500 Public Records
- 1990-01-18 Sold (Public Records) $43,500 Public Records
- 1987-04-27 Sold (Public Records) $33,840 Public Records
Property tax history
+6.2%/yrLatest (2025): $3,506 · +2.1% YoY. Source: county tax records.
Cash-flow waterfall
monthlySold comps — $/sqft
last 12 mo · ≤1 miLoading sold comps…