 15-Plex
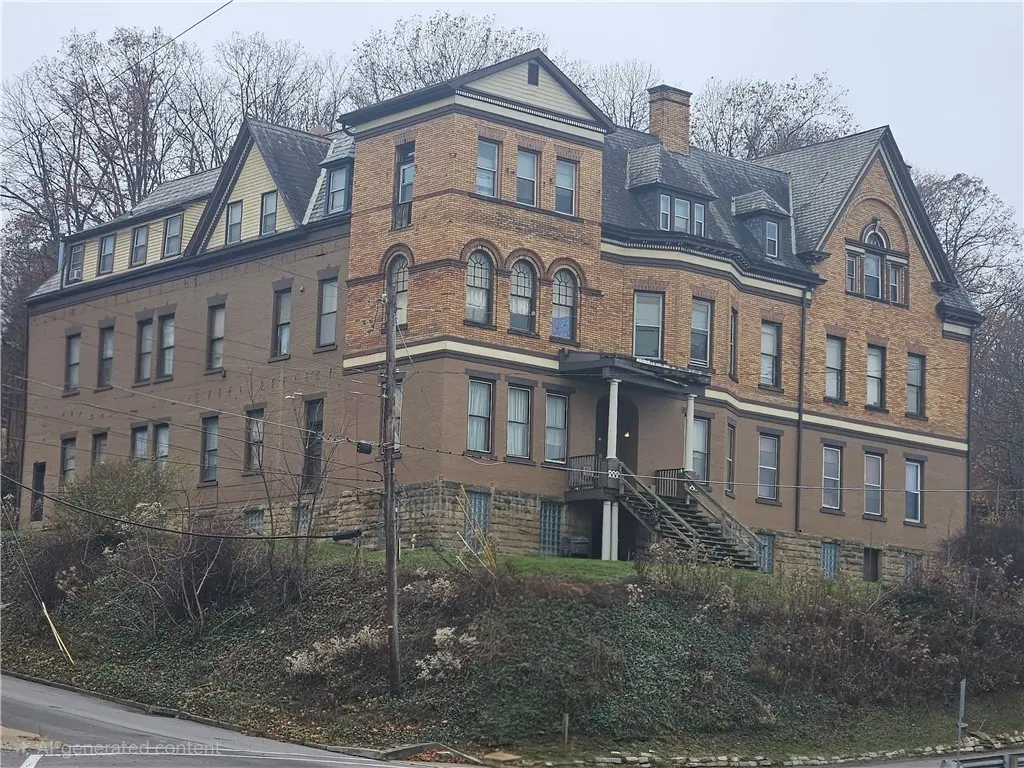
700 S Main St · Butler, PA
Flood risk 1/10 · Minimal
- FEMA flood zone
- X (unshaded)
- Chance of flooding over 30 yrs
- 0.0%
- Est. flood insurance / yr
- $507 – $1,088
Fire risk 1/10 · Minimal
- Est. fire insurance / yr
- $511 – $949
Heat risk 3/10 · Minor
- Hot days now (above 94°F)
- 7 days/yr
- Hot days in 30 yrs
- 17 days/yr
Wind risk 1/10 · Minimal
- Chance of severe wind over 30 yrs
- —
Air-quality risk 3/10 · Minor
- Unhealthy air days now
- 2 days/yr
- Unhealthy air days in 30 yrs
- 4 days/yr
Risk factors via First Street. Map © Google.
Why this score? — see what drove the C grade
The composite is a weighted blend of 9 inputs, each scored 0–100. Each bar is that input's sub-score; the figure is the points it added to the 100-point composite (weight × sub-score).
- Cash flow +22.1/30.0
- ARV discount +7.5/15.0
- DSCR +7.1/10.0
- 1% rule +5.8/10.0
- Rent growth +5.0/5.0
- Schools +4.3/10.0
- Livability +3.6/5.0
- Condition / age +1.0/5.0
- Appreciation +0.0/10.0
$1,225,000
🖨 Deal sheet (PDF) 📄 Offer letter ✓ Due diligence
Multi-family units
County records classify this as Multi-Family (2-4 Unit). Listing-text estimate: 15 units. estimate disagrees with records
Listing remarks MLS
Calling all Investors!! Are you looking to add to your portfolio? Look no further than this 15 unit Gem in the heart of Butler. This Historic property features 2 buildings and 2 parking lots situated on 1.48 acres in the heart of Butler. Building 1 houses 15 units, 3 coin-op laundry areas and a full basement that can easily be converted to storage units for the tenants. Building 2 is ready for your renovations and can house an additional 5 units depending on the design/layout.
Key facts
- 15 unit gem
- 2 buildings
- Full basement
Tags
Neighborhood map
What this means for you Summary
Snapshot
- This is a 15 × 1-bed/1-bath units multifamily listed at $1.23M. Condition is rated poor.
Deal economics
- At list price, monthly cash flow is $2k ($24k/yr) — positive. Per door: $132/mo.
- The deal already cash-flows at list — no discount required.
- Meets the 1% rule at list price ($13k rent vs $1.23M).
- Recommended offer: $1.08M (12.0% below list) — sets the bar for market timing.
- Cap rate 8.2% vs local median 6.2% in Butler — top-decile yield for the area; either an underpriced asset or a hidden risk that comps aren't pricing in. Stress-test before assuming the spread holds.
Location & tenants
- Location reads 71/100 on livability (#705 in PA) — a middle-class / working-renter tenant base. Strengths: cost of living A+, health & safety A+, housing A-; Watch: crime D-, amenities F, commute F.
- Butler Area SD (town): math 41% / reading 59% proficiency, ranked #181 of 539 in PA (top 34%) — acceptable for families but not a draw, mixed tenant base, ~2y average lease.
- Zoned schools: Butler Area Ihs (math 25% / reading 55%, grade F, #257 of 512 statewide, top 52%, 1,342 students, 47% FRL); Butler Area Shs (math 72% / reading 30%, grade D+, #123 of 437 statewide, top 28%, 1,989 students, 31% FRL).
- Market conditions: Rents rising fast (+20.4%/yr); 206 active listings in the ZIP; 40 comparable units currently listed for rent nearby; rentals at typical pace (median 25d on market — plan ~3-4 weeks tenant-placement turnaround); 40% of comp listings sitting > 30 days — soft ceiling on asking rent; 987 units permitted in Butler County in 2024 (0 in 5+ unit buildings).
- At $13,219/mo this rent would consume 249% of the median local household income ($64k/yr) (locally 1441% of renters already pay >50% of income on rent) — very limited rent-growth headroom before tenants either downsize or default.
Forward outlook
- Local home prices are declining (-3.0%/yr); year-one equity from $8k of loan paydown is wiped out by about $37k of value loss. Plan a longer hold.
- Butler County population projected to shrink 5% by 2050 — rents likely to lag national; underwrite the cash flow, not the appreciation.
- At projected returns (-3.0% appreciation + 8.0% rent growth), your $343k cash investment doubles in ~9 years — after that, you're playing with house money.
Negotiation context
- It's been on market 202 days — a 12% lower offer ($1.08M) is reasonable based on typical stale-listing flexibility.
Questions for the listing agent
- It's been on market 202 days. Have you received any prior offers? Is the seller open to a 12% concession, seller financing, or rate buy-down credit?
- Can we see the unit-by-unit rent roll, current vacancy, and any below-market leases? What's the average tenancy length?
- What capital expenditures (roof, boiler, parking lot, exteriors) have been made in the last 5 years, and what's planned in the next 2?
- Have any recent inspections been done? Can we get a copy of the seller's disclosures and any deferred-maintenance estimates?
- Why hasn't it sold? Are there any deal-killer items the seller is aware of (foundation, flood, title, zoning, code violations)?
- Is there a deadline driving the sale (1031 exchange, divorce, estate, relocation)? That informs how much negotiation room exists.
- Schools are A-rated — typically a magnet for longer-tenancy family renters. What's the average tenant stay here, and is there a school-zone premium baked into asking?
- Crime grade is D in this area — have there been break-ins, vandalism, or insurance claims at this property in the last 3 years? What carrier currently insures it and at what premium?
- What's the average days-on-market for RENTAL listings here right now (not sales)? A rising rental-DOM trend means longer vacancies and softer asking-rent achievability than the comps imply.
- What's the recent tenant-quality profile in this submarket — average credit score on applications, eviction rate, late-payment / NSF rate, and stable-employment percentage? A property-management company in the area should have these aggregated.
- How much new apartment / multifamily construction is in the pipeline within 1–3 miles? Heavy new supply (>2% of stock underway) typically softens rents 12–24 months out; light construction supports rent growth.
Investment metrics
- 1% rule
- 1.08% ✓
- Cap rate
- 8.23%
- Cash-on-cash
- 6.92%
- DSCR
- 1.31
- GRM
- 7.7
CMA / ARV
- ARV (median comp)
- $154,589
- List price
- $1,225,000
- Delta
- 692.43%
- Verdict
- OVERPRICED
- Comps
- 1 within 2.0 mi
Show comp detail 12 sales within ~0.75 mi
| Address | Dist | Beds/Ba | Sqft | Sold | Price | $/sf | Match |
|---|---|---|---|---|---|---|---|
| 208 Spang Ave | 0.25mi | 4/2.0 | — | 10mo | $120,000 | — | 68 |
| 221 Brown Ave | 0.36mi | 4/2.0 | — | 6mo | $144,900 | — | 66 |
| 332 S Main St | 0.35mi | 4/3.0 | — | 7mo | $189,900 | — | 65 |
| 307 W Wayne St | 0.34mi | 3/2.0 | — | 15mo | $85,000 | — | 59 |
| 207/209 South Monroe St | 0.52mi | 4/2.0 | — | 8mo | $150,000 | — | 57 |
| 120 S Washington St | 0.52mi | 3/4.0 | — | 9mo | $375,000 | — | 56 |
| 716-718 Hettie Way | 0.66mi | 4/3.0 | — | 3mo | $190,000 | — | 54 |
| 134 S Main St | 0.68mi | 16/7.0 | — | 7mo | $399,900 | — | 50 |
| 400 W New Castle St | 0.68mi | 4/4.0 | — | 10mo | $125,000 | — | 48 |
| 428 W Cunningham St | 0.61mi | 4/2.0 | — | 19mo | $117,500 | — | 44 |
| 221 N Washington St | 0.72mi | 13/13.0 | — | 14mo | $700,000 | — | 42 |
| 329 W North St | 0.70mi | 4/2.0 | — | 19mo | $63,600 | — | 39 |
Match score weights: distance 35% · size 25% · config 20% · recency 20%. Top-matched comps best support the ARV.
Projected returns pro-forma
-3.0% appreciation · 8.0% rent growth · sell at horizon
- IRR
- -0.2%
- Equity multiple
- 0.99×
- Total profit
- $-2,508
- Equity at exit
- $182,651
- IRR
- 14.1%
- Equity multiple
- 2.40×
- Total profit
- $478,748
- Equity at exit
- $105,916
Cash invested: $343,000 (down + closing). Projections, not guarantees.
Landlord ↔ Tenant lean methodology
- Overall (STATE)
- 62 Landlord-Friendly
- State Pennsylvania
- 62 Landlord-Friendly · EVEN
- County
- — inherits STATE
- City
- — inherits STATE
ZIP-level market 16001
- Home prices YoY
- -31.7%
- Rents YoY
- 20.4%
- Active inventory
- 206
- Price-to-rent
- 115.8×
Monthly cashflow live
- Estimated rent
- $13,219 high interval (Pro) →
- Mortgage (P&I)
- −$6,424
- Tax est. 1.5%
- −$1,531 /mo · $18,375/yr
- Insurance
- −$510
- HOA
- −$0
- Vacancy / Maint / Mgmt
- −$2,776
- Net cashflow
- $1,977
Break-even live
Sensitivity live
| Price | -10% $2,824 | -5% $2,401 | +0% $1,977 | +5% $1,554 | +10% $1,131 |
|---|---|---|---|---|---|
| Rent | -10% $933 | -5% $1,455 | +0% $1,977 | +5% $2,499 | +10% $3,022 |
| Rate | -1.0pp $2,594 | -0.5pp $2,289 | base $1,977 | +0.5pp $1,660 | +1.0pp $1,337 |
15-unit breakdown (identical units grouped — click to expand)
| Units | Beds | Baths | Est. rent |
|---|---|---|---|
| 15× units | 1 | 1 | $13,215 |
| #1 | 1 | 1 | $881 |
| #2 | 1 | 1 | $881 |
| #3 | 1 | 1 | $881 |
| #4 | 1 | 1 | $881 |
| #5 | 1 | 1 | $881 |
| #6 | 1 | 1 | $881 |
| #7 | 1 | 1 | $881 |
| #8 | 1 | 1 | $881 |
| #9 | 1 | 1 | $881 |
| #10 | 1 | 1 | $881 |
| #11 | 1 | 1 | $881 |
| #12 | 1 | 1 | $881 |
| #13 | 1 | 1 | $881 |
| #14 | 1 | 1 | $881 |
| #15 | 1 | 1 | $881 |
| Total (15 units) | $13,219 | ||
UW: 25.0% down · 7.5% · 30yr · 1.5% tax · 5.0% vac · 8.0% maint · 8.0% mgmt
Financing live
Cash to close
- Down payment
- $306,250
- Closing costs
- $36,750
- Reserves months
- —
- Total cash needed
- —
Loan-product check · same deal, 3 products live
Conventional
25% down · 7.5% · 30yr
- Down + closing
- —
- Monthly P&I
- —
- Monthly cashflow
- —
- DSCR
- —
- Eligible?
- —
Personal DTI + credit; lowest rate.
DSCR
20% down · 8.5% · 30yr
- Down + closing
- —
- Monthly P&I
- —
- Monthly cashflow
- —
- DSCR
- —
- Eligible?
- —
No personal income docs; deal must DSCR.
Hard money
10% down · 12.0% · 12mo
- Down + closing
- —
- Monthly P&I
- —
- Monthly cashflow
- —
- DSCR
- —
- Eligible?
- —
Short-term bridge; refi at stabilization.
Rent comps 40 comps
| Address | Beds | Baths | Sqft | Rent | $/sqft | DOM | Units | Dist |
|---|---|---|---|---|---|---|---|---|
| 113 Morton Ave Butler, PA | 2.0 | 1.0 | — | $995 | — | 45d | 1 | 0.07mi |
| 414 S Washington St Butler, PA | 3.0 | 1.0 | 3000 | $1,672 | $0.56 | 14d | 1 | 0.25mi |
| 340 Virginia Ave Unit 3 Butler, PA | 3.0 | 1.0 | 3792 | $899 | $0.24 | 12d | 1 | 0.33mi |
| 415 Brown Ave Butler, PA | 3.0 | 2.5 | 1640 | $1,500 | $0.91 | 14d | 1 | 0.36mi |
| 400 W Wayne St Butler, PA | 2.0 | 1.0 | — | $950 | — | 9d | 1 | 0.37mi |
| 404 Center Ave Unit 5 Butler, PA | 2.0 | 1.0 | — | $995 | — | 17d | 1 | 0.40mi |
| 404 Center Ave Butler, PA | 2.0 | 1.0 | — | $995 | — | 45d | 1 | 0.40mi |
| 115 Spring St #1 Butler, PA | 2.0 | 1.0 | 800 | $800 | $1.00 | 45d | 1 | 0.41mi |
| 120 S Washington St Unit A Butler, PA | 2.0 | 1.0 | — | $1,200 | — | 45d | 1 | 0.49mi |
| 604 Center Ave Butler, PA | 2.0 | 1.0 | — | $1,200 | — | 45d | 1 | 0.54mi |
| 404 W Cunningham St Butler, PA | 2.0 | 1.0 | 800 | $850 | $1.06 | 45d | 1 | 0.57mi |
| 1 South St Unit BC-37 Butler, PA | 2.0 | 1.0 | 760 | $800 | $1.05 | 6d | 1 | 0.60mi |
| 137 N Main St Unit D Butler, PA | 2.0 | 1.0 | — | $1,075 | — | 17d | 1 | 0.60mi |
| 37 Hickory St Butler, PA | 2.0 | 1.0 | 760 | $800 | $1.05 | 6d | 1 | 0.64mi |
| 125 N Chestnut St Unit 1/2 Butler, PA | 3.0 | 1.0 | — | $1,095 | — | 45d | 1 | 0.66mi |
| 331 W North St Butler, PA | 2.0 | 2.0 | — | $945 | — | 25d | 1 | 0.67mi |
| 420 E Jefferson St Apt 2 Butler, PA | 2.0 | 1.0 | — | $715 | — | 25d | 1 | 0.70mi |
| 455 E Jefferson St Butler, PA | 3.0 | 1.0 | — | $1,150 | — | 45d | 1 | 0.73mi |
| 327 W Brady St Unit 2 Butler, PA | 2.0 | 1.0 | 900 | $850 | $0.94 | 22d | 1 | 0.74mi |
| 315 N Washington St Unit 25 Butler, PA | 2.0 | 1.0 | — | $980 | — | 45d | 1 | 0.76mi |
| 179 N Elm St Unit A Butler, PA | 1.0 | 1.0 | — | $750 | — | 45d | 1 | 0.79mi |
| 208 E Walnut St Butler, PA | 3.0 | 1.5 | 1297 | $1,050 | $0.81 | 25d | 1 | 0.80mi |
| 4th Ave Butler, PA | 2.0 | 1.0 | — | $950 | — | 45d | 1 | 0.81mi |
| 303 Wilson Ave Unit Wilson-313 Butler, PA | 3.0 | 1.0 | 894 | $1,005 | $1.12 | 17d | 1 | 0.82mi |
| 313 Wilson Ave Butler, PA | 3.0 | 1.0 | 894 | $1,005 | $1.12 | 17d | 1 | 0.84mi |
| 570 Kendall Ave Unit 575 Lyndora, PA | 3.0 | 1.0 | — | $1,250 | — | 45d | 1 | 0.86mi |
| 715 New Castle St Butler, PA | 3.0 | 1.0 | — | $950 | — | 25d | 1 | 0.93mi |
| 17 Bessemer Ave Apt 10 Lyndora, PA | 1.0 | 1.0 | 525 | $750 | $1.43 | 6d | 1 | 0.95mi |
| 529 Federal St Unit 2 Butler, PA | 2.0 | 1.0 | 900 | $850 | $0.94 | 45d | 1 | 0.96mi |
| 206 Litman Rd Butler, PA | 1.0–2.0 | 1.0 | 800 | $1,170 | $1.46 | 3d | 3 | 1.01mi |
| 712 E Brady St Unit Rear Butler, PA | 1.0 | 1.0 | — | $950 | — | 45d | 1 | 1.05mi |
| 305 American Ave Butler, PA | 2.0 | 1.0 | 986 | $995 | $1.01 | 45d | 1 | 1.07mi |
| 530 N Main St Butler, PA | 2.0 | 2.0 | 1052 | $1,088 | $1.03 | 3d | 2 | 1.08mi |
| 600 N Main St Unit T 15 Butler, PA | 1.0 | 1.0 | 564 | $725 | $1.29 | 13d | 1 | 1.10mi |
| 600 N Main St Butler, PA | 1.0 | 1.0 | 564 | $715 | $1.27 | 45d | 1 | 1.10mi |
| 152 Old Plank Rd Butler, PA | 1.0 | 1.0 | — | $350 | — | 25d | 1 | 1.16mi |
| 152 Old Plank Rd Unit 103 Butler, PA | 3.0 | 1.5 | — | $980 | — | 12d | 1 | 1.16mi |
| 152 Old Plank Rd Unit 102 Butler, PA | 2.0 | 1.0 | — | $887 | — | 12d | 1 | 1.16mi |
| 298 Lumar Dr Unit 1 Butler, PA | 2.0 | 1.0 | — | $950 | — | 25d | 1 | 1.23mi |
| 1 Lumar Vlg Butler, PA | 2.0 | 1.0 | — | $799 | — | 3d | 1 | 1.29mi |
Listing history 15 events
-
2026-06-21days on market $1,225,000 Active 202 DOM
-
2026-06-18days on market $1,225,000 Active 199 DOM
-
2026-06-17days on market $1,225,000 Active 198 DOM
-
2026-06-16days on market $1,225,000 Active 197 DOM
-
2026-06-15days on market $1,225,000 Active 196 DOM
-
2026-06-13days on market $1,225,000 Active 194 DOM
-
2026-06-13days on market $1,225,000 Active 193 DOM
-
2026-06-09days on market $1,225,000 Active 190 DOM
-
2026-06-08days on market $1,225,000 Active 189 DOM
-
2026-06-07days on market $1,225,000 Active 188 DOM
-
2026-06-03days on market $1,225,000 Active 184 DOM
-
2026-06-02days on market $1,225,000 Active 183 DOM
-
2026-06-01days on market $1,225,000 Active 182 DOM
-
2026-05-31days on market $1,225,000 Active 181 DOM
-
2025-12-01$1,225,000 Active 481-char remark
Show marketing remark (481 chars)
Calling all Investors!! Are you looking to add to your portfolio? Look no further than this 15 unit Gem in the heart of Butler. This Historic property features 2 buildings and 2 parking lots situated on 1.48 acres in the heart of Butler. Building 1 houses 15 units, 3 coin-op laundry areas and a full basement that can easily be converted to storage units for the tenants. Building 2 is ready for your renovations and can house an additional 5 units depending on the design/layout.
ⓘ Source: listings_history table (triggers on properties + properties_extension) + one-shot
backfill from property_details.listing_events for pre-trigger history.
Climate risk First Street
- Flood 1/10 Low FEMA zone X (unshaded) · 0% chance over 30 yrs
- Wildfire 1/10 Low
- Heat 3/10 Moderate 7 d/yr ≥94°F today · 17 d/yr by 30 yrs out
- Wind 1/10 Low
- Air quality 3/10 Moderate 2 unhealthy d/yr today · 4 by 30 yrs out
Nearby sold comps map
Loading sold comps map…
Walkable amenities ~0.75 mi
Loading nearby amenities…
Taxation est. · year 1
- Rental income
- $158,628
- − Mortgage interest
- −$68,619
- − Property taxes
- −$18,375
- − Insurance
- −$6,125
- − Repairs & maintenance
- −$12,690
- − Management
- −$12,690
- − Depreciation
- −$35,636
- Taxable income
- $4,492
- Est. tax owed @ 24.0%
- −$1,078
- After-tax cash flow
- $22,650/yr
For passive investors: Depreciation is non-cash, so a rental often shows a tax loss while cash-flowing — sheltering income. Rental losses are passive: they offset passive income freely, and up to $25,000/yr can offset ordinary (W-2) income if you actively participate and your MAGI is under $100k (phasing out to $0 by $150k); unused losses carry forward. On sale, claimed depreciation is recaptured at up to 25%, and gains may owe capital-gains tax (a 1031 exchange can defer both). Figures are a year-1 estimate at your 24.0% rate — not tax advice; consult a CPA.
Condition & rehab AI · 3 photos
This 15-unit multi-family property requires extensive repairs and maintenance to bring it up to a livable condition. Immediate focus should be on the fencing, roof, and exterior repairs to improve safety and curb appeal.
Repairs flagged
- Major fencing — Damaged and overgrown
- Major roof — Missing shingles and potential water damage
- Major exteriors — General disrepair
Value-add opportunities
- Both landscaping and fencing repair — Improves curb appeal and safety
- Both roof repair — Prevents water damage and improves structural integrity
- Both exterior repairs — Enhances overall appearance and safety
Renovation cost estimate screening
| Repair item | Severity | Est. cost |
|---|---|---|
| fencing · Damaged and overgrown | Major | $15,000–50,000 |
| roof · Missing shingles and potential water damage | Major | $15,000–50,000 |
| exteriors · General disrepair | Major | $15,000–50,000 |
| Total estimated repair cost · 3 items | $45,000–150,000 |
Value-add ROI direction
- Both landscaping and fencing repair — Improves curb appeal and safety ↑
- Both roof repair — Prevents water damage and improves structural integrity ↑
- Both exterior repairs — Enhances overall appearance and safety ↑
ⓘ Cost ranges are severity-bucket heuristics (US national rule-of-thumb). Get contractor quotes + a written scope before underwriting a rehab budget.
Schools (NCES district)
- District
- Butler Area SD
- NCES district ID
- 4204590
- Math proficiency
- 41% ▼ -11.00%
- Reading proficiency
- 59% ▼ -10.00%
- Median HH income
- $49,348
- Composite
- 42.65/100
- National rank
- #3180
- State rank
- #181 of 539 in PA
Livability — Butler
- Score
- 71/100
- State rank
- #705
- US rank
- #6951
Category grades
Schools grade is shown separately in the Schools card above.
Census & demographics
- Census place
- Butler, PA
- County
- Butler County · 73,107 people
- City population
- 39,234
- Metro
- Pittsburgh, PA
- Population (ZIP)
- 39,234
- Household income
- $63,635
- Rent vs Own
- Severe rent burden
- 1441.0
Population outlook (Butler County) Hauer SSP2
- Today (2025)
- 190,777 people
- By 2030
- 191,476 · +0.4%
- By 2040
- 189,474 · -0.7%
- By 2050
- 182,050 · -4.6%
- By 2075
- 159,526 · -16.4%
- By 2100
- 129,028 · -32.4%
Race, ethnicity, and origin ACS 2023
- Neighborhood character
- Predominantly White (92%)
- Race & ethnicity
- White 92% Two or more races 4% Hispanic / Latino 2% Black 1%
- Common ancestry
- Romanian 8% Serbian 4% Slovak 2%
- Foreign-born
- 1% · Canada
- Languages at home
- 98% English-only · Spanish 1%
Political lean MEDSL · Butler
- 2024 margin
- Solid R (+32.2) · D 33.5% · R 65.7%
- 2008→2024 swing
- -4.8pp toward R · 2008: -27.4pp · 2024: -32.2pp
- All cycles
- 2024: R+32.2 2020: R+32.5 2016: R+37.5 2012: R+34.9 2008: R+27.4
Not yet ingested
- Civics
- —
Market trends
- HPI YoY
- ▼ -103.40%
- Current HPI
- 222.4445
- Rent YoY
- ▲ 20.36%
- Metro
- Pittsburgh, PA
- State GDP YoY
- ▲ 1.68%
- F500 in state
- 34
Industry mix (Fortune 500 HQ in PA)
| Industry | F500 HQs | Revenue |
|---|---|---|
| Healthcare | 2 | $309B |
|
||
| Insurance | 2 | $27B |
|
||
| Telecommunications / Media | 1 | $124B |
|
||
| Industrial Distribution | 1 | $22B |
|
||
| Financial Services | 1 | $20B |
|
||
| Chemicals / Materials | 1 | $18B |
|
||
Price history
1 event — show timeline
- 2025-12-01 Listed $1,225,000 West Penn MLS
Cash-flow waterfall
monthlySold comps — $/sqft
last 12 mo · ≤1 miLoading sold comps…