10424 Leesville Rd · Motley, VA
Flood risk 1/10 · Minimal
- FEMA flood zone
- X (unshaded)
- Chance of flooding over 30 yrs
- 0.0%
- Est. flood insurance / yr
- $507 – $1,088
Fire risk 5/10 · Moderate
- Est. fire insurance / yr
- $666 – $1,236
Heat risk 5/10 · Moderate
- Hot days now (above 103°F)
- 7 days/yr
- Hot days in 30 yrs
- 18 days/yr
Wind risk 2/10 · Minimal
- Chance of severe wind over 30 yrs
- 4.0%
Air-quality risk 2/10 · Minimal
- Unhealthy air days now
- 1 days/yr
- Unhealthy air days in 30 yrs
- 1 days/yr
Risk factors via First Street. Map © Google.
Why this score? — see what drove the D- grade
The composite is a weighted blend of 9 inputs, each scored 0–100. Each bar is that input's sub-score; the figure is the points it added to the 100-point composite (weight × sub-score).
- Cash flow +7.9/30.0
- ARV discount +7.5/15.0
- Appreciation +6.4/10.0
- Schools +5.5/10.0
- Livability +3.0/5.0
- Rent growth +2.5/5.0
- Condition / age +2.5/5.0
- 1% rule +2.4/10.0
- DSCR +2.0/10.0
$319,700
🖨 Deal sheet (PDF) 📄 Offer letter ✓ Due diligence
Listing remarks MLS
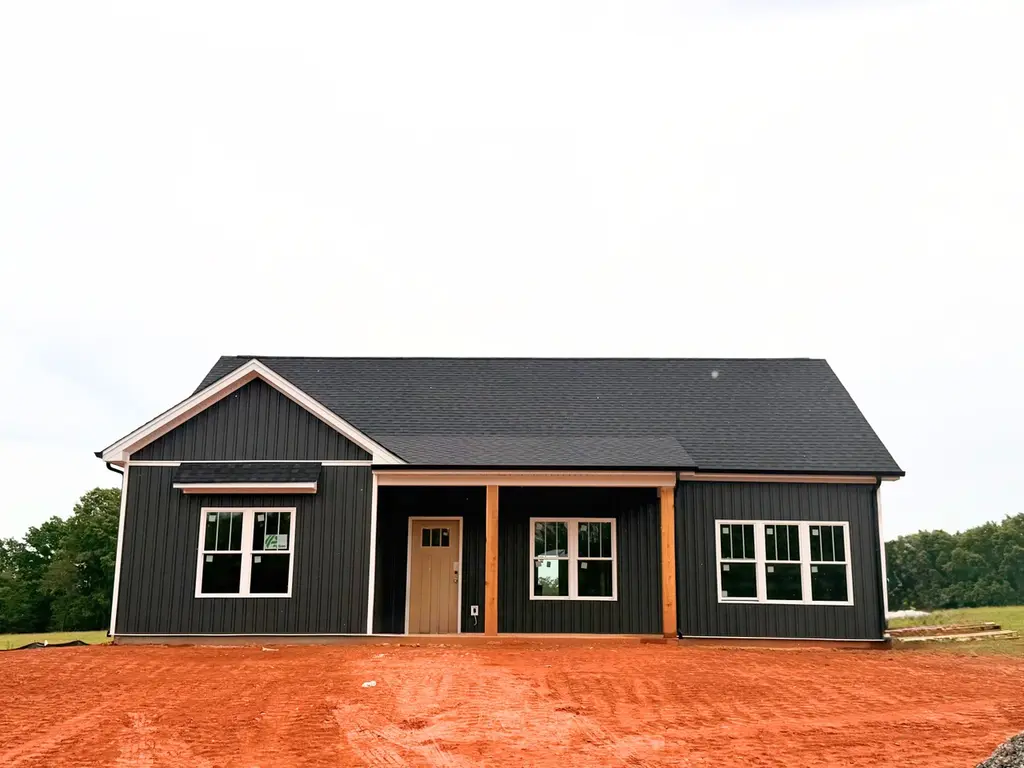
If you've been looking for new construction with some breathing room, this one checks the boxes. Sitting on just over an acre, this 3-bedroom, 2-bath home offers a split-bedroom layout, giving the primary suite its own private space. The main living area is open and inviting with granite countertops, a fireplace, and a pantry that actually gives you room to work with. Out back, you've got a large patio ready for cookouts, quiet mornings, or just enjoying the views. And you're only minutes from Smith Mountain Lake - perfect for weekends on the water. Photos are similar to. Finishes may vary.
Key facts
- Split-bedroom layout
- New construction
- Large patio
Tags
Property features AI
Finance
- Other: Lot approximately 1.06 acres
- Financial info: Annual tax amount reported
Exterior
- Parking: Off-street parking
- Home design: Residential property; New construction (2026)
- Construction: Built in 2026
- Exterior features: Front porch; Off-street parking
Interior
- Kitchen: Built-in microwave
- Bedrooms: Two bedrooms (both on the main level)
- Bathrooms: Two full bathrooms (both on the main level)
- Heating & cooling: Heat pump electric heating; Heat pump electric cooling
- Interior features: Seven total rooms; Built-in microwave oven; One fireplace
Neighborhood map
What this means for you Summary
Snapshot
- This is a 2-bed/2.0-bath single-family listed at $320k.
Deal economics
- At list price, monthly cash flow is $-341 ($-4k/yr) — negative.
- To cash-flow at today's rent, offer at most $270k (15.5% below list).
- To meet the 1% rule (rent ≥ 1% of price), the offer needs to be $236k (26.0% below list).
- Recommended offer: $236k (26.0% below list) — sets the bar for 1% rule.
- Cap rate 5.0% vs local median 3.8% in Motley — top-decile yield for the area; either an underpriced asset or a hidden risk that comps aren't pricing in. Stress-test before assuming the spread holds.
Location & tenants
- Location reads 60/100 on livability (#446 in VA) — a middle-class / working-renter tenant base. Strengths: cost of living A+, housing A+; Watch: crime C-, health & safety C-, amenities F.
- Bedford County Public School District (rural): math 55% / reading 73% proficiency, ranked #41 of 131 in VA (top 31%) — acceptable for families but not a draw, mixed tenant base, ~2y average lease.
- Zoned schools: Huddleston Elementary (math 52% / reading 67%, grade B-, #536 of 1,108 statewide, top 51%, 212 students, 82% FRL); Staunton River Middle (math 45% / reading 65%, grade B-, #189 of 342 statewide, top 56%, 627 students, 86% FRL); Staunton River High (math 39% / reading 66%, grade C-, #293 of 319 statewide, top 92%, 889 students, 69% FRL) — zoned schools average 79% FRL vs 30% district-wide (49 pts higher); higher-poverty schools than district average — tighter screening recommended.
- Market conditions: 61 active listings in the ZIP; 294 units permitted in Bedford County in 2024 (0 in 5+ unit buildings).
Forward outlook
- In year one you build about $11k of equity ($2k loan paydown + $9k appreciation (2.9% local appreciation)).
- Bedford County population projected at +8% by 2050 — modest demand growth; plan on rents tracking national, not racing it.
- By year 4, paydown + projected appreciation supports a ~$39k cash-out refi (75% LTV) — recoverable capital for the next deal without selling this one.
Negotiation context
- It's been on market 60 days — a 3% lower offer ($310k) is reasonable based on typical stale-listing flexibility.
- 2 sale attempts with the ask held roughly flat each time — persistent listings suggest the price (not the market) is what's stuck; bring a comps-based counter.
Risks & watch-outs
- Climate carrying-cost: moderate wildfire risk; extreme-heat days projected 7→18/yr by 2055 (HVAC capex compounding) — expect insurance premiums to compound above CPI over the hold.
Questions for the listing agent
- What do current leases actually rent for vs. the listed asking? Can we see a recent rent roll and the last 12 months of T-12 income?
- It's been on market 60 days. Have you received any prior offers? Is the seller open to a 26% concession, seller financing, or rate buy-down credit?
- Is there a deadline driving the sale (1031 exchange, divorce, estate, relocation)? That informs how much negotiation room exists.
- Schools are F-rated, which usually means shorter tenancies and higher turnover. Who's the typical renter profile here, and what's been the actual vacancy rate?
- The area grade is low — what's the realistic commute time and amenity access for the typical tenant pool here? Any planned neighborhood developments (good or bad) we should know about?
- What's the average days-on-market for RENTAL listings here right now (not sales)? A rising rental-DOM trend means longer vacancies and softer asking-rent achievability than the comps imply.
- What's the recent tenant-quality profile in this submarket — average credit score on applications, eviction rate, late-payment / NSF rate, and stable-employment percentage? A property-management company in the area should have these aggregated.
- How much new for-sale + rental construction is in the pipeline within 1–3 miles? Heavy new supply typically softens prices + rents 12–24 months out; constrained supply supports both.
Investment metrics
- 1% rule
- 0.74% ✗
- Cap rate
- 5.01%
- Cash-on-cash
- -4.58%
- DSCR
- 0.80
- GRM
- 11.3
CMA / ARV
- ARV (median comp)
- $319,826
- List price
- $319,700
- Delta
- -0.04%
- Verdict
- FAIR
- Comps
- 12 within 1.0 mi
Show comp detail 6 sales within ~0.75 mi
| Address | Dist | Beds/Ba | Sqft | Sold | Price | $/sf | Match |
|---|---|---|---|---|---|---|---|
| 10578 Leesville Rd | 0.13mi | 3/2.0 (+1) | 1,555 (+8%) | 1mo | $380,000 | $244 | 74 |
| 2526 Smith Mountain Lake Pkwy | 0.52mi | 3/2.0 (+1) | 1,434 (0%) | 14mo | $335,000 | $234 | 59 |
| 2308 Smith Mountain Lake Pkwy | 0.35mi | 3/2.0 (+1) | 1,620 (+13%) | 7mo | $319,900 | $197 | 51 |
| 2308 Smith Mountain Lake Pkwy | 0.36mi | 3/2.0 (+1) | 1,620 (+13%) | 9mo | $319,900 | $197 | 49 |
| 2626 Smith Mountain Lake Pkwy | 0.60mi | 3/2.0 (+1) | 1,554 (+8%) | 14mo | $349,900 | $225 | 42 |
| 2133 Smith Mountain Lake Pkwy | 0.36mi | 3/2.0 (+1) | 1,620 (+13%) | 23mo | $300,000 | $185 | 37 |
Match score weights: distance 35% · size 25% · config 20% · recency 20%. Top-matched comps best support the ARV.
Projected returns pro-forma
2.88% appreciation · 3.0% rent growth · sell at horizon
- IRR
- 2.9%
- Equity multiple
- 1.16×
- Total profit
- $14,698
- Equity at exit
- $141,516
- IRR
- 6.4%
- Equity multiple
- 1.96×
- Total profit
- $85,526
- Equity at exit
- $216,372
Cash invested: $89,516 (down + closing). Projections, not guarantees.
Landlord ↔ Tenant lean methodology
- Overall (STATE)
- 55 Moderately Landlord-Leaning
- State Virginia
- 55 Moderately Landlord-Leaning · D+2
- County
- — inherits STATE
- City
- — inherits STATE
ZIP-level market 24571
- Home prices YoY
- 1.8%
- Active inventory
- 61
- Price-to-rent
- 11.3×
Monthly cashflow live
- Estimated rent
- $2,364 medium interval (Pro) →
- Mortgage (P&I)
- −$1,677
- Tax est. 1.5%
- −$400 /mo · $4,796/yr
- Insurance
- −$133
- HOA
- −$0
- Vacancy / Maint / Mgmt
- −$497
- Net cashflow
- $-341
Break-even live
Sensitivity live
| Price | -10% $-121 | -5% $-231 | +0% $-341 | +5% $-452 | +10% $-562 |
|---|---|---|---|---|---|
| Rent | -10% $-528 | -5% $-435 | +0% $-341 | +5% $-248 | +10% $-155 |
| Rate | -1.0pp $-180 | -0.5pp $-260 | base $-341 | +0.5pp $-424 | +1.0pp $-509 |
UW: 25.0% down · 7.5% · 30yr · 1.5% tax · 5.0% vac · 8.0% maint · 8.0% mgmt
Financing live
Cash to close
- Down payment
- $79,925
- Closing costs
- $9,591
- Reserves months
- —
- Total cash needed
- —
Loan-product check · same deal, 3 products live
Conventional
25% down · 7.5% · 30yr
- Down + closing
- —
- Monthly P&I
- —
- Monthly cashflow
- —
- DSCR
- —
- Eligible?
- —
Personal DTI + credit; lowest rate.
DSCR
20% down · 8.5% · 30yr
- Down + closing
- —
- Monthly P&I
- —
- Monthly cashflow
- —
- DSCR
- —
- Eligible?
- —
No personal income docs; deal must DSCR.
Hard money
10% down · 12.0% · 12mo
- Down + closing
- —
- Monthly P&I
- —
- Monthly cashflow
- —
- DSCR
- —
- Eligible?
- —
Short-term bridge; refi at stabilization.
Listing history 20 events
-
2026-06-22days on market $319,700 Active 60 DOM
-
2026-06-19days on market $319,700 Active 58 DOM
-
2026-06-18days on market $319,700 Active 57 DOM
-
2026-06-17days on market $319,700 Active 56 DOM
-
2026-06-16days on market $319,700 Active 55 DOM
-
2026-06-15days on market $319,700 Active 54 DOM
-
2026-06-14days on market $319,700 Active 52 DOM
-
2026-06-13days on market $319,700 Active 51 DOM
-
2026-06-10days on market $319,700 Active 49 DOM
-
2026-06-09days on market $319,700 Active 48 DOM
-
2026-06-08days on market $319,700 Active 47 DOM
-
2026-06-07days on market $319,700 Active 46 DOM
-
2026-06-05days on market $319,700 Active 43 DOM
-
2026-06-03days on market $319,700 Active 42 DOM
-
2026-06-02days on market $319,700 Active 41 DOM
-
2026-06-01days on market $319,700 Active 40 DOM
-
2026-05-31days on market $319,700 Active 39 DOM
-
2026-05-30days on market $319,700 Active 38 DOM
-
2026-04-22$319,700 Active 594-char remark
Show marketing remark (597 chars)
If you've been looking for new construction with some breathing room, this one checks the boxes. Sitting on just over an acre, this 3-bedroom, 2-bath home offers a split-bedroom layout, giving the primary suite its own private space. The main living area is open and inviting with granite countertops, a fireplace, and a pantry that actually gives you room to work with. Out back, you've got a large patio ready for cookouts, quiet mornings, or just enjoying the views. And you're only minutes from Smith Mountain Lake - perfect for weekends on the water. Photos are similar to. Finishes may vary.
ⓘ Source: listings_history table (triggers on properties + properties_extension) + one-shot
backfill from property_details.listing_events for pre-trigger history.
Climate risk First Street
- Flood 1/10 Low FEMA zone X (unshaded) · 0% chance over 30 yrs
- Wildfire 5/10 Major
- Heat 5/10 Major 7 d/yr ≥103°F today · 18 d/yr by 30 yrs out
- Wind 2/10 Low 4% chance of damaging wind over 30 yrs
- Air quality 2/10 Low 1 unhealthy d/yr today · 1 by 30 yrs out
Nearby sold comps map
Loading sold comps map…
Walkable amenities ~0.75 mi
Loading nearby amenities…
Taxation est. · year 1
- Rental income
- $28,373
- − Mortgage interest
- −$17,908
- − Property taxes
- −$4,796
- − Insurance
- −$1,598
- − Repairs & maintenance
- −$2,270
- − Management
- −$2,270
- − Depreciation
- −$9,300
- Taxable loss
- −$9,769
- Est. tax savings @ 24.0%
- +$2,345
- After-tax cash flow
- $-1,753/yr
For passive investors: Depreciation is non-cash, so a rental often shows a tax loss while cash-flowing — sheltering income. Rental losses are passive: they offset passive income freely, and up to $25,000/yr can offset ordinary (W-2) income if you actively participate and your MAGI is under $100k (phasing out to $0 by $150k); unused losses carry forward. On sale, claimed depreciation is recaptured at up to 25%, and gains may owe capital-gains tax (a 1031 exchange can defer both). Figures are a year-1 estimate at your 24.0% rate — not tax advice; consult a CPA.
Schools (NCES district)
- District
- Bedford County Public School District
- NCES district ID
- 5100360
- Math proficiency
- 55% ▼ -29.00%
- Reading proficiency
- 73% ▼ -7.00%
- Median HH income
- $56,288
- Composite
- 54.92/100
- National rank
- #1310
- State rank
- #41 of 131 in VA
Livability — Motley
- Score
- 60/100
- State rank
- #446
- US rank
- #19122
Category grades
Schools grade is shown separately in the Schools card above.
Census & demographics
- Population (ZIP)
- 2,073
Population outlook (Bedford County) Hauer SSP2
- Today (2025)
- 83,194 people
- By 2030
- 85,499 · +2.8%
- By 2040
- 88,834 · +6.8%
- By 2050
- 90,060 · +8.3%
- By 2075
- 94,131 · +13.1%
- By 2100
- 89,832 · +8.0%
Race, ethnicity, and origin ACS 2023
- Neighborhood character
- Predominantly White (77%)
- Race & ethnicity
- White 77% Two or more races 9% Black 9% Hispanic / Latino 5% Asian 1% Pacific Islander 1%
- Common ancestry
- Slovak 4% Italian 2% Portuguese 1%
- Foreign-born
- 4% · Canada, China
- Languages at home
- 95% English-only · Spanish 3% Chinese 1% Other Asian/Pacific 1%
Political lean MEDSL · Bedford
- 2024 margin
- Solid R (+50.4) · D 24.4% · R 74.8%
- 2008→2024 swing
- -13.0pp toward R · 2008: -37.4pp · 2024: -50.4pp
- All cycles
- 2024: R+50.4 2020: R+48.1 2016: R+49.4 2012: R+45.0 2008: R+37.4
Not yet ingested
- Civics
- —
Market trends
- HPI YoY
- ▲ 2.88%
- Current HPI
- 164.3696
- Rent YoY
- —
- Metro
- —
- State GDP YoY
- ▲ 2.40%
- F500 in state
- 50
Industry mix (Fortune 500 HQ in VA)
| Industry | F500 HQs | Revenue |
|---|---|---|
| Aerospace / Defense | 4 | $236B |
|
||
| Technology / Defense | 3 | $32B |
|
||
| Financial Services | 2 | $176B |
|
||
| Utilities | 2 | $27B |
|
||
| Insurance | 2 | $25B |
|
||
| Technology | 2 | $15B |
|
||
Price history
+0.0% since first listed2 events — show timeline
- 2026-04-22 Listed $319,700 MLSRV
- 2026-04-22 Listed $319,700 LMLS
Cash-flow waterfall
monthlySold comps — $/sqft
last 12 mo · ≤1 miLoading sold comps…