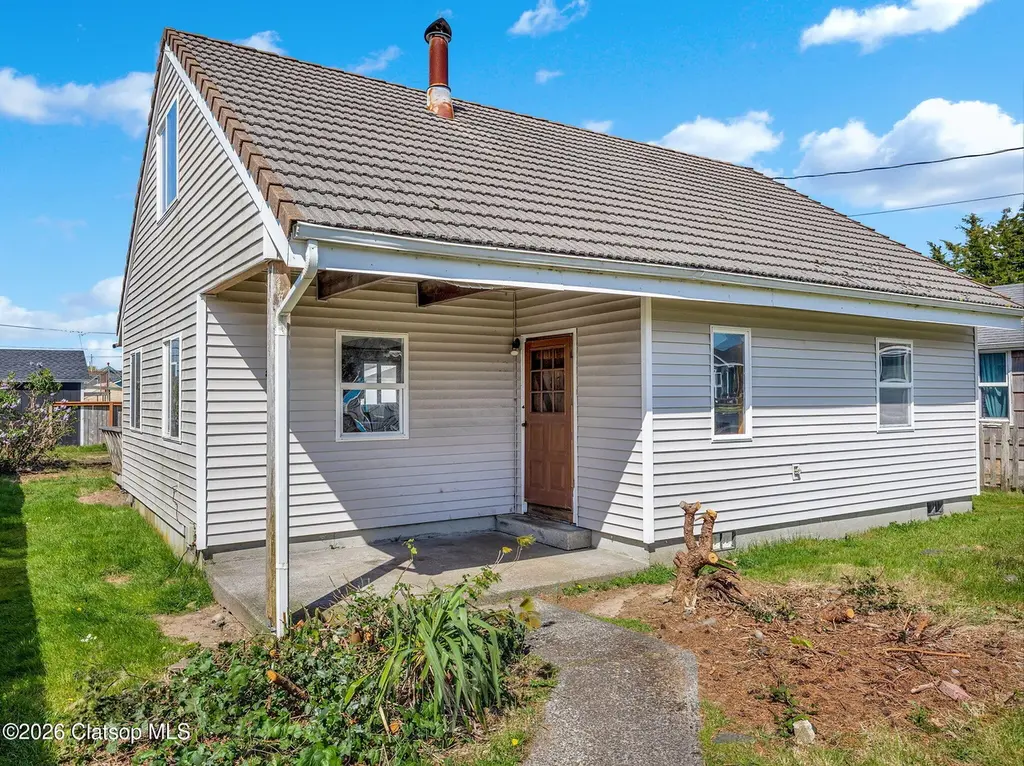
830 2nd Ave · Seaside, OR
Flood risk 4/10 · Minor
- FEMA flood zone
- X (unshaded)
- Chance of flooding over 30 yrs
- 0.22%
- Est. flood insurance / yr
- $473 – $860
Fire risk 1/10 · Minimal
- Est. fire insurance / yr
- $498 – $926
Heat risk 1/10 · Minimal
- Hot days now (above 77°F)
- 8 days/yr
- Hot days in 30 yrs
- 17 days/yr
Wind risk 1/10 · Minimal
- Chance of severe wind over 30 yrs
- —
Air-quality risk 6/10 · Moderate
- Unhealthy air days now
- 6 days/yr
- Unhealthy air days in 30 yrs
- 6 days/yr
Risk factors via First Street. Map © Google.
Why this score? — see what drove the A- grade
The composite is a weighted blend of 9 inputs, each scored 0–100. Each bar is that input's sub-score; the figure is the points it added to the 100-point composite (weight × sub-score).
- Cash flow +28.7/30.0
- ARV discount +15.0/15.0
- DSCR +10.0/10.0
- Appreciation +10.0/10.0
- 1% rule +7.5/10.0
- Livability +4.0/5.0
- Rent growth +2.5/5.0
- Condition / age +2.5/5.0
- Schools +2.2/10.0
$270,000
🖨 Deal sheet 📄 Offer letter ✓ Due diligence
Listing remarks MLS
Unlock the potential of this 3 bedroom, 2 bathroom fixer upper! Located just a short distance from downtown amenities and the beach, this property offers incredible opportunity for those willing to put in the work. Whether you're looking to renovate and flip or build long-term equity in a prime location, the potential here is undeniable! Sold As-Is and priced accordingly. Upstairs bathroom was not permitted when added in the 1980's. Buyer to perform their own due diligence regarding permits, condition and all aspects of the property.
Key facts
- Prime location
- 4,791 sq ft lot
- Built 1980
Tags
Property features AI
Finance
- Other: Property includes territorial view
- HOA & community: Not a senior community; Zoning: R2
Exterior
- Parking: Carport; Off-street parking
- Security: No security features reported
- Utilities: Public water; Public sewer; Electric fuel for hot water (electric tank); Electric power
- Home design: Single-family residence (detached); Residential property; Fixer condition; Main and upper levels (two-level layout); Built in 1980
- Construction: Concrete perimeter foundation; Built 1980
- Exterior features: Tile roof; Vinyl siding; Deck; Porch; Yard; Level lot; Paved road access; Territorial view
Interior
- Kitchen: Disposal; Free-standing range; Free-standing refrigerator
- Bedrooms: Primary bedroom on main level; Second bedroom on upper level; Third bedroom on upper level
- Flooring: Vinyl flooring; Wall-to-wall carpet
- Bathrooms: Two full bathrooms (one on main level, one on upper level)
- Heating & cooling: Baseboard heating; No central air conditioning
- Interior features: Accessible home features including minimal steps and walk-in shower; Main-floor bedroom with bath; Laundry area on main floor; Laundry hook-ups (washer/dryer); Vinyl windows with vinyl frames; Vinyl and wall-to-wall carpet flooring
- Laundry & utility: Main-level laundry room; Washer and dryer included
Neighborhood map
What this means for you Summary
Snapshot
- This is a 3-bed/1.0-bath single-family listed at $270k.
Deal economics
- At list price, monthly cash flow is $897 ($11k/yr) — positive.
- The deal already cash-flows at list — no discount required.
- Meets the 1% rule at list price ($3k rent vs $270k).
- Cap rate 10.3% vs local median 2.5% in Seaside — top-decile yield for the area; either an underpriced asset or a hidden risk that comps aren't pricing in. Stress-test before assuming the spread holds.
Location & tenants
- Location reads 79/100 on livability (#60 in OR, #2,085 nationally) — a middle-class / working-renter tenant base. Strengths: amenities A+, commute A+, health & safety A+; Watch: employment C-, crime D+, cost of living D+.
- Seaside SD 10 (town): math 11% / reading 41% proficiency, ranked #53 of 58 in OR (top 91%) — low school quality limits family demand, transient renter base, plan for 1-2y turnover.
- Zoned schools: Pacific Ridge Elementary School (math 12% / reading 42%, grade F, #301 of 412 statewide, top 74%, 597 students, 46% FRL); Seaside Middle School (math 8% / reading 37%, grade F, #118 of 128 statewide, top 92%, 392 students, 0% FRL); Seaside High School (math 24% / reading 54%, grade F, #78 of 143 statewide, top 58%, 453 students, 56% FRL) — zoned schools average 34% FRL vs 51% district-wide (17 pts lower); this property's tenant base skews higher-income than the district average.
- Market conditions: 226 active listings in the ZIP; 7 comparable units currently listed for rent nearby; rentals lingering (median 44d on market — plan ~5-8 weeks vacancy on turnover, expect pricing pressure); 100% of comp listings sitting > 30 days — soft ceiling on asking rent; 98 units permitted in Clatsop County in 2024 (0 in 5+ unit buildings).
- At $3,378/mo this rent would consume 67% of the median local household income ($60k/yr) (locally 573% of renters already pay >50% of income on rent) — very limited rent-growth headroom before tenants either downsize or default.
Forward outlook
- In year one you build about $29k of equity ($2k loan paydown + $27k appreciation (10.0% local appreciation)).
- At projected returns (10.0% appreciation + 3.0% rent growth), your $76k cash investment doubles in ~2 years — after that, you're playing with house money.
- By year 2, paydown + projected appreciation supports a ~$46k cash-out refi (75% LTV) — recoverable capital for the next deal without selling this one.
Negotiation context
- Only 4 days on market — expect competitive offers; lowballing is unlikely to land.
- 2 sale attempts with the ask held roughly flat each time — persistent listings suggest the price (not the market) is what's stuck; bring a comps-based counter.
Questions for the listing agent
- Is there a deadline driving the sale (1031 exchange, divorce, estate, relocation)? That informs how much negotiation room exists.
- Schools are D-rated, which usually means shorter tenancies and higher turnover. Who's the typical renter profile here, and what's been the actual vacancy rate?
- Crime grade is D in this area — have there been break-ins, vandalism, or insurance claims at this property in the last 3 years? What carrier currently insures it and at what premium?
- What's the average days-on-market for RENTAL listings here right now (not sales)? A rising rental-DOM trend means longer vacancies and softer asking-rent achievability than the comps imply.
- What's the recent tenant-quality profile in this submarket — average credit score on applications, eviction rate, late-payment / NSF rate, and stable-employment percentage? A property-management company in the area should have these aggregated.
- How much new for-sale + rental construction is in the pipeline within 1–3 miles? Heavy new supply typically softens prices + rents 12–24 months out; constrained supply supports both.
Investment metrics
- 1% rule
- 1.25% ✓
- Cap rate
- 10.28%
- Cash-on-cash
- 14.24%
- DSCR
- 1.63
- GRM
- 6.7
CMA / ARV
- ARV (median comp)
- $456,676
- List price
- $270,000
- Delta
- -40.88%
- Verdict
- UNDERPRICED
- Comps
- 20 within 1.0 mi
Show comp detail 12 sales within ~0.75 mi
| Address | Dist | Beds/Ba | Sqft | Sold | Price | $/sf | Match |
|---|---|---|---|---|---|---|---|
| 830 2nd Ave | 0.00mi | 3/2.0 | 1,332 (0%) | 0mo | $285,000 | $214 | 96 |
| 835 N Holladay Dr | 0.29mi | 2/1.0 (-1) | 1,381 (+4%) | 6mo | $350,000 | $253 | 70 |
| 251 10th Ave | 0.41mi | 3/2.0 | 1,392 (+4%) | 0mo | $489,000 | $351 | 69 |
| 731 11th Ave | 0.38mi | 3/1.0 | 1,262 (-5%) | 6mo | $190,500 | $151 | 69 |
| 1269 Avenue D | 0.39mi | 3/2.0 | 1,428 (+7%) | 2mo | $499,000 | $349 | 64 |
| 830 17th Ave | 0.72mi | 3/2.0 | 1,294 (-3%) | 1mo | $509,000 | $393 | 57 |
| 739 11th Ave | 0.38mi | 3/2.0 | 1,478 (+11%) | 6mo | $429,500 | $291 | 55 |
| 450 9th Ave | 0.34mi | 3/2.0 | 1,136 (-15%) | 7mo | $508,500 | $448 | 50 |
| 1210 S Columbia St | 0.73mi | 3/2.0 | 1,438 (+8%) | 0mo | $550,000 | $382 | 48 |
| 405 S Wahanna Rd | 0.50mi | 3/2.0 | 1,167 (-12%) | 5mo | $330,000 | $283 | 48 |
| 780 S Columbia St | 0.58mi | 3/2.0 | 1,501 (+13%) | 7mo | $625,000 | $416 | 42 |
| 1210 S Downing St | 0.71mi | 3/2.0 | 1,196 (-10%) | 7mo | $549,000 | $459 | 40 |
Match score weights: distance 35% · size 25% · config 20% · recency 20%. Top-matched comps best support the ARV.
Projected returns pro-forma
10.0% appreciation · 3.0% rent growth · sell at horizon
- IRR
- 34.8%
- Equity multiple
- 3.70×
- Total profit
- $204,174
- Equity at exit
- $243,237
- IRR
- 30.0%
- Equity multiple
- 8.36×
- Total profit
- $556,317
- Equity at exit
- $524,551
Cash invested: $75,600 (down + closing). Projections, not guarantees.
Landlord ↔ Tenant lean methodology
- Overall (STATE)
- 28 Tenant-Leaning
- State Oregon
- 28 Tenant-Leaning · D+6
- County
- — inherits STATE
- City
- — inherits STATE
ZIP-level market 97138
- Home prices YoY
- 2.6%
- Active inventory
- 226
- Price-to-rent
- 6.7×
Monthly cashflow live
- Estimated rent
- $3,378 high interval (Pro) →
- Mortgage (P&I)
- −$1,416
- Tax from tax record
- −$243 /mo · $2,918/yr
- Insurance
- −$112
- HOA
- −$0
- Vacancy / Maint / Mgmt
- −$709
- Net cashflow
- $897
Break-even live
UW: 25.0% down · 7.5% · 30yr · 1.5% tax · 5.0% vac · 8.0% maint · 8.0% mgmt
Financing live
Cash to close
- Down payment
- $67,500
- Closing costs
- $8,100
- Reserves months
- —
- Total cash needed
- —
Loan-product check · same deal, 3 products live
Conventional
25% down · 7.5% · 30yr
- Down + closing
- —
- Monthly P&I
- —
- Monthly cashflow
- —
- DSCR
- —
- Eligible?
- —
Personal DTI + credit; lowest rate.
DSCR
20% down · 8.5% · 30yr
- Down + closing
- —
- Monthly P&I
- —
- Monthly cashflow
- —
- DSCR
- —
- Eligible?
- —
No personal income docs; deal must DSCR.
Hard money
10% down · 12.0% · 12mo
- Down + closing
- —
- Monthly P&I
- —
- Monthly cashflow
- —
- DSCR
- —
- Eligible?
- —
Short-term bridge; refi at stabilization.
Rent comps 7 comps
| Address | Beds | Baths | Sqft | Rent | $/sqft | DOM | Units | Dist |
|---|---|---|---|---|---|---|---|---|
| 849 1st Ave Seaside, OR | 3.0 | 1.5 | 1584 | $2,900 | $1.83 | 43d | 1 | 0.05mi |
| 1020 2nd Ave Seaside, OR | 3.0 | 2.5 | 1601 | $6,100 | $3.81 | 43d | 1 | 0.10mi |
| 717 10th Ave Seaside, OR | 3.0 | 1.0 | 1562 | $2,250 | $1.44 | 43d | 1 | 0.36mi |
| 1350 Alder Dr Unit A Seaside, OR | 2.0 | 1.0 | 900 | $1,950 | $2.17 | 43d | 1 | 0.85mi |
| 1624 S Columbia St Unit 2 Seaside, OR | 2.0 | 1.0 | 900 | $1,595 | $1.77 | 43d | 1 | 0.89mi |
| 2330 Cross Creek St Seaside, OR | 2.0 | 2.0 | 890 | $1,895 | $2.13 | 43d | 1 | 1.02mi |
| 2160 Lewis and Clark Rd Seaside, OR | 1.0–2.0 | 1.0–2.0 | 814 | $1,695 | $2.08 | 43d | 3 | 1.49mi |
Listing history 4 events
-
2026-05-06status Pending 540-char remark
Show marketing remark (540 chars)
Unlock the potential of this 3 bedroom, 2 bathroom fixer upper! Located just a short distance from downtown amenities and the beach, this property offers incredible opportunity for those willing to put in the work. Whether you're looking to renovate and flip or build long-term equity in a prime location, the potential here is undeniable! Sold As-Is and priced accordingly. Upstairs bathroom was not permitted when added in the 1980's. Buyer to perform their own due diligence regarding permits, condition and all aspects of the property.
-
2026-05-01$270,000 Active 540-char remark
Show marketing remark (540 chars)
Unlock the potential of this 3 bedroom, 2 bathroom fixer upper! Located just a short distance from downtown amenities and the beach, this property offers incredible opportunity for those willing to put in the work. Whether you're looking to renovate and flip or build long-term equity in a prime location, the potential here is undeniable! Sold As-Is and priced accordingly. Upstairs bathroom was not permitted when added in the 1980's. Buyer to perform their own due diligence regarding permits, condition and all aspects of the property.
ⓘ Source: listings_history table (triggers on properties + properties_extension) + one-shot
backfill from property_details.listing_events for pre-trigger history.
Tax reassessment forecast OR · Resets to sale price
- Current annual tax
- $2,918 · $243/mo
- Projected year-2 tax
- $2,918 · $243/mo
- Expected delta
- $0/yr ($0/mo · 0.0%)
ⓘ Screening estimate from a state-policy table — verify with the county assessor before closing.
Climate risk First Street
- Flood 4/10 Moderate FEMA zone X (unshaded) · 22% chance over 30 yrs
- Wildfire 1/10 Low
- Heat 1/10 Low 8 d/yr ≥77°F today · 17 d/yr by 30 yrs out
- Wind 1/10 Low
- Air quality 6/10 Major 6 unhealthy d/yr today · 6 by 30 yrs out
Nearby sold comps map
Loading sold comps map…
Walkable amenities ~0.75 mi
Loading nearby amenities…
Taxation est. · year 1
- Rental income
- $40,535
- − Mortgage interest
- −$15,124
- − Property taxes
- −$2,918
- − Insurance
- −$1,350
- − Repairs & maintenance
- −$3,243
- − Management
- −$3,243
- − Depreciation
- −$7,855
- Taxable income
- $6,803
- Est. tax owed @ 24.0%
- −$1,633
- After-tax cash flow
- $9,132/yr
For passive investors: Depreciation is non-cash, so a rental often shows a tax loss while cash-flowing — sheltering income. Rental losses are passive: they offset passive income freely, and up to $25,000/yr can offset ordinary (W-2) income if you actively participate and your MAGI is under $100k (phasing out to $0 by $150k); unused losses carry forward. On sale, claimed depreciation is recaptured at up to 25%, and gains may owe capital-gains tax (a 1031 exchange can defer both). Figures are a year-1 estimate at your 24.0% rate — not tax advice; consult a CPA.
Schools (NCES district)
- District
- Seaside SD 10
- NCES district ID
- 4111100
- Math proficiency
- 11% ▼ -18.00%
- Reading proficiency
- 41% ▼ -4.00%
- Median HH income
- $43,956
- Composite
- 22.19/100
- National rank
- #8159
- State rank
- #53 of 58 in OR
Livability — Seaside
- Score
- 79/100
- State rank
- #60
- US rank
- #2085
Category grades
Schools grade is shown separately in the Schools card above.
Census & demographics
- Census place
- Seaside, OR
- County
- Clatsop County · 29,028 people
- Metro
- Astoria, OR
- Population (ZIP)
- 11,035
- Household income
- $60,411
- Rent vs Own
- Severe rent burden
- 573.0
Population outlook (Clatsop County) Hauer SSP2
- Today (2025)
- 39,212 people
- By 2030
- 39,765 · +1.4%
- By 2040
- 40,121 · +2.3%
- By 2050
- 40,032 · +2.1%
- By 2075
- 39,123 · -0.2%
- By 2100
- 35,965 · -8.3%
Race, ethnicity, and origin ACS 2023
- Neighborhood character
- Predominantly White (89%)
- Race & ethnicity
- White 89% Hispanic / Latino 7% Two or more races 5% Black 1% Asian 1%
- Hispanic origin (detail)
- Mexican 4% Puerto Rican 1%
- Common ancestry
- Lithuanian 5% Portuguese 3% Scottish 3%
- Foreign-born
- 3% · Canada, China
- Languages at home
- 95% English-only · Spanish 3% German/W. Germanic 1%
Political lean MEDSL · Clatsop
- 2024 margin
- D (+11.4) · D 54.1% · R 42.8% · Other 3.1%
- 2008→2024 swing
- -7.6pp toward R · 2008: 18.9pp · 2024: 11.4pp
- All cycles
- 2024: D+11.4 2020: D+11.3 2016: D+6.1 2012: D+14.6 2008: D+18.9
Not yet ingested
- Civics
- —
Market trends
- HPI YoY
- ▲ 26.11%
- Current HPI
- 1014.65
- Rent YoY
- —
- Metro
- Astoria, OR
- State GDP YoY
- ▲ 2.05%
- F500 in state
- 2
Industry mix (Fortune 500 HQ in OR)
| Industry | F500 HQs | Revenue |
|---|---|---|
| Consumer Goods | 1 | $51B |
|
||
Price history
+5.6% since first listed7 events — show timeline
- 2026-06-05 Sold (Public Records) $285,000 Public Records
- 2026-06-05 Sold (MLS) $285,000 CAR
- 2026-06-05 Sold (MLS) $285,000 RMLS
- 2026-05-06 Pending — RMLS
- 2026-05-06 Pending — CAR
- 2026-05-01 Listed $270,000 CAR
- 2026-05-01 Listed $270,000 RMLS
Property tax history
+3.5%/yrLatest (2025): $2,918 · -0.1% YoY. Source: county tax records.
Cash-flow waterfall
monthlySold comps — $/sqft
last 12 mo · ≤1 miLoading sold comps…