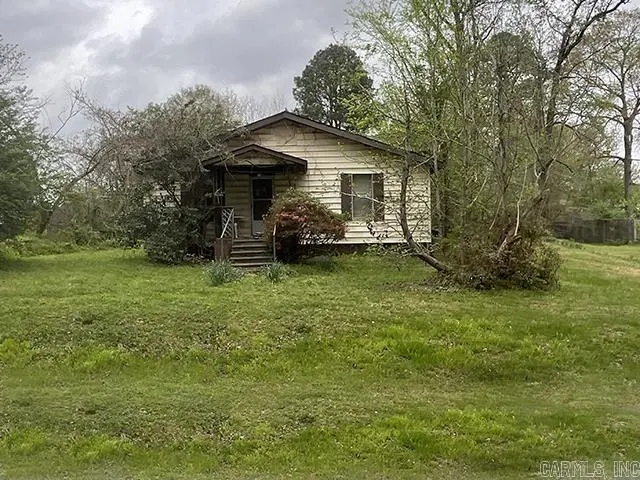
3616 Gattin Rd · Benton, AR
Flood risk 1/10 · Minimal
- FEMA flood zone
- X (unshaded)
- Chance of flooding over 30 yrs
- 0.0%
- Est. flood insurance / yr
- $507 – $1,088
Fire risk 4/10 · Minor
- Est. fire insurance / yr
- $1,499 – $2,785
Heat risk 6/10 · Moderate
- Hot days now (above 110°F)
- 7 days/yr
- Hot days in 30 yrs
- 20 days/yr
Wind risk 4/10 · Minor
- Chance of severe wind over 30 yrs
- 10.0%
Air-quality risk 2/10 · Minimal
- Unhealthy air days now
- 0 days/yr
- Unhealthy air days in 30 yrs
- 1 days/yr
Risk factors via First Street. Map © Google.
Why this score? — see what drove the B- grade
The composite is a weighted blend of 9 inputs, each scored 0–100. Each bar is that input's sub-score; the figure is the points it added to the 100-point composite (weight × sub-score).
- Cash flow +30.0/30.0
- 1% rule +10.0/10.0
- DSCR +10.0/10.0
- ARV discount +7.5/15.0
- Schools +3.7/10.0
- Livability +3.3/5.0
- Rent growth +2.7/5.0
- Condition / age +2.5/5.0
- Appreciation +0.0/10.0
$45,000
🖨 Deal sheet (PDF) 📄 Offer letter ✓ Due diligence
Listing remarks
Investor opportunity in Benton! The property offers strong potential for an investor, rental portfolio addition, or buyer looking for a project to make it their own. Inside, the home features a traditional layout. Convenient Benton location with easy access to town, shopping, schools, and commuter routes. Property is being sold as-is/where-is. No seller property disclosure. Buyers are encouraged to measure lot size and square footage of the home for themselves.
Key facts
- Traditional layout
- Benton location
- Detached
Tags
Property features AI
Finance
- Other: Lot approximately 0.55 acres (per tax records)
- Financial info: Financing available: conventional loan, cash, or in-house financing
Exterior
- Parking: Parking pads
- Utilities: Municipal electric (Entergy); Natural gas
- Home design: Frame construction; Inside city limits
- Construction: Frame exterior; Composition roof; Piers foundation
- Exterior features: Level, rural lot; Paved road access; Parking pads
Interior
- Kitchen: Free-standing stove; Dishwasher
- Flooring: Wood flooring; Vinyl flooring
- Bathrooms: 1 full bathroom
- Heating & cooling: Central gas heating; Central electric cooling
- Interior features: Wood and vinyl floors; Free-standing stove; Dishwasher
Neighborhood map
What this means for you Summary
Snapshot
- This is a 3-bed/1.0-bath single-family listed at $45k.
Deal economics
- At list price, monthly cash flow is $969 ($12k/yr) — positive.
- The deal already cash-flows at list — no discount required.
- Meets the 1% rule at list price ($2k rent vs $45k).
- Cap rate 32.1% vs local median 4.4% in Benton — top-decile yield for the area; either an underpriced asset or a hidden risk that comps aren't pricing in. Stress-test before assuming the spread holds.
Location & tenants
- Location reads 66/100 on livability (#119 in AR) — a middle-class / working-renter tenant base. Strengths: cost of living A+, housing A+; Watch: crime D, amenities F, commute F.
- Bauxite School District (rural): math 43% / reading 41% proficiency, ranked #44 of 238 in AR (top 18%) — families likely to look elsewhere, expect single-tenant / working-renter base with shorter leases.
- Zoned schools: Pine Haven Elementary School (math 52% / reading 37%, grade F, #143 of 454 statewide, top 36%, 750 students, 41% FRL); Bauxite Middle School (math 46% / reading 46%, grade D+, #53 of 201 statewide, top 28%, 369 students, 39% FRL); Bauxite High School (math 24% / reading 37%, grade F, #134 of 292 statewide, top 47%, 492 students, 29% FRL) — zoned schools at 36% FRL track the district average.
- Market conditions: Rents flat; 203 active listings in the ZIP; 6 comparable units currently listed for rent nearby; rentals lingering (median 46d on market — plan ~5-8 weeks vacancy on turnover, expect pricing pressure); 50% of comp listings sitting > 30 days — soft ceiling on asking rent; 446 units permitted in Saline County in 2024 (0 in 5+ unit buildings).
Forward outlook
- Local home prices are declining (-3.0%/yr); year-one equity from $311 of loan paydown is wiped out by about $1k of value loss. Plan a longer hold.
- Saline County population projected at +39% by 2050 — long-run rental-demand tailwind backs the buy-and-hold thesis.
- At projected returns (-3.0% appreciation + 0.7% rent growth), your $13k cash investment doubles in ~2 years — after that, you're playing with house money.
Negotiation context
- Only 13 days on market — expect competitive offers; lowballing is unlikely to land.
- Current owner paid $31k; 45% above their basis — modest negotiation headroom, anchor on the comps not their cost.
Risks & watch-outs
- Climate carrying-cost: extreme-heat days projected 7→20/yr by 2055 (HVAC capex compounding) — expect insurance premiums to compound above CPI over the hold.
Questions for the listing agent
- Built in 1977 — when were the roof, HVAC, electrical panel, plumbing, and water heater last replaced?
- Is there a deadline driving the sale (1031 exchange, divorce, estate, relocation)? That informs how much negotiation room exists.
- Crime grade is D in this area — have there been break-ins, vandalism, or insurance claims at this property in the last 3 years? What carrier currently insures it and at what premium?
- What's the average days-on-market for RENTAL listings here right now (not sales)? A rising rental-DOM trend means longer vacancies and softer asking-rent achievability than the comps imply.
- What's the recent tenant-quality profile in this submarket — average credit score on applications, eviction rate, late-payment / NSF rate, and stable-employment percentage? A property-management company in the area should have these aggregated.
- How much new for-sale + rental construction is in the pipeline within 1–3 miles? Heavy new supply typically softens prices + rents 12–24 months out; constrained supply supports both.
Investment metrics
- 1% rule
- 3.60% ✓
- Cap rate
- 32.13%
- Cash-on-cash
- 92.27%
- DSCR
- 5.11
- GRM
- 2.3
CMA / ARV
- ARV (on-the-fly)
- $197,736
- Comps found
- 12
Show comp detail 12 sales within ~0.75 mi
| Address | Dist | Beds/Ba | Sqft | Sold | Price | $/sf | Match |
|---|---|---|---|---|---|---|---|
| 3616 Gattin Rd | 0.00mi | 3/1.0 | 1,284 (0%) | 1mo | $50,000 | $39 | 99 |
| 3705 Winterlake Dr | 0.09mi | 3/2.0 | 1,327 (+3%) | 8mo | $180,000 | $136 | 80 |
| 3505 Maywood Ct | 0.43mi | 3/1.5 | 1,297 (+1%) | 11mo | $200,000 | $154 | 67 |
| 204 Wild Ivy Cv | 0.51mi | 3/2.0 | 1,302 (+1%) | 7mo | $209,900 | $161 | 64 |
| 1102 N Shady Ln | 0.68mi | 3/2.0 | 1,302 (+1%) | 1mo | $200,000 | $154 | 61 |
| 4121 Faye Cir Cir | 0.44mi | 2/1.0 (-1) | 1,160 (-10%) | 0mo | $152,000 | $131 | 58 |
| 414 S Shady Ln | 0.45mi | 3/2.0 | 1,426 (+11%) | 1mo | $215,000 | $151 | 56 |
| 207 Wild Cherry Dr | 0.62mi | 3/2.0 | 1,340 (+4%) | 6mo | $230,000 | $172 | 54 |
| 613 Church St | 0.48mi | 2/1.0 (-1) | 1,131 (-12%) | 2mo | $85,000 | $75 | 51 |
| 816 Coral Cv | 0.72mi | 3/2.0 | 1,363 (+6%) | 2mo | $215,000 | $158 | 51 |
| 921 Athens Ln | 0.71mi | 3/2.0 | 1,232 (-4%) | 7mo | $194,900 | $158 | 50 |
| 848 Cole Dr | 0.74mi | 3/2.0 | 1,097 (-15%) | 10mo | $166,000 | $151 | 28 |
Match score weights: distance 35% · size 25% · config 20% · recency 20%. Top-matched comps best support the ARV.
Projected returns pro-forma
-3.0% appreciation · 0.73% rent growth · sell at horizon
- IRR
- 90.5%
- Equity multiple
- 5.03×
- Total profit
- $50,821
- Equity at exit
- $6,710
- IRR
- 92.9%
- Equity multiple
- 9.70×
- Total profit
- $109,624
- Equity at exit
- $3,891
Cash invested: $12,600 (down + closing). Projections, not guarantees.
Landlord ↔ Tenant lean methodology
- Overall (STATE)
- 92 Strongly Landlord-Friendly
- State Arkansas
- 92 Strongly Landlord-Friendly · R+14
- County
- — inherits STATE
- City
- — inherits STATE
ZIP-level market 72015
- Home prices YoY
- -11.1%
- Rents YoY
- 0.7%
- Active inventory
- 203
- Price-to-rent
- 2.3×
Monthly cashflow live
- Estimated rent
- $1,620 high interval (Pro) →
- Mortgage (P&I)
- −$236
- Tax est. 1.5%
- −$56 /mo · $675/yr
- Insurance
- −$19
- HOA
- −$0
- Vacancy / Maint / Mgmt
- −$340
- Net cashflow
- $969
Break-even live
Sensitivity live
| Price | -10% $1,000 | -5% $984 | +0% $969 | +5% $953 | +10% $938 |
|---|---|---|---|---|---|
| Rent | -10% $841 | -5% $905 | +0% $969 | +5% $1,033 | +10% $1,097 |
| Rate | -1.0pp $992 | -0.5pp $980 | base $969 | +0.5pp $957 | +1.0pp $945 |
UW: 25.0% down · 7.5% · 30yr · 1.5% tax · 5.0% vac · 8.0% maint · 8.0% mgmt
Financing live
Cash to close
- Down payment
- $11,250
- Closing costs
- $1,350
- Reserves months
- —
- Total cash needed
- —
Loan-product check · same deal, 3 products live
Conventional
25% down · 7.5% · 30yr
- Down + closing
- —
- Monthly P&I
- —
- Monthly cashflow
- —
- DSCR
- —
- Eligible?
- —
Personal DTI + credit; lowest rate.
DSCR
20% down · 8.5% · 30yr
- Down + closing
- —
- Monthly P&I
- —
- Monthly cashflow
- —
- DSCR
- —
- Eligible?
- —
No personal income docs; deal must DSCR.
Hard money
10% down · 12.0% · 12mo
- Down + closing
- —
- Monthly P&I
- —
- Monthly cashflow
- —
- DSCR
- —
- Eligible?
- —
Short-term bridge; refi at stabilization.
Rent comps 6 comps
| Address | Beds | Baths | Sqft | Rent | $/sqft | DOM | Units | Dist |
|---|---|---|---|---|---|---|---|---|
| 303 Stone Creek Dr Benton, AR | 3.0 | 2.0 | 1508 | $1,811 | $1.20 | 46d | 1 | 0.14mi |
| 319 Autumn Dr Benton, AR | 4.0 | 2.0 | 1609 | $1,525 | $0.95 | 46d | 1 | 0.36mi |
| 415 S Shady Ln Benton, AR | 3.0 | 2.0 | 1556 | $1,675 | $1.08 | 16d | 1 | 0.47mi |
| 1309 Country Oaks Dr Benton, AR | 2.0 | 2.0 | 920 | $950 | $1.03 | 16d | 1 | 0.89mi |
| 3400 Alcoa Rd Benton, AR | 1.0–2.0 | 1.0 | 712 | $1,005 | $1.41 | 16d | 1 | 0.97mi |
| 610 Houston Dr Benton, AR | 3.0 | 2.0 | 1586 | $1,506 | $0.95 | 46d | 1 | 1.40mi |
Listing history 3 events
-
2026-05-15historical Take Backups
-
2026-05-13$45,000 New Listing
-
1989-06-01soldstatus $31,000
ⓘ Source: listings_history table (triggers on properties + properties_extension) + one-shot
backfill from property_details.listing_events for pre-trigger history.
Climate risk First Street
- Flood 1/10 Low FEMA zone X (unshaded) · 0% chance over 30 yrs
- Wildfire 4/10 Moderate
- Heat 6/10 Major 7 d/yr ≥110°F today · 20 d/yr by 30 yrs out
- Wind 4/10 Moderate 10% chance of damaging wind over 30 yrs
- Air quality 2/10 Low 0 unhealthy d/yr today · 1 by 30 yrs out
Nearby sold comps map
Loading sold comps map…
Walkable amenities ~0.75 mi
Loading nearby amenities…
Taxation est. · year 1
- Rental income
- $19,441
- − Mortgage interest
- −$2,521
- − Property taxes
- −$675
- − Insurance
- −$225
- − Repairs & maintenance
- −$1,555
- − Management
- −$1,555
- − Depreciation
- −$1,309
- Taxable income
- $11,600
- Est. tax owed @ 24.0%
- −$2,784
- After-tax cash flow
- $8,842/yr
For passive investors: Depreciation is non-cash, so a rental often shows a tax loss while cash-flowing — sheltering income. Rental losses are passive: they offset passive income freely, and up to $25,000/yr can offset ordinary (W-2) income if you actively participate and your MAGI is under $100k (phasing out to $0 by $150k); unused losses carry forward. On sale, claimed depreciation is recaptured at up to 25%, and gains may owe capital-gains tax (a 1031 exchange can defer both). Figures are a year-1 estimate at your 24.0% rate — not tax advice; consult a CPA.
Schools (NCES district)
- District
- Bauxite School District
- NCES district ID
- 0502790
- Math proficiency
- 43% ▼ -7.00%
- Reading proficiency
- 41% ▼ -7.00%
- Median HH income
- $55,614
- Composite
- 36.7/100
- National rank
- #4597
- State rank
- #44 of 238 in AR
Livability — Benton
- Score
- 66/100
- State rank
- #119
- US rank
- #11460
Category grades
Schools grade is shown separately in the Schools card above.
Census & demographics
- Census place
- Benton, AR
- County
- Saline County · 77,216 people
- City population
- 58,767
- Metro
- Little Rock-North Little Rock-Conway, AR
- Population (ZIP)
- 28,712
- Household income
- $66,107
- Rent vs Own
- Severe rent burden
- 439.0
Population outlook (Saline County) Hauer SSP2
- Today (2025)
- 140,141 people
- By 2030
- 151,233 · +7.9%
- By 2040
- 173,100 · +23.5%
- By 2050
- 194,368 · +38.7%
- By 2075
- 245,295 · +75.0%
- By 2100
- 279,117 · +99.2%
Race, ethnicity, and origin ACS 2023
- Neighborhood character
- Predominantly White (79%)
- Race & ethnicity
- White 79% Black 10% Two or more races 6% Hispanic / Latino 5%
- Common ancestry
- Slovak 3% Italian 2% Lithuanian 1%
- Foreign-born
- 2% · Canada, Vietnam
- Languages at home
- 97% English-only · Spanish 3% Vietnamese 0%
Political lean MEDSL · Saline
- 2024 margin
- Solid R (+40.1) · D 28.8% · R 69.0% · Other 2.2%
- 2008→2024 swing
- +0.8pp no change · 2008: -41.0pp · 2024: -40.1pp
- All cycles
- 2024: R+40.1 2020: R+41.2 2016: R+43.5 2012: R+42.7 2008: R+41.0
Not yet ingested
- Civics
- —
Market trends
- HPI YoY
- ▼ -29.11%
- Current HPI
- 234.4644
- Rent YoY
- ▲ 0.73%
- Metro
- Little Rock-North Little Rock-Conway, AR
- State GDP YoY
- ▲ 3.80%
- F500 in state
- 10
Industry mix (Fortune 500 HQ in AR)
| Industry | F500 HQs | Revenue |
|---|---|---|
| Retail | 1 | $681B |
|
||
| Food / Agriculture | 1 | $53B |
|
||
| Retail / Energy | 1 | $22B |
|
||
| Transportation / Logistics | 1 | $12B |
|
||
| Energy | 1 | $4B |
|
||
Price history
+45.2% since first listed3 events — show timeline
- 2026-05-15 Contingent — CARMLS
- 2026-05-13 Listed $45,000 CARMLS
- 1989-06-01 Sold (Public Records) $31,000 Public Records
Property tax history
-15.1%/yrLatest (2025): $26 · +0.0% YoY. Source: county tax records.
Cash-flow waterfall
monthlySold comps — $/sqft
last 12 mo · ≤1 miLoading sold comps…