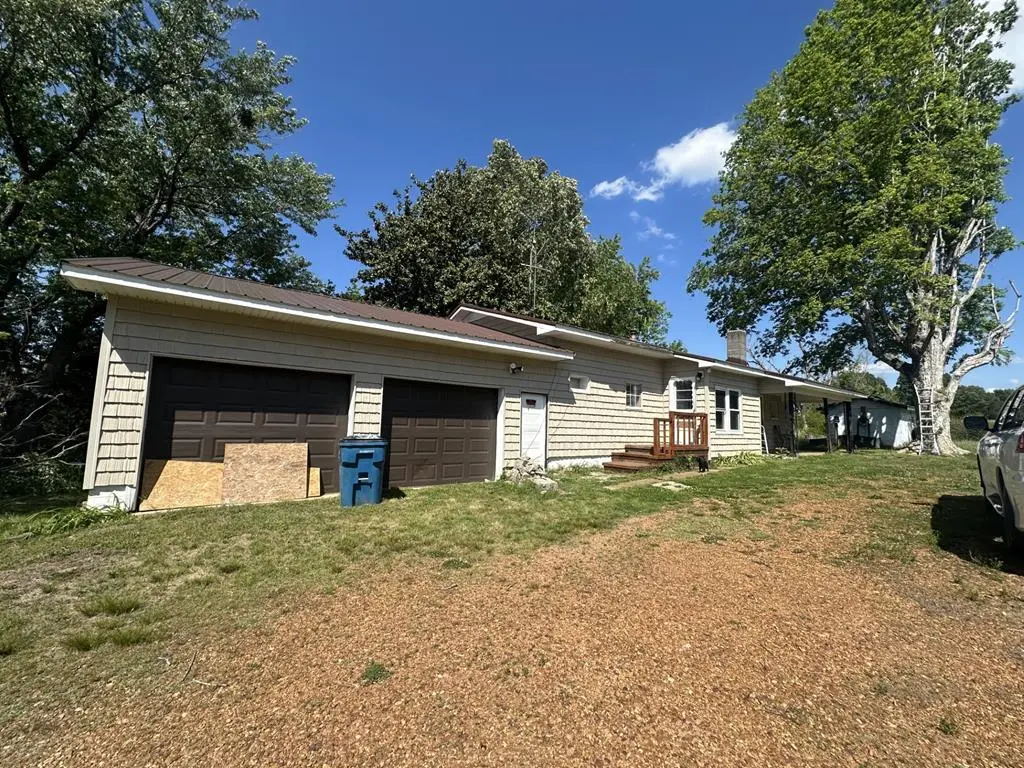
7695 Highway 140e · Buchanan, TN
Flood risk 1/10 · Minimal
- FEMA flood zone
- X (unshaded)
- Chance of flooding over 30 yrs
- 0.0%
- Est. flood insurance / yr
- $507 – $1,088
Fire risk 5/10 · Moderate
- Est. fire insurance / yr
- $949 – $1,763
Heat risk 5/10 · Moderate
- Hot days now (above 108°F)
- 7 days/yr
- Hot days in 30 yrs
- 20 days/yr
Wind risk 4/10 · Minor
- Chance of severe wind over 30 yrs
- 10.0%
Air-quality risk 1/10 · Minimal
- Unhealthy air days now
- 0 days/yr
- Unhealthy air days in 30 yrs
- 0 days/yr
Risk factors via First Street. Map © Google.
Why this score? — see what drove the B+ grade
The composite is a weighted blend of 9 inputs, each scored 0–100. Each bar is that input's sub-score; the figure is the points it added to the 100-point composite (weight × sub-score).
- Cash flow +30.0/30.0
- 1% rule +10.0/10.0
- DSCR +10.0/10.0
- Appreciation +10.0/10.0
- ARV discount +7.5/15.0
- Rent growth +2.5/5.0
- Schools +2.5/10.0
- Livability +2.5/5.0
- Condition / age +2.5/5.0
$59,900
🖨 Deal sheet 📄 Offer letter ✓ Due diligence
Listing remarks
The Seller has provided the following information regarding this property: It is a single wide mobile home that has been added on to and a 2-car garage attached. At the present time there is no heat in the home, but there is a flue in the home therefore at one time may have had a wood stove. The seller is removing the appliances and the window air conditioner. VERY IMPORTANT INFORMATION: Regarding a family gravesite on the property. Please see the attached disclosures.
Key facts
- 0.88 acre lot
- 2 garage spots
- Built 1970
Property features AI
Finance
- Other: Lot is approximately 0.88 acres; Paved road access
Exterior
- Parking: Attached 2-car garage; Gravel parking; Also has open parking (total 2 parking spaces, 2 covered)
- Utilities: Private well water; Septic tank; Cable available
- Home design: Single-story mobile home; Single wide mobile home; Residential property
- Construction: Vinyl siding; Metal roof; One level
- Exterior features: Garden; Front porch
Interior
- Kitchen: No appliances listed
- Bedrooms: 1 bedroom on the main level
- Flooring: Laminate
- Bathrooms: 1 full bathroom
- Heating & cooling: No heating listed; No cooling listed
- Interior features: Laminate flooring; Crawl space basement
- Laundry & utility: No laundry appliances listed
Neighborhood map
What this means for you Summary
Snapshot
- This is a 3-bed/2.0-bath single-family listed at $60k.
Deal economics
- At list price, monthly cash flow is $560 ($7k/yr) — positive.
- The deal already cash-flows at list — no discount required.
- Meets the 1% rule at list price ($1k rent vs $60k).
- Cap rate 17.5% vs local median 1.8% in Buchanan — top-decile yield for the area; either an underpriced asset or a hidden risk that comps aren't pricing in. Stress-test before assuming the spread holds.
Location & tenants
- Location reads: area grade B — affects rentability + tenant quality, not the cash-flow math above.
- Henry County (rural): math 30% / reading 30% proficiency, ranked #60 of 139 in TN (top 43%) — families likely to look elsewhere, expect single-tenant / working-renter base with shorter leases.
- Zoned schools: Lakewood Elementary (math 38% / reading 30%, grade F, #351 of 952 statewide, top 37%, 505 students, 0% FRL); Lakewood Middle School (math 34% / reading 25%, grade F, #107 of 333 statewide, top 33%, 249 students, 0% FRL) — zoned schools average 0% FRL vs 55% district-wide (55 pts lower); this property's tenant base skews higher-income than the district average.
- Market conditions: 46 active listings in the ZIP; 19 units permitted in Henry County in 2024 (0 in 5+ unit buildings).
Forward outlook
- In year one you build about $6k of equity ($414 loan paydown + $6k appreciation (10.0% local appreciation)).
- Henry County population projected to shrink 10% by 2050 — rents likely to lag national; underwrite the cash flow, not the appreciation.
- At projected returns (10.0% appreciation + 3.0% rent growth), your $17k cash investment doubles in ~2 years — after that, you're playing with house money.
- By year 6, paydown + projected appreciation supports a ~$38k cash-out refi (75% LTV) — recoverable capital for the next deal without selling this one.
Negotiation context
- Only 11 days on market — expect competitive offers; lowballing is unlikely to land.
- Current owner paid $35k; list at $60k implies a 71% gain — meaningful room to come down on a strong offer.
Risks & watch-outs
- Climate carrying-cost: moderate wildfire risk; extreme-heat days projected 7→20/yr by 2055 (HVAC capex compounding) — expect insurance premiums to compound above CPI over the hold.
Questions for the listing agent
- Built in 1970 — when were the roof, HVAC, electrical panel, plumbing, and water heater last replaced?
- Is there a deadline driving the sale (1031 exchange, divorce, estate, relocation)? That informs how much negotiation room exists.
- What's the average days-on-market for RENTAL listings here right now (not sales)? A rising rental-DOM trend means longer vacancies and softer asking-rent achievability than the comps imply.
- What's the recent tenant-quality profile in this submarket — average credit score on applications, eviction rate, late-payment / NSF rate, and stable-employment percentage? A property-management company in the area should have these aggregated.
- How much new for-sale + rental construction is in the pipeline within 1–3 miles? Heavy new supply typically softens prices + rents 12–24 months out; constrained supply supports both.
Investment metrics
- 1% rule
- 1.94% ✓
- Cap rate
- 17.52%
- Cash-on-cash
- 40.08%
- DSCR
- 2.78
- GRM
- 4.3
CMA / ARV
No comps found within radius.
Projected returns pro-forma
10.0% appreciation · 3.0% rent growth · sell at horizon
- IRR
- 55.3%
- Equity multiple
- 5.07×
- Total profit
- $68,289
- Equity at exit
- $53,963
- IRR
- 48.8%
- Equity multiple
- 11.32×
- Total profit
- $173,006
- Equity at exit
- $116,373
Cash invested: $16,772 (down + closing). Projections, not guarantees.
Landlord ↔ Tenant lean methodology
- Overall (STATE)
- 87 Strongly Landlord-Friendly
- State Tennessee
- 87 Strongly Landlord-Friendly · R+13
- County
- — inherits STATE
- City
- — inherits STATE
ZIP-level market 38222
- Home prices YoY
- 8.0%
- Active inventory
- 46
- Price-to-rent
- 4.3×
Monthly cashflow live
- Estimated rent
- $1,163 medium interval (Pro) →
- Mortgage (P&I)
- −$314
- Tax from tax record
- −$19 /mo · $233/yr
- Insurance
- −$25
- HOA
- −$0
- Vacancy / Maint / Mgmt
- −$244
- Net cashflow
- $560
Break-even live
UW: 25.0% down · 7.5% · 30yr · 1.5% tax · 5.0% vac · 8.0% maint · 8.0% mgmt
Financing live
Cash to close
- Down payment
- $14,975
- Closing costs
- $1,797
- Reserves months
- —
- Total cash needed
- —
Loan-product check · same deal, 3 products live
Conventional
25% down · 7.5% · 30yr
- Down + closing
- —
- Monthly P&I
- —
- Monthly cashflow
- —
- DSCR
- —
- Eligible?
- —
Personal DTI + credit; lowest rate.
DSCR
20% down · 8.5% · 30yr
- Down + closing
- —
- Monthly P&I
- —
- Monthly cashflow
- —
- DSCR
- —
- Eligible?
- —
No personal income docs; deal must DSCR.
Hard money
10% down · 12.0% · 12mo
- Down + closing
- —
- Monthly P&I
- —
- Monthly cashflow
- —
- DSCR
- —
- Eligible?
- —
Short-term bridge; refi at stabilization.
Listing history 5 events
-
2026-05-31status $59,900 Pending 11 DOM
-
2026-05-31days on market $59,900 Active Under Contract 11 DOM
-
2026-05-21historical Active Under Contract
-
2026-05-20$59,900 Active
-
2009-08-04soldstatus $35,000
ⓘ Source: listings_history table (triggers on properties + properties_extension) + one-shot
backfill from property_details.listing_events for pre-trigger history.
Tax reassessment forecast TN · Resets to sale price
- Current annual tax
- $233 · $19/mo
- Projected year-2 tax
- $425 · $35/mo
- Expected delta
- +$192/yr (+$16/mo · 82.5%)
ⓘ Screening estimate from a state-policy table — verify with the county assessor before closing.
Climate risk First Street
- Flood 1/10 Low FEMA zone X (unshaded) · 0% chance over 30 yrs
- Wildfire 5/10 Major
- Heat 5/10 Major 7 d/yr ≥108°F today · 20 d/yr by 30 yrs out
- Wind 4/10 Moderate 10% chance of damaging wind over 30 yrs
- Air quality 1/10 Low 0 unhealthy d/yr today · 0 by 30 yrs out
Nearby sold comps map
Loading sold comps map…
Walkable amenities ~0.75 mi
Loading nearby amenities…
Taxation est. · year 1
- Rental income
- $13,956
- − Mortgage interest
- −$3,355
- − Property taxes
- −$233
- − Insurance
- −$300
- − Repairs & maintenance
- −$1,116
- − Management
- −$1,116
- − Depreciation
- −$1,743
- Taxable income
- $6,092
- Est. tax owed @ 24.0%
- −$1,462
- After-tax cash flow
- $5,261/yr
For passive investors: Depreciation is non-cash, so a rental often shows a tax loss while cash-flowing — sheltering income. Rental losses are passive: they offset passive income freely, and up to $25,000/yr can offset ordinary (W-2) income if you actively participate and your MAGI is under $100k (phasing out to $0 by $150k); unused losses carry forward. On sale, claimed depreciation is recaptured at up to 25%, and gains may owe capital-gains tax (a 1031 exchange can defer both). Figures are a year-1 estimate at your 24.0% rate — not tax advice; consult a CPA.
Schools (NCES district)
- District
- Henry County
- NCES district ID
- 4701830
- Math proficiency
- 30% ▼ -3.00%
- Reading proficiency
- 30% ▼ -6.00%
- Median HH income
- $41,770
- Composite
- 25.42/100
- National rank
- #7457
- State rank
- #60 of 139 in TN
Livability — Buchanan
No livability data for this city. (Only ~50 U.S. cities are tracked.)
Census & demographics
- Census place
- Buchanan, TN
- Population (ZIP)
- 1,899
Population outlook (Henry County) Hauer SSP2
- Today (2025)
- 31,750 people
- By 2030
- 31,277 · -1.5%
- By 2040
- 30,064 · -5.3%
- By 2050
- 28,675 · -9.7%
- By 2075
- 25,767 · -18.8%
- By 2100
- 22,318 · -29.7%
Race, ethnicity, and origin ACS 2023
- Neighborhood character
- Predominantly White (88%)
- Race & ethnicity
- White 88% Native American 5% Two or more races 5% Hispanic / Latino 4% Black 2%
- Common ancestry
- Lithuanian 4% Iranian 1% Romanian 1%
- Foreign-born
- 1% · Canada, Jamaica
- Languages at home
- 99% English-only · Spanish 1%
Political lean MEDSL · Henry
- 2024 margin
- Solid R (+55.3) · D 21.8% · R 77.1% · Other 1.1%
- 2008→2024 swing
- -33.0pp toward R · 2008: -22.4pp · 2024: -55.3pp
- All cycles
- 2024: R+55.3 2020: R+51.1 2016: R+49.8 2012: R+30.2 2008: R+22.4
Not yet ingested
- Civics
- —
Market trends
- HPI YoY
- ▲ 23.63%
- Current HPI
- 319.6388
- Rent YoY
- —
- Metro
- —
- State GDP YoY
- ▲ 2.78%
- F500 in state
- 22
Industry mix (Fortune 500 HQ in TN)
| Industry | F500 HQs | Revenue |
|---|---|---|
| Healthcare | 3 | $91B |
|
||
| Retail | 3 | $72B |
|
||
| Transportation / Logistics | 1 | $88B |
|
||
| Paper / Packaging | 1 | $19B |
|
||
| Insurance | 1 | $13B |
|
||
| Energy | 1 | $12B |
|
||
Price history
+71.1% since first listed3 events — show timeline
- 2026-05-21 Contingent — TVAR
- 2026-05-20 Listed $59,900 TVAR
- 2009-08-04 Sold (Public Records) $35,000 Public Records
Property tax history
+1.2%/yrLatest (2025): $233 · +13.7% YoY. Source: county tax records.
Cash-flow waterfall
monthlySold comps — $/sqft
last 12 mo · ≤1 miLoading sold comps…