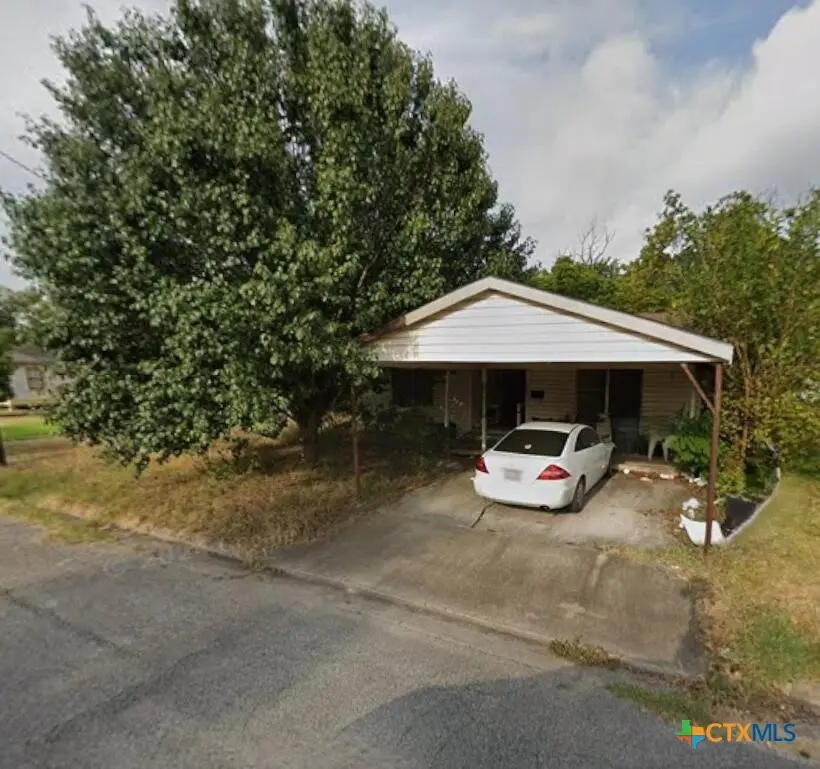
1807 N Wheeler St · Victoria, TX
Flood risk 3/10 · Minor
- FEMA flood zone
- X
- Chance of flooding over 30 yrs
- 0.2%
- Est. flood insurance / yr
- $507 – $1,088
Fire risk 5/10 · Moderate
- Est. fire insurance / yr
- $1,222 – $2,270
Heat risk 9/10 · Severe
- Hot days now (above 111°F)
- 7 days/yr
- Hot days in 30 yrs
- 21 days/yr
Wind risk 8/10 · Major
- Chance of severe wind over 30 yrs
- 99.0%
Air-quality risk 1/10 · Minimal
- Unhealthy air days now
- 0 days/yr
- Unhealthy air days in 30 yrs
- 0 days/yr
Risk factors via First Street. Map © Google.
Why this score? — see what drove the B- grade
The composite is a weighted blend of 9 inputs, each scored 0–100. Each bar is that input's sub-score; the figure is the points it added to the 100-point composite (weight × sub-score).
- Cash flow +30.0/30.0
- 1% rule +10.0/10.0
- DSCR +10.0/10.0
- ARV discount +7.5/15.0
- Livability +3.6/5.0
- Schools +2.5/10.0
- Condition / age +2.5/5.0
- Rent growth +2.3/5.0
- Appreciation +0.0/10.0
$39,000
🖨 Deal sheet (PDF) 📄 Offer letter ✓ Due diligence
Listing remarks
Investment Opportunity – 1807 N Wheeler St Great opportunity to own property at 1807 N Wheeler St. This property has a generous lot with plenty of potential for renovation, redevelopment, or building something new. investors, builders, or buyers looking to create their vision in a convenient location. Highlights: • Spacious lot • Excellent potential for improvement or new construction • Utilities available on site • Strong opportunity for investment or future development
Key facts
- Generous lot
- 5,662 sq ft lot
- Parking
Tags
Property features AI
Exterior
- Parking: No garage; 1 covered carport space
- Utilities: Public sewer
- Home design: Single-story home; Resale property
- Construction: Block foundation; Composition shingle roof; Year built reported by owner
- Exterior features: City lot; Less than quarter acre; Paved road access; No water features listed
Interior
- Bathrooms: 1 full bathroom
- Interior features: No notable interior features listed
Neighborhood map
What this means for you Summary
Snapshot
- This is a 3-bed/1.0-bath single-family listed at $39k.
Deal economics
- At list price, monthly cash flow is $746 ($9k/yr) — positive.
- The deal already cash-flows at list — no discount required.
- Meets the 1% rule at list price ($1k rent vs $39k).
- Recommended offer: $38k (3.0% below list) — sets the bar for market timing.
- Cap rate 29.2% vs local median 3.7% in Victoria — top-decile yield for the area; either an underpriced asset or a hidden risk that comps aren't pricing in. Stress-test before assuming the spread holds.
Location & tenants
- Location reads 71/100 on livability (#309 in TX) — a middle-class / working-renter tenant base. Strengths: cost of living A+, housing A+, health & safety A+; Watch: crime D+, amenities F, commute F.
- Victoria ISD (urban): math 24% / reading 33% proficiency, ranked #645 of 826 in TX (top 78%) — low school quality limits family demand, transient renter base, plan for 1-2y turnover.
- Zoned schools: Patti Welder Middle (math 8% / reading 23%, grade F, #1,556 of 1,662 statewide, top 94%, 638 students, 79% FRL); Victoria West H S (math 18% / reading 39%, grade F, #1,157 of 1,632 statewide, top 72%, 1,766 students, 59% FRL).
- Market conditions: Rents soft (-0.8%/yr); 199 active listings in the ZIP; 5 comparable units currently listed for rent nearby; rentals lingering (median 46d on market — plan ~5-8 weeks vacancy on turnover, expect pricing pressure); 100% of comp listings sitting > 30 days — soft ceiling on asking rent; 43 units permitted in Victoria County in 2024 (0 in 5+ unit buildings).
Forward outlook
- Local home prices are declining (-3.0%/yr); year-one equity from $270 of loan paydown is wiped out by about $1k of value loss. Plan a longer hold.
- Victoria County population projected at +34% by 2050 — long-run rental-demand tailwind backs the buy-and-hold thesis.
- At projected returns (-3.0% appreciation + 0.0% rent growth), your $11k cash investment doubles in ~2 years — after that, you're playing with house money.
Negotiation context
- It's been on market 48 days — a 3% lower offer ($38k) is reasonable based on typical stale-listing flexibility.
- 3 sale attempts with the ask held roughly flat each time — persistent listings suggest the price (not the market) is what's stuck; bring a comps-based counter.
Risks & watch-outs
- Watch-outs: built in 1954 — expect roof / HVAC / electrical / plumbing capex.
- Climate carrying-cost: severe wind risk, 99% chance of damaging wind over 30y; moderate wildfire risk; extreme-heat days projected 7→21/yr by 2055 (HVAC capex compounding) — expect insurance premiums to compound above CPI over the hold.
Questions for the listing agent
- It's been on market 48 days. Have you received any prior offers? Is the seller open to a 3% concession, seller financing, or rate buy-down credit?
- Built in 1954 — when were the roof, HVAC, electrical panel, plumbing, and water heater last replaced?
- Is there a deadline driving the sale (1031 exchange, divorce, estate, relocation)? That informs how much negotiation room exists.
- Schools are D-rated, which usually means shorter tenancies and higher turnover. Who's the typical renter profile here, and what's been the actual vacancy rate?
- Crime grade is D in this area — have there been break-ins, vandalism, or insurance claims at this property in the last 3 years? What carrier currently insures it and at what premium?
- What's the average days-on-market for RENTAL listings here right now (not sales)? A rising rental-DOM trend means longer vacancies and softer asking-rent achievability than the comps imply.
- What's the recent tenant-quality profile in this submarket — average credit score on applications, eviction rate, late-payment / NSF rate, and stable-employment percentage? A property-management company in the area should have these aggregated.
- How much new for-sale + rental construction is in the pipeline within 1–3 miles? Heavy new supply typically softens prices + rents 12–24 months out; constrained supply supports both.
Investment metrics
- 1% rule
- 3.30% ✓
- Cap rate
- 29.25%
- Cash-on-cash
- 81.98%
- DSCR
- 4.65
- GRM
- 2.5
CMA / ARV
- ARV (on-the-fly)
- $245,660
- Comps found
- 4
Show comp detail 4 sales within ~0.75 mi
| Address | Dist | Beds/Ba | Sqft | Sold | Price | $/sf | Match |
|---|---|---|---|---|---|---|---|
| 2011 N Jecker | 0.39mi | 2/1.0 (-1) | 1,525 (-12%) | 1mo | $43,000 | $28 | 56 |
| 1705 N Vine St | 0.46mi | 4/2.0 (+1) | 1,534 (-11%) | 6mo | $260,000 | $169 | 46 |
| 702 E Airline Rd | 0.65mi | 3/1.0 | 1,485 (-14%) | 2mo | $211,000 | $142 | 45 |
| 1311 E Park Ave | 0.69mi | 3/2.0 | 1,518 (-12%) | 2mo | $170,000 | $112 | 42 |
Match score weights: distance 35% · size 25% · config 20% · recency 20%. Top-matched comps best support the ARV.
Projected returns pro-forma
-3.0% appreciation · 0.0% rent growth · sell at horizon
- IRR
- 78.8%
- Equity multiple
- 4.43×
- Total profit
- $37,445
- Equity at exit
- $5,815
- IRR
- 81.6%
- Equity multiple
- 8.26×
- Total profit
- $79,307
- Equity at exit
- $3,372
Cash invested: $10,920 (down + closing). Projections, not guarantees.
Landlord ↔ Tenant lean methodology
- Overall (STATE)
- 87 Strongly Landlord-Friendly
- State Texas
- 87 Strongly Landlord-Friendly · R+5
- County
- — inherits STATE
- City
- — inherits STATE
ZIP-level market 77901
- Rents YoY
- -0.8%
- Active inventory
- 199
- Price-to-rent
- 2.5×
Monthly cashflow live
- Estimated rent
- $1,285 high interval (Pro) →
- Mortgage (P&I)
- −$205
- Tax est. 1.5%
- −$49 /mo · $585/yr
- Insurance
- −$16
- HOA
- −$0
- Vacancy / Maint / Mgmt
- −$270
- Net cashflow
- $746
Break-even live
Sensitivity live
| Price | -10% $773 | -5% $759 | +0% $746 | +5% $733 | +10% $719 |
|---|---|---|---|---|---|
| Rent | -10% $644 | -5% $695 | +0% $746 | +5% $797 | +10% $848 |
| Rate | -1.0pp $766 | -0.5pp $756 | base $746 | +0.5pp $736 | +1.0pp $726 |
UW: 25.0% down · 7.5% · 30yr · 1.5% tax · 5.0% vac · 8.0% maint · 8.0% mgmt
Financing live
Cash to close
- Down payment
- $9,750
- Closing costs
- $1,170
- Reserves months
- —
- Total cash needed
- —
Loan-product check · same deal, 3 products live
Conventional
25% down · 7.5% · 30yr
- Down + closing
- —
- Monthly P&I
- —
- Monthly cashflow
- —
- DSCR
- —
- Eligible?
- —
Personal DTI + credit; lowest rate.
DSCR
20% down · 8.5% · 30yr
- Down + closing
- —
- Monthly P&I
- —
- Monthly cashflow
- —
- DSCR
- —
- Eligible?
- —
No personal income docs; deal must DSCR.
Hard money
10% down · 12.0% · 12mo
- Down + closing
- —
- Monthly P&I
- —
- Monthly cashflow
- —
- DSCR
- —
- Eligible?
- —
Short-term bridge; refi at stabilization.
Rent comps 5 comps
| Address | Beds | Baths | Sqft | Rent | $/sqft | DOM | Units | Dist |
|---|---|---|---|---|---|---|---|---|
| 305 E Sabine St Unit A Victoria, TX | 2.0 | 1.0 | 1224 | $1,150 | $0.94 | 46d | 1 | 0.02mi |
| 408 E North St Unit Dwnstrs Victoria, TX | 2.0 | 1.0 | 2092 | $1,200 | $0.57 | 46d | 1 | 0.60mi |
| 3001 Arroyo Dr Victoria, TX | 1.0–2.0 | 1.0–2.0 | 857 | $1,330 | $1.55 | 46d | 4 | 0.79mi |
| 1709 Navidad St Victoria, TX | 4.0 | 1.0 | 1457 | $1,595 | $1.09 | 46d | 1 | 0.92mi |
| 1810 E Colorado St Victoria, TX | 1.0–3.0 | 1.0–2.0 | 907 | $1,425 | $1.57 | 46d | 8 | 0.94mi |
Listing history 23 events
-
2026-06-21days on market $39,000 Active 48 DOM
-
2026-06-19days on market $39,000 Active 46 DOM
-
2026-06-18days on market $39,000 Active 45 DOM
-
2026-06-17days on market $39,000 Active 44 DOM
-
2026-06-16days on market $39,000 Active 43 DOM
-
2026-06-15days on market $39,000 Active 42 DOM
-
2026-06-14days on market $39,000 Active 40 DOM
-
2026-06-13days on market $39,000 Active 39 DOM
-
2026-06-10days on market $39,000 Active 37 DOM
-
2026-06-09days on market $39,000 Active 36 DOM
-
2026-06-08days on market $39,000 Active 35 DOM
-
2026-06-07days on market $39,000 Active 34 DOM
-
2026-06-03days on market $39,000 Active 30 DOM
-
2026-06-02days on market $39,000 Active 29 DOM
-
2026-06-01days on market $39,000 Active 28 DOM
-
2026-05-31days on market $39,000 Active 27 DOM
-
2026-05-30days on market $39,000 Active 26 DOM
-
2026-05-24status Active
-
2026-04-07status Pending
-
2026-03-18$39,000 Active
-
2026-02-28historical
-
2026-02-05price $59,950
-
2025-12-24$65,000 Active
ⓘ Source: listings_history table (triggers on properties + properties_extension) + one-shot
backfill from property_details.listing_events for pre-trigger history.
Climate risk First Street
- Flood 3/10 Moderate FEMA zone X · 20% chance over 30 yrs
- Wildfire 5/10 Major
- Heat 9/10 Extreme 7 d/yr ≥111°F today · 21 d/yr by 30 yrs out
- Wind 8/10 Severe 99% chance of damaging wind over 30 yrs
- Air quality 1/10 Low 0 unhealthy d/yr today · 0 by 30 yrs out
Nearby sold comps map
Loading sold comps map…
Walkable amenities ~0.75 mi
Loading nearby amenities…
Taxation est. · year 1
- Rental income
- $15,426
- − Mortgage interest
- −$2,185
- − Property taxes
- −$585
- − Insurance
- −$195
- − Repairs & maintenance
- −$1,234
- − Management
- −$1,234
- − Depreciation
- −$1,135
- Taxable income
- $8,858
- Est. tax owed @ 24.0%
- −$2,126
- After-tax cash flow
- $6,826/yr
For passive investors: Depreciation is non-cash, so a rental often shows a tax loss while cash-flowing — sheltering income. Rental losses are passive: they offset passive income freely, and up to $25,000/yr can offset ordinary (W-2) income if you actively participate and your MAGI is under $100k (phasing out to $0 by $150k); unused losses carry forward. On sale, claimed depreciation is recaptured at up to 25%, and gains may owe capital-gains tax (a 1031 exchange can defer both). Figures are a year-1 estimate at your 24.0% rate — not tax advice; consult a CPA.
Schools (NCES district)
- District
- Victoria ISD
- NCES district ID
- 4844150
- Math proficiency
- 24% ▼ -12.00%
- Reading proficiency
- 33% ▼ -2.00%
- Median HH income
- $50,534
- Composite
- 24.98/100
- National rank
- #7562
- State rank
- #645 of 826 in TX
Livability — Victoria
- Score
- 71/100
- State rank
- #309
- US rank
- #6960
Category grades
Schools grade is shown separately in the Schools card above.
Census & demographics
- Census place
- Victoria, TX
- County
- Victoria County · 69,915 people
- City population
- 69,915
- Metro
- Victoria, TX
- Population (ZIP)
- 39,854
- Household income
- $57,923
- Rent vs Own
- Severe rent burden
- 1802.0
Population outlook (Victoria County) Hauer SSP2
- Today (2025)
- 106,119 people
- By 2030
- 113,161 · +6.6%
- By 2040
- 127,402 · +20.1%
- By 2050
- 141,953 · +33.8%
- By 2075
- 179,410 · +69.1%
- By 2100
- 200,127 · +88.6%
Race, ethnicity, and origin ACS 2023
- Neighborhood character
- Predominantly Hispanic (66%)
- Race & ethnicity
- Hispanic / Latino 66% Two or more races 30% White 24% Black 7% Asian 2%
- Hispanic origin (detail)
- Mexican 60%
- Common ancestry
- Serbian 2% Lithuanian 1% Italian 1%
- Foreign-born
- 10% · Canada, China
- Languages at home
- 64% English-only · Spanish 35% Chinese 1%
Political lean MEDSL · Victoria
- 2024 margin
- Solid R (+42.6) · D 28.4% · R 71.0%
- 2008→2024 swing
- -9.0pp toward R · 2008: -33.6pp · 2024: -42.6pp
- All cycles
- 2024: R+42.6 2020: R+38.0 2016: R+40.0 2012: R+37.8 2008: R+33.6
Not yet ingested
- Civics
- —
Market trends
- HPI YoY
- ▼ -127.62%
- Current HPI
- 138.3569
- Rent YoY
- ▼ -0.79%
- Metro
- Victoria, TX
- State GDP YoY
- ▲ 3.95%
- F500 in state
- 110
Industry mix (Fortune 500 HQ in TX)
| Industry | F500 HQs | Revenue |
|---|---|---|
| Energy | 16 | $1,198B |
|
||
| Technology | 5 | $198B |
|
||
| Engineering / Construction | 4 | $72B |
|
||
| Energy Services | 3 | $60B |
|
||
| Utilities | 3 | $41B |
|
||
| Healthcare | 2 | $330B |
|
||
Price history
-40.0% since first listed6 events — show timeline
- 2026-05-24 Relisted — CTXMLS
- 2026-04-07 Pending — CTXMLS
- 2026-03-18 Listed $39,000 CTXMLS
- 2026-02-28 Listing Removed — CTXMLS
- 2026-02-05 Price Changed $59,950 CTXMLS
- 2025-12-24 Listed $65,000 CTXMLS
Property tax history
-3.0%/yrLatest (2025): $2,386 · -19.5% YoY. Source: county tax records.
Cash-flow waterfall
monthlySold comps — $/sqft
last 12 mo · ≤1 miLoading sold comps…