 🏗️ New Construction
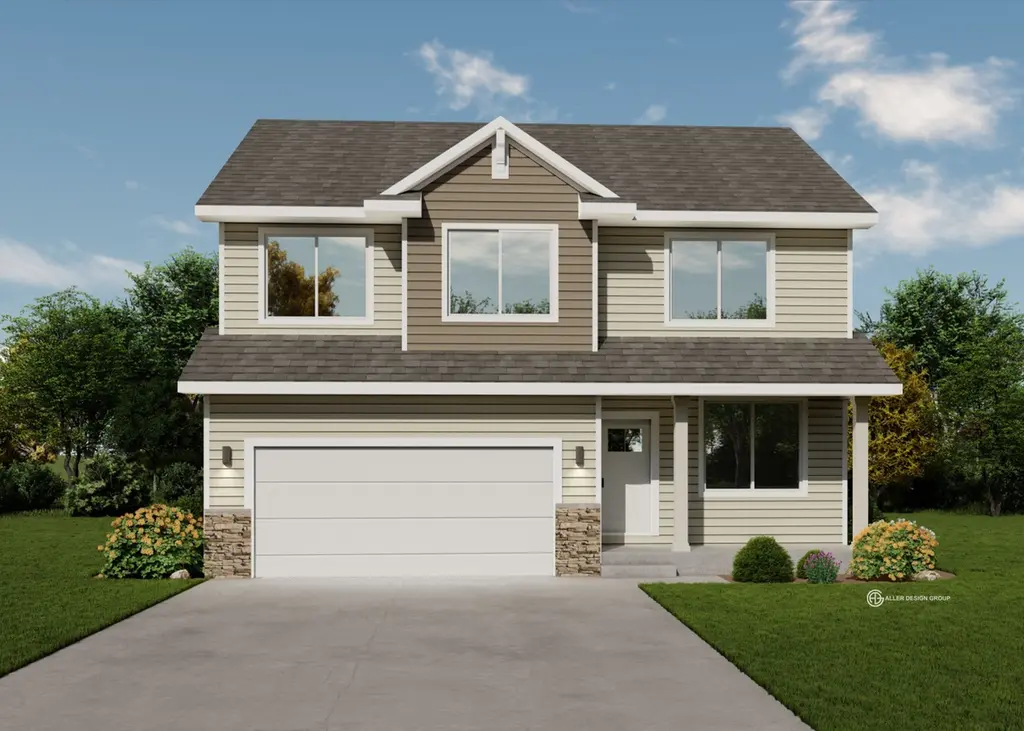
Hansbury Plan · Waukee, IA
Flood risk No data
- FEMA flood zone
- —
- Chance of flooding over 30 yrs
- —
- Est. flood insurance / yr
- —
Fire risk No data
- Est. fire insurance / yr
- —
Heat risk No data
- Hot days now (above threshold)
- —
- Hot days in 30 yrs
- —
Wind risk No data
- Chance of severe wind over 30 yrs
- —
Air-quality risk No data
- Unhealthy air days now
- —
- Unhealthy air days in 30 yrs
- —
Risk factors via First Street. Map © Google.
Why this score? — see what drove the F grade
The composite is a weighted blend of 9 inputs, each scored 0–100. Each bar is that input's sub-score; the figure is the points it added to the 100-point composite (weight × sub-score).
- ARV discount +7.5/15.0
- Schools +7.1/10.0
- Livability +4.2/5.0
- Cash flow +4.1/30.0
- Rent growth +3.0/5.0
- Condition / age +2.5/5.0
- 1% rule +0.3/10.0
- DSCR +0.0/10.0
- Appreciation +0.0/10.0
$320,000
🖨 Deal sheet (PDF) 📄 Offer letter ✓ Due diligence
Listing remarks MLS
Destiny Homes presents their Hansbury floor plan. This plan features approximately 2100 square feet of gorgeous, finished living space, 4 bedrooms and 2.5 baths. Spacious kitchen with painted cabinets, large center island, pantry, quartz countertops, and hardwood floors. Upon entering the home your greeted with a bonus living room/study/playroom. The large great room with fireplace tucked just off the open concept kitchen/dining area. Other main floor features include 9' ceilings, lockers/mudroom and half bath. Upstairs you will find 4 spacious bedrooms, full bathroom, and laundry room. The large primary suite features a walk-in closet, double vanity and full shower. Lower level is stubbed for a bath and plenty of room for future finish of your choice. All Launch series homes are Energy Star rated & have a 2 year builder warranty. Striking the perfect balance between quality and efficiency, your path to homeownership starts right now! Ask about $2,000 in closing costs provided by preferred lender.
Key facts
- Quartz countertops
- Energy star rated
- Hardwood floors
Tags
Neighborhood map
What this means for you Summary
Snapshot
- This is a 4-bed/2.5-bath single-family listed at $320k.
Deal economics
- At list price, monthly cash flow is $-1k ($-14k/yr) — negative.
- To cash-flow at today's rent, offer at most $259k (19.1% below list).
- To meet the 1% rule (rent ≥ 1% of price), the offer needs to be $229k (28.4% below list).
- Recommended offer: $229k (28.4% below list) — sets the bar for 1% rule.
Location & tenants
- Location reads 84/100 on livability (#22 in IA, #682 nationally) — a professional / high-income tenant draw. Strengths: crime A+, employment A+, housing A+; Watch: amenities F, commute F.
- Waukee Community School District (suburban): math 80% / reading 79% proficiency, ranked #14 of 289 in IA (top 5%) — strong family-tenant draw, lease renewals of 3-5y typical; only 11% free/reduced lunch — higher-income household profile.
- Zoned schools: Shuler Elementary School (math 91% / reading 86%, grade A+, #12 of 616 statewide, top 2%, 658 students, 7% FRL); Waukee Middle School (math 83% / reading 81%, grade A+, #22 of 246 statewide, top 12%, 1,069 students, 12% FRL); Waukee High School (math 74% / reading 82%, grade A-, #53 of 336 statewide, top 16%, 1,268 students, 24% FRL) — zoned schools at 14% FRL track the district average.
- Market conditions: Rents rising (+1.8%/yr); 891 active listings in the ZIP; 16 comparable units currently listed for rent nearby; rentals at typical pace (median 25d on market — plan ~3-4 weeks tenant-placement turnaround); solid renter incomes; 1,503 units permitted in Dallas County in 2024 (630 in 5+ unit buildings).
Forward outlook
- Local home prices are declining (-3.0%/yr); year-one equity from $3k of loan paydown is wiped out by about $13k of value loss. Plan a longer hold.
- Dallas County population projected at +74% by 2050 — long-run rental-demand tailwind backs the buy-and-hold thesis.
Negotiation context
- It's been on market 815 days — a 12% lower offer ($282k) is reasonable based on typical stale-listing flexibility.
Questions for the listing agent
- What do current leases actually rent for vs. the listed asking? Can we see a recent rent roll and the last 12 months of T-12 income?
- It's been on market 815 days. Have you received any prior offers? Is the seller open to a 28% concession, seller financing, or rate buy-down credit?
- What does the HOA fee cover, when was the last increase, and are there any pending special assessments or reserve-fund shortfalls?
- Why hasn't it sold? Are there any deal-killer items the seller is aware of (foundation, flood, title, zoning, code violations)?
- Is there a deadline driving the sale (1031 exchange, divorce, estate, relocation)? That informs how much negotiation room exists.
- Schools are A-rated — typically a magnet for longer-tenancy family renters. What's the average tenant stay here, and is there a school-zone premium baked into asking?
- The area grade is low — what's the realistic commute time and amenity access for the typical tenant pool here? Any planned neighborhood developments (good or bad) we should know about?
- What's the average days-on-market for RENTAL listings here right now (not sales)? A rising rental-DOM trend means longer vacancies and softer asking-rent achievability than the comps imply.
- What's the recent tenant-quality profile in this submarket — average credit score on applications, eviction rate, late-payment / NSF rate, and stable-employment percentage? A property-management company in the area should have these aggregated.
- How much new for-sale + rental construction is in the pipeline within 1–3 miles? Heavy new supply typically softens prices + rents 12–24 months out; constrained supply supports both.
Investment metrics
- 1% rule
- 0.53% ✗
- Cap rate
- 3.01%
- Cash-on-cash
- -11.72%
- DSCR
- 0.48
- GRM
- 15.6
CMA / ARV
- ARV (median comp)
- $428,609
- List price
- $320,000
- Delta
- -25.34%
- Verdict
- UNDERPRICED
- Comps
- 20 within 1.0 mi
Show comp detail 12 sales within ~0.75 mi
| Address | Dist | Beds/Ba | Sqft | Sold | Price | $/sf | Match |
|---|---|---|---|---|---|---|---|
| 555 NW Compass Ave | 0.06mi | 4/2.5 | 2,070 (-4%) | 4mo | $385,000 | $186 | 86 |
| 430 NW Ryder Dr | 0.12mi | 4/4.0 | 2,146 (-1%) | 2mo | $534,900 | $249 | 85 |
| 460 NW Independence Cir | 0.06mi | 4/2.5 | 2,072 (-4%) | 9mo | $404,900 | $195 | 83 |
| 305 NW Woodmoor Dr | 0.67mi | 4/2.5 | 2,208 (+2%) | 2mo | $509,900 | $231 | 64 |
| 585 NW Rosemont Dr | 0.41mi | 5/3.5 (+1) | 2,302 (+6%) | 1mo | $590,000 | $256 | 60 |
| 855 NW Frescott Cir | 0.57mi | 4/3.5 | 2,065 (-4%) | 6mo | $655,000 | $317 | 57 |
| 535 NW Rosemont Dr | 0.37mi | 4/2.5 | 1,889 (-13%) | 9mo | $445,000 | $236 | 54 |
| 465 NW Gracewood Dr | 0.43mi | 4/4.0 | 2,350 (+9%) | 6mo | $465,000 | $198 | 54 |
| 270 NW Montego Ct | 0.60mi | 5/4.0 (+1) | 2,042 (-6%) | 1mo | $729,900 | $357 | 51 |
| 265 NW Montego Ct | 0.65mi | 4/3.0 | 1,993 (-8%) | 8mo | $807,679 | $405 | 48 |
| 285 NW Woodmoor Dr | 0.68mi | 5/3.5 (+1) | 2,310 (+7%) | 7mo | $576,585 | $250 | 42 |
| 275 NW Montego Ct | 0.64mi | 5/3.5 (+1) | 1,841 (-15%) | 2mo | $649,900 | $353 | 35 |
Match score weights: distance 35% · size 25% · config 20% · recency 20%. Top-matched comps best support the ARV.
Projected returns pro-forma
-3.0% appreciation · 1.82% rent growth · sell at horizon
- IRR
- -39.1%
- Equity multiple
- -0.22×
- Total profit
- $-146,737
- Equity at exit
- $63,907
- IRR
- -69.2%
- Equity multiple
- -0.95×
- Total profit
- $-234,474
- Equity at exit
- $37,058
Cash invested: $120,011 (down + closing). Projections, not guarantees.
Landlord ↔ Tenant lean methodology
- Overall (STATE)
- 83 Strongly Landlord-Friendly
- State Iowa
- 83 Strongly Landlord-Friendly · R+6
- County
- — inherits STATE
- City
- — inherits STATE
ZIP-level market 50263
- Rents YoY
- 1.8%
- Active inventory
- 891
- Price-to-rent
- 11.6×
Monthly cashflow live
- Estimated rent
- $2,291 high interval (Pro) →
- Mortgage (P&I)
- −$2,248
- Tax est. 1.5%
- −$536 /mo · $6,429/yr
- Insurance
- −$179
- HOA
- −$20
- Vacancy / Maint / Mgmt
- −$481
- Net cashflow
- $-1,172
Break-even live
Sensitivity live
| Price | -10% $-876 | -5% $-1,024 | +0% $-1,172 | +5% $-1,320 | +10% $-1,468 |
|---|---|---|---|---|---|
| Rent | -10% $-1,353 | -5% $-1,262 | +0% $-1,172 | +5% $-1,081 | +10% $-991 |
| Rate | -1.0pp $-956 | -0.5pp $-1,063 | base $-1,172 | +0.5pp $-1,283 | +1.0pp $-1,396 |
UW: 25.0% down · 7.5% · 30yr · 1.5% tax · 5.0% vac · 8.0% maint · 8.0% mgmt
Financing live
Cash to close
- Down payment
- $107,152
- Closing costs
- $12,858
- Reserves months
- —
- Total cash needed
- —
Loan-product check · same deal, 3 products live
Conventional
25% down · 7.5% · 30yr
- Down + closing
- —
- Monthly P&I
- —
- Monthly cashflow
- —
- DSCR
- —
- Eligible?
- —
Personal DTI + credit; lowest rate.
DSCR
20% down · 8.5% · 30yr
- Down + closing
- —
- Monthly P&I
- —
- Monthly cashflow
- —
- DSCR
- —
- Eligible?
- —
No personal income docs; deal must DSCR.
Hard money
10% down · 12.0% · 12mo
- Down + closing
- —
- Monthly P&I
- —
- Monthly cashflow
- —
- DSCR
- —
- Eligible?
- —
Short-term bridge; refi at stabilization.
Rent comps 16 comps
| Address | Beds | Baths | Sqft | Rent | $/sqft | DOM | Units | Dist |
|---|---|---|---|---|---|---|---|---|
| 284 NW Caspian Ct Waukee, IA | 4.0 | 2.5 | 1605 | $2,195 | $1.37 | 16d | 1 | 0.18mi |
| 350 NW 6th St Waukee, IA | 1.0–3.0 | 1.0–3.5 | 1163 | $2,308 | $1.98 | 16d | 20 | 0.30mi |
| 305 NW Morgan Ct Waukee, IA | 5.0 | 3.5 | 2200 | $2,595 | $1.18 | 45d | 1 | 0.42mi |
| 122 NW Pike Cir Waukee, IA | 4.0 | 2.5 | 1809 | $2,495 | $1.38 | 45d | 1 | 0.44mi |
| 1036 NW Richmond Rd Waukee, IA | 3.0 | 2.5 | 1450 | $1,750 | $1.21 | 25d | 1 | 0.65mi |
| 330 NE Cardinal Ln Waukee, IA | 4.0 | 3.0 | 1492 | $2,500 | $1.68 | 45d | 1 | 0.70mi |
| 289 NW Charlestown Ln Waukee, IA | 4.0 | 2.5 | 1767 | $2,200 | $1.25 | 45d | 1 | 0.72mi |
| 655 NW Williamsburg Ln Waukee, IA | 4.0 | 2.5 | 1875 | $2,445 | $1.30 | 16d | 1 | 0.97mi |
| 1110 NW Sproul Dr Waukee, IA | 4.0 | 3.0 | 2028 | $2,800 | $1.38 | 25d | 1 | 0.98mi |
| 500 NE Horizon Dr Waukee, IA | 3.0 | 1.0–2.0 | 1027 | $1,578 | $1.54 | 16d | 24 | 1.10mi |
| 1283 NW Williamsburg Ln Unit 1 Waukee, IA | 4.0 | 3.0 | 1410 | $2,495 | $1.77 | 16d | 1 | 1.14mi |
| 200 Corene Ave Waukee, IA | 4.0 | 2.0 | 1410 | $1,995 | $1.41 | 21d | 1 | 1.21mi |
| 854 NE Phlox Ave Waukee, IA | 3.0 | 3.0 | 1596 | $1,750 | $1.10 | 16d | 1 | 1.34mi |
| 856 NE Larkspur Ave Unit 1 Waukee, IA | 3.0 | 2.5 | 1630 | $1,800 | $1.10 | 45d | 1 | 1.34mi |
| 869 NE Traverse Dr Waukee, IA | 3.0 | 3.0 | 1868 | $2,095 | $1.12 | 16d | 1 | 1.35mi |
| 878 NE Traverse Dr Waukee, IA | 3.0 | 3.0 | 1868 | $2,050 | $1.10 | 45d | 1 | 1.35mi |
HOA detail
- Monthly dues
- $20 · $240/yr
Listing history 18 events
-
2026-06-21days on market $320,000 Active 815 DOM
-
2026-06-18days on market $320,000 Active 812 DOM
-
2026-06-17days on market $320,000 Active 811 DOM
-
2026-06-16days on market $320,000 Active 810 DOM
-
2026-06-15days on market $320,000 Active 809 DOM
-
2026-06-14days on market $320,000 Active 807 DOM
-
2026-06-13days on market $320,000 Active 806 DOM
-
2026-06-10days on market $320,000 Active 804 DOM
-
2026-06-09days on market $320,000 Active 803 DOM
-
2026-06-08days on market $320,000 Active 802 DOM
-
2026-06-07days on market $320,000 Active 801 DOM
-
2026-06-05days on market $320,000 Active 798 DOM
-
2026-06-03days on market $320,000 Active 797 DOM
-
2026-06-02days on market $320,000 Active 796 DOM
-
2026-06-01days on market $320,000 Active 795 DOM
-
2026-05-31days on market $320,000 Active 794 DOM
-
2026-05-31days on market $320,000 Active 793 DOM
-
2024-03-28$320,000 Active 1018-char remark
Show marketing remark (1018 chars)
Destiny Homes presents their Hansbury floor plan. This plan features approximately 2100 square feet of gorgeous, finished living space, 4 bedrooms and 2.5 baths. Spacious kitchen with painted cabinets, large center island, pantry, quartz countertops, and hardwood floors. Upon entering the home your greeted with a bonus living room/study/playroom. The large great room with fireplace tucked just off the open concept kitchen/dining area. Other main floor features include 9' ceilings, lockers/mudroom and half bath. Upstairs you will find 4 spacious bedrooms, full bathroom, and laundry room. The large primary suite features a walk-in closet, double vanity and full shower. Lower level is stubbed for a bath and plenty of room for future finish of your choice. All Launch series homes are Energy Star rated & have a 2 year builder warranty. Striking the perfect balance between quality and efficiency, your path to homeownership starts right now! Ask about $2,000 in closing costs provided by preferred lender.
ⓘ Source: listings_history table (triggers on properties + properties_extension) + one-shot
backfill from property_details.listing_events for pre-trigger history.
Nearby sold comps map
Loading sold comps map…
Walkable amenities ~0.75 mi
Loading nearby amenities…
Taxation est. · year 1
- Rental income
- $27,495
- − Mortgage interest
- −$24,009
- − Property taxes
- −$6,429
- − Insurance
- −$2,143
- − Repairs & maintenance
- −$2,200
- − Management
- −$2,200
- − HOA
- −$240
- − Depreciation
- −$12,469
- Taxable loss
- −$22,194
- Est. tax savings @ 24.0%
- +$5,327
- After-tax cash flow
- $-8,737/yr
For passive investors: Depreciation is non-cash, so a rental often shows a tax loss while cash-flowing — sheltering income. Rental losses are passive: they offset passive income freely, and up to $25,000/yr can offset ordinary (W-2) income if you actively participate and your MAGI is under $100k (phasing out to $0 by $150k); unused losses carry forward. On sale, claimed depreciation is recaptured at up to 25%, and gains may owe capital-gains tax (a 1031 exchange can defer both). Figures are a year-1 estimate at your 24.0% rate — not tax advice; consult a CPA.
Schools (NCES district)
- District
- Waukee Community School District
- NCES district ID
- 1930510
- Math proficiency
- 80% ▼ -6.00%
- Reading proficiency
- 79% ▼ -5.00%
- Median HH income
- $88,580
- Composite
- 70.94/100
- National rank
- #245
- State rank
- #14 of 289 in IA
Livability — Waukee
- Score
- 84/100
- State rank
- #22
- US rank
- #682
Category grades
Schools grade is shown separately in the Schools card above.
Census & demographics
- Census place
- Waukee, IA
- County
- Dallas County · 77,082 people
- City population
- 29,611
- Metro
- Des Moines-West Des Moines, IA
- Population (ZIP)
- 29,611
- Household income
- $102,762
- Rent vs Own
- Severe rent burden
- 468.0
Population outlook (Dallas County) Hauer SSP2
- Today (2025)
- 111,904 people
- By 2030
- 127,807 · +14.2%
- By 2040
- 160,576 · +43.5%
- By 2050
- 194,154 · +73.5%
- By 2075
- 271,895 · +143.0%
- By 2100
- 326,525 · +191.8%
Race, ethnicity, and origin ACS 2023
- Neighborhood character
- Predominantly White (77%)
- Race & ethnicity
- White 77% Two or more races 7% Asian 6% Hispanic / Latino 6% Black 4%
- Hispanic origin (detail)
- Mexican 3%
- Common ancestry
- Portuguese 3% Lithuanian 3% Iranian 3%
- Foreign-born
- 13% · Canada, India
- Languages at home
- 85% English-only · Other Asian/Pacific 3% Spanish 3% Arabic 2%
Political lean MEDSL · Dallas
- 2024 margin
- Toss-up / Even · D 46.9% · R 51.7% · Other 1.4%
- 2008→2024 swing
- +0.8pp no change · 2008: -5.5pp · 2024: -4.8pp
- All cycles
- 2024: R+4.8 2020: R+2.0 2016: R+9.6 2012: R+11.8 2008: R+5.5
Not yet ingested
- Civics
- —
Market trends
- HPI YoY
- ▼ -97.95%
- Current HPI
- 169.2421
- Rent YoY
- ▲ 1.82%
- Metro
- Des Moines-West Des Moines, IA
- State GDP YoY
- ▲ 2.48%
- F500 in state
- 4
Industry mix (Fortune 500 HQ in IA)
| Industry | F500 HQs | Revenue |
|---|---|---|
| Financial Services | 1 | $16B |
|
||
| Retail / Convenience | 1 | $15B |
|
||
Price history
1 event — show timeline
- 2024-03-28 Listed $320,000 Zillow
Cash-flow waterfall
monthlySold comps — $/sqft
last 12 mo · ≤1 miLoading sold comps…