 Multi-family
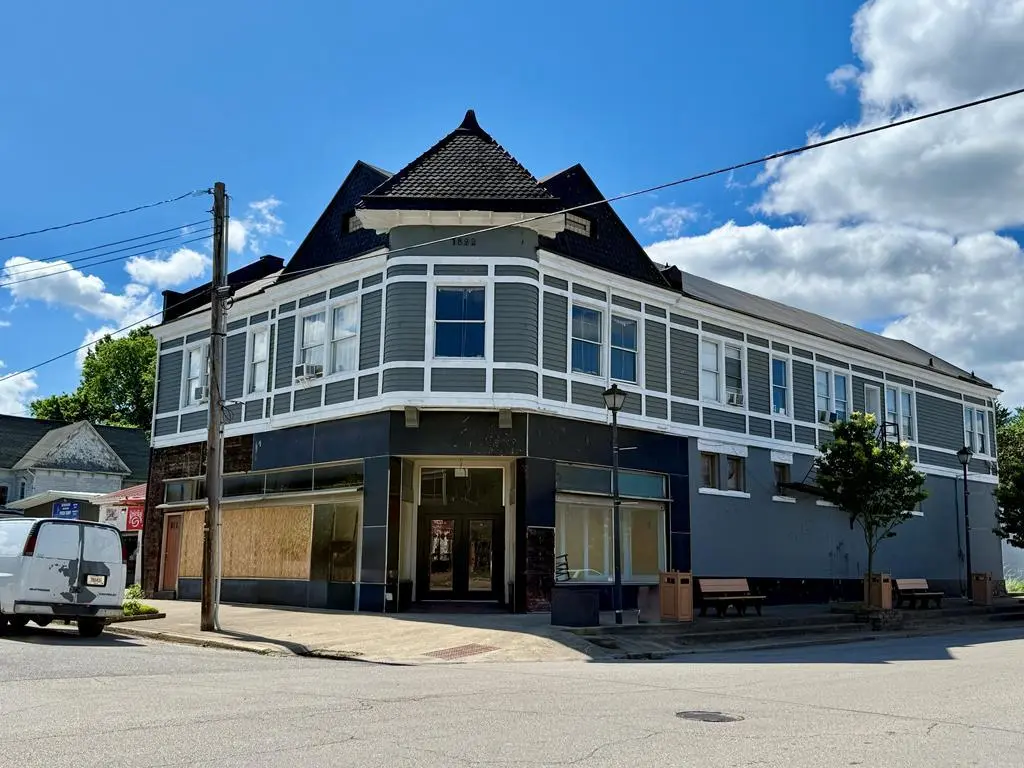
101 N Main Cross St · Louisa, KY
Flood risk No data
- FEMA flood zone
- —
- Chance of flooding over 30 yrs
- —
- Est. flood insurance / yr
- —
Fire risk No data
- Est. fire insurance / yr
- —
Heat risk No data
- Hot days now (above threshold)
- —
- Hot days in 30 yrs
- —
Wind risk No data
- Chance of severe wind over 30 yrs
- —
Air-quality risk No data
- Unhealthy air days now
- —
- Unhealthy air days in 30 yrs
- —
Risk factors via First Street. Map © Google.
Why this score? — see what drove the F grade
The composite is a weighted blend of 9 inputs, each scored 0–100. Each bar is that input's sub-score; the figure is the points it added to the 100-point composite (weight × sub-score).
- Appreciation +8.6/10.0
- Cash flow +5.1/30.0
- Livability +3.1/5.0
- ARV discount +3.0/15.0
- Schools +2.7/10.0
- Rent growth +2.5/5.0
- Condition / age +2.5/5.0
- 1% rule +0.0/10.0
- DSCR +0.0/10.0
$209,000
🖨 Deal sheet (PDF) 📄 Offer letter ✓ Due diligence
Multi-family units
County records classify this as Multi-Family (2-4 Unit). Listing-text estimate: 1 unit. estimate disagrees with records
Listing remarks
Prime downtown Louisa mixed-use opportunity with endless potential! The first level offers spacious storage/warehouse space ideal for inventory, retail expansion, workshop use, or future business possibilities. Upstairs features 3 residential apartments plus an additional large storage area, creating multiple income-producing opportunities under one roof. Located in the heart of downtown with excellent visibility and access, this property is perfect for investors, entrepreneurs, or anyone looking to grow a business while generating rental income. So much potential for redevelopment, expansion, or new ventures!
Key facts
- Large storage area
- Excellent visibility
- Spacious storage
Tags
Property features AI
Exterior
- Utilities: Public water; Public sewer
- Home design: Two-story multi-family residential income property; Mixed zoning
- Construction: Block, brick, metal siding, and wood siding construction
- Exterior features: Shingle roof
Interior
- Kitchen: Cooktop; Refrigerator
- Heating & cooling: Natural gas heating; Window air conditioning units
- Interior features: Refrigerator; Cooktop
Neighborhood map
What this means for you Summary
Snapshot
- This is a 6-bed/3.0-bath multifamily listed at $209k.
Deal economics
- At list price, monthly cash flow is $-485 ($-6k/yr) — negative.
- To cash-flow at today's rent, offer at most $123k (41.0% below list).
- To meet the 1% rule (rent ≥ 1% of price), the offer needs to be $99k (52.7% below list).
- Recommended offer: $99k (52.7% below list) — sets the bar for 1% rule.
Location & tenants
- Location reads 61/100 on livability (#381 in KY) — a middle-class / working-renter tenant base. Strengths: cost of living A+, crime A, housing B; Watch: amenities F, commute F, employment F.
- Lawrence County (town): math 23% / reading 42% proficiency, ranked #95 of 165 in KY (top 58%) — families likely to look elsewhere, expect single-tenant / working-renter base with shorter leases.
- Zoned schools: Louisa East Elementary School (math 24% / reading 44%, grade F, #329 of 676 statewide, top 49%, 491 students, 62% FRL); Louisa Middle School (math 22% / reading 43%, grade F, #116 of 217 statewide, top 55%, 457 students, 67% FRL); Lawrence County High School (math 32% / reading 47%, grade F, #40 of 254 statewide, top 19%, 738 students, 63% FRL).
- Market conditions: 64 active listings in the ZIP.
Forward outlook
- In year one you build about $16k of equity ($1k loan paydown + $15k appreciation (7.2% local appreciation)).
- Lawrence County population projected at -14% by 2050 — secular population decline; favor cash flow + early exit over multi-decade hold.
- By year 3, paydown + projected appreciation supports a ~$41k cash-out refi (75% LTV) — recoverable capital for the next deal without selling this one.
Negotiation context
- Only 6 days on market — expect competitive offers; lowballing is unlikely to land.
Risks & watch-outs
- Watch-outs: built in 1940 — expect roof / HVAC / electrical / plumbing capex.
Questions for the listing agent
- What do current leases actually rent for vs. the listed asking? Can we see a recent rent roll and the last 12 months of T-12 income?
- Built in 1940 — when were the roof, HVAC, electrical panel, plumbing, and water heater last replaced?
- Is there a deadline driving the sale (1031 exchange, divorce, estate, relocation)? That informs how much negotiation room exists.
- Schools are D-rated, which usually means shorter tenancies and higher turnover. Who's the typical renter profile here, and what's been the actual vacancy rate?
- The area grade is low — what's the realistic commute time and amenity access for the typical tenant pool here? Any planned neighborhood developments (good or bad) we should know about?
- What's the average days-on-market for RENTAL listings here right now (not sales)? A rising rental-DOM trend means longer vacancies and softer asking-rent achievability than the comps imply.
- What's the recent tenant-quality profile in this submarket — average credit score on applications, eviction rate, late-payment / NSF rate, and stable-employment percentage? A property-management company in the area should have these aggregated.
- How much new apartment / multifamily construction is in the pipeline within 1–3 miles? Heavy new supply (>2% of stock underway) typically softens rents 12–24 months out; light construction supports rent growth.
Investment metrics
- 1% rule
- 0.47% ✗
- Cap rate
- 3.51%
- Cash-on-cash
- -9.95%
- DSCR
- 0.56
- GRM
- 17.6
CMA / ARV
- ARV (median comp)
- $190,000
- List price
- $209,000
- Delta
- 10.00%
- Verdict
- FAIR
- Comps
- 1 within 2.0 mi
Show comp detail 1 sale within ~0.75 mi
| Address | Dist | Beds/Ba | Sqft | Sold | Price | $/sf | Match |
|---|---|---|---|---|---|---|---|
| 101 N Main Cross St | 0.00mi | 6/3.0 | 8,148 | 1mo | $190,000 | $23 | 87 |
Match score weights: distance 35% · size 25% · config 20% · recency 20%. Top-matched comps best support the ARV.
Projected returns pro-forma
7.17% appreciation · 3.0% rent growth · sell at horizon
- IRR
- 10.4%
- Equity multiple
- 1.75×
- Total profit
- $44,110
- Equity at exit
- $147,100
- IRR
- 11.4%
- Equity multiple
- 3.58×
- Total profit
- $150,951
- Equity at exit
- $281,503
Cash invested: $58,520 (down + closing). Projections, not guarantees.
Landlord ↔ Tenant lean methodology
- Overall (STATE)
- 83 Strongly Landlord-Friendly
- State Kentucky
- 83 Strongly Landlord-Friendly · R+16
- County
- — inherits STATE
- City
- — inherits STATE
ZIP-level market 41230
- Home prices YoY
- 4.2%
- Active inventory
- 64
- Price-to-rent
- 17.6×
Monthly cashflow live
- Estimated rent
- $988 medium interval (Pro) →
- Mortgage (P&I)
- −$1,096
- Tax from tax record
- −$82 /mo · $990/yr
- Insurance
- −$87
- HOA
- −$0
- Vacancy / Maint / Mgmt
- −$207
- Net cashflow
- $-485
Break-even live
Sensitivity live
| Price | -10% $-367 | -5% $-426 | +0% $-485 | +5% $-544 | +10% $-604 |
|---|---|---|---|---|---|
| Rent | -10% $-563 | -5% $-524 | +0% $-485 | +5% $-446 | +10% $-407 |
| Rate | -1.0pp $-380 | -0.5pp $-432 | base $-485 | +0.5pp $-539 | +1.0pp $-595 |
UW: 25.0% down · 7.5% · 30yr · 1.5% tax · 5.0% vac · 8.0% maint · 8.0% mgmt
Financing live
Cash to close
- Down payment
- $52,250
- Closing costs
- $6,270
- Reserves months
- —
- Total cash needed
- —
Loan-product check · same deal, 3 products live
Conventional
25% down · 7.5% · 30yr
- Down + closing
- —
- Monthly P&I
- —
- Monthly cashflow
- —
- DSCR
- —
- Eligible?
- —
Personal DTI + credit; lowest rate.
DSCR
20% down · 8.5% · 30yr
- Down + closing
- —
- Monthly P&I
- —
- Monthly cashflow
- —
- DSCR
- —
- Eligible?
- —
No personal income docs; deal must DSCR.
Hard money
10% down · 12.0% · 12mo
- Down + closing
- —
- Monthly P&I
- —
- Monthly cashflow
- —
- DSCR
- —
- Eligible?
- —
Short-term bridge; refi at stabilization.
Listing history 2 events
-
2026-05-13status Pending 617-char remark
-
2026-05-07$209,000 Active 617-char remark
ⓘ Source: listings_history table (triggers on properties + properties_extension) + one-shot
backfill from property_details.listing_events for pre-trigger history.
Tax reassessment forecast KY · Resets to sale price
- Current annual tax
- $990 · $82/mo
- Projected year-2 tax
- $1,797 · $150/mo
- Expected delta
- +$807/yr (+$67/mo · 81.6%)
ⓘ Screening estimate from a state-policy table — verify with the county assessor before closing.
Nearby sold comps map
Loading sold comps map…
Walkable amenities ~0.75 mi
Loading nearby amenities…
Taxation est. · year 1
- Rental income
- $11,853
- − Mortgage interest
- −$11,707
- − Property taxes
- −$990
- − Insurance
- −$1,045
- − Repairs & maintenance
- −$948
- − Management
- −$948
- − Depreciation
- −$6,080
- Taxable loss
- −$9,866
- Est. tax savings @ 24.0%
- +$2,368
- After-tax cash flow
- $-3,456/yr
For passive investors: Depreciation is non-cash, so a rental often shows a tax loss while cash-flowing — sheltering income. Rental losses are passive: they offset passive income freely, and up to $25,000/yr can offset ordinary (W-2) income if you actively participate and your MAGI is under $100k (phasing out to $0 by $150k); unused losses carry forward. On sale, claimed depreciation is recaptured at up to 25%, and gains may owe capital-gains tax (a 1031 exchange can defer both). Figures are a year-1 estimate at your 24.0% rate — not tax advice; consult a CPA.
Schools (NCES district)
- District
- Lawrence County
- NCES district ID
- 2103240
- Math proficiency
- 23% ▼ -17.00%
- Reading proficiency
- 42% ▼ -18.00%
- Median HH income
- $32,668
- Composite
- 26.55/100
- National rank
- #7189
- State rank
- #95 of 165 in KY
Livability — Louisa
- Score
- 61/100
- State rank
- #381
- US rank
- #18153
Category grades
Schools grade is shown separately in the Schools card above.
Census & demographics
- Census place
- Louisa, KY
- Population (ZIP)
- 12,399
Population outlook (Lawrence County) Hauer SSP2
- Today (2025)
- 15,462 people
- By 2030
- 15,038 · -2.7%
- By 2040
- 14,142 · -8.5%
- By 2050
- 13,292 · -14.0%
- By 2075
- 11,353 · -26.6%
- By 2100
- 9,417 · -39.1%
Race, ethnicity, and origin ACS 2023
- Neighborhood character
- Predominantly White (96%)
- Race & ethnicity
- White 96% Asian 2% Two or more races 1%
- Common ancestry
- Slovak 2% Serbian 1% Italian 1%
- Foreign-born
- 2%
- Languages at home
- 98% English-only · Chinese 2%
Political lean MEDSL · Lawrence
- 2024 margin
- Solid R (+67.2) · D 15.9% · R 83.1%
- 2008→2024 swing
- -41.3pp toward R · 2008: -26.0pp · 2024: -67.2pp
- All cycles
- 2024: R+67.2 2020: R+63.2 2016: R+62.5 2012: R+44.3 2008: R+26.0
Not yet ingested
- Civics
- —
Market trends
- HPI YoY
- ▲ 7.17%
- Current HPI
- 177.9918
- Rent YoY
- —
- Metro
- —
- State GDP YoY
- ▲ 1.81%
- F500 in state
- 4
Industry mix (Fortune 500 HQ in KY)
| Industry | F500 HQs | Revenue |
|---|---|---|
| Healthcare | 1 | $118B |
|
||
| Food / Beverage | 1 | $7B |
|
||
Price history
-9.1% since first listed3 events — show timeline
- 2026-05-28 Sold (MLS) $190,000 EKAR
- 2026-05-13 Pending — EKAR
- 2026-05-07 Listed $209,000 EKAR
Property tax history
+1.3%/yrLatest (2017): $990 · +8.7% YoY. Source: county tax records.
Cash-flow waterfall
monthlySold comps — $/sqft
last 12 mo · ≤1 miLoading sold comps…