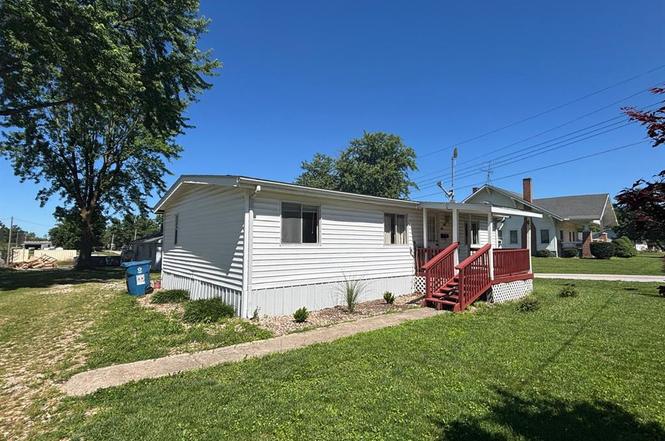
206 Washington St · Shelbyville, MO
Flood risk 1/10 · Minimal
- FEMA flood zone
- X (unshaded)
- Chance of flooding over 30 yrs
- 0.0%
- Est. flood insurance / yr
- $507 – $1,088
Fire risk 1/10 · Minimal
- Est. fire insurance / yr
- $1,054 – $1,958
Heat risk 4/10 · Minor
- Hot days now (above 106°F)
- 7 days/yr
- Hot days in 30 yrs
- 17 days/yr
Wind risk 2/10 · Minimal
- Chance of severe wind over 30 yrs
- —
Air-quality risk 2/10 · Minimal
- Unhealthy air days now
- 1 days/yr
- Unhealthy air days in 30 yrs
- 1 days/yr
Risk factors via First Street. Map © Google.
Why this score? — see what drove the B+ grade
The composite is a weighted blend of 9 inputs, each scored 0–100. Each bar is that input's sub-score; the figure is the points it added to the 100-point composite (weight × sub-score).
- Cash flow +30.0/30.0
- 1% rule +10.0/10.0
- DSCR +10.0/10.0
- Appreciation +8.9/10.0
- ARV discount +7.5/15.0
- Schools +5.4/10.0
- Livability +3.0/5.0
- Rent growth +2.5/5.0
- Condition / age +2.5/5.0
$69,000
🖨 Deal sheet 📄 Offer letter ✓ Due diligence
Listing remarks
206 N. Washington Street | Shelbyville, MO Welcome home to small-town living in Raider Country! Located in the desirable North Shelby School District, t 3-bedroom, 1-bath manufactured home offers 960 square feet of comfortable, low-maintenance living space. Inside, you’ll find new vinyl plank flooring in the kitchen, dining area, and hallway. The home also includes a gas stove, refrigerator, washer, and dryer—making it ready for its next owner. Relax on the covered front porch, enjoy the back patio, and appreciate the convenient accessible entry. This great corner lot provides wonderful outdoor space along with off-street parking. Nestled in the quiet rural community of Shelbyv
Key facts
- Built 1980
- Listed 2 days
Property features AI
Exterior
- Parking: Off-street parking
- Utilities: Public water; Public sewer; Electricity connected (single phase); Propane available
- Home design: Manufactured home; One level
- Construction: Vinyl siding; Asphalt exterior elements; Asphalt roof
- Exterior features: City lot
Interior
- Kitchen: Kitchen (approx. 15 x 11) with range, refrigerator, and disposal
- Bedrooms: Two bedrooms (both on the main level)
- Bathrooms: One full bathroom (main level)
- Heating & cooling: Forced air heating (natural gas); Ceiling fan(s); Wall/window cooling unit(s)
- Interior features: Disposal; Range; Refrigerator; Ceiling fan(s); Wall/window cooling unit(s)
Neighborhood map
What this means for you Summary
Snapshot
- This is a 3-bed/1.0-bath manufactured listed at $69k.
Deal economics
- At list price, monthly cash flow is $512 ($6k/yr) — positive.
- The deal already cash-flows at list — no discount required.
- Meets the 1% rule at list price ($1k rent vs $69k).
Location & tenants
- Location reads 60/100 on livability (#500 in MO) — a middle-class / working-renter tenant base. Strengths: cost of living A+, housing A-; Watch: employment D+, crime F, amenities F.
- North Shelby (rural): math 65% / reading 60% proficiency, ranked #31 of 535 in MO (top 6%) — acceptable for families but not a draw, mixed tenant base, ~2y average lease.
- Zoned schools: North Shelby Elem. (math 57% / reading 62%, grade B-, #124 of 1,115 statewide, top 13%, 178 students, 29% FRL); North Shelby High (math 72% / reading 77%, grade B+, #5 of 521 statewide, top 1%, 141 students, 34% FRL).
- Market conditions: 2 active listings in the ZIP; 4 units permitted in Shelby County in 2024 (0 in 5+ unit buildings).
Forward outlook
- In year one you build about $6k of equity ($477 loan paydown + $5k appreciation (7.7% local appreciation)).
- Shelby County population projected at -26% by 2050 — secular population decline; favor cash flow + early exit over multi-decade hold.
- At projected returns (7.7% appreciation + 3.0% rent growth), your $19k cash investment doubles in ~2 years — after that, you're playing with house money.
- By year 6, paydown + projected appreciation supports a ~$33k cash-out refi (75% LTV) — recoverable capital for the next deal without selling this one.
Negotiation context
- Only 2 days on market — expect competitive offers; lowballing is unlikely to land.
Questions for the listing agent
- Is there a deadline driving the sale (1031 exchange, divorce, estate, relocation)? That informs how much negotiation room exists.
- Schools are B-rated — typically a magnet for longer-tenancy family renters. What's the average tenant stay here, and is there a school-zone premium baked into asking?
- Crime grade is F in this area — have there been break-ins, vandalism, or insurance claims at this property in the last 3 years? What carrier currently insures it and at what premium?
- What's the average days-on-market for RENTAL listings here right now (not sales)? A rising rental-DOM trend means longer vacancies and softer asking-rent achievability than the comps imply.
- What's the recent tenant-quality profile in this submarket — average credit score on applications, eviction rate, late-payment / NSF rate, and stable-employment percentage? A property-management company in the area should have these aggregated.
- How much new for-sale + rental construction is in the pipeline within 1–3 miles? Heavy new supply typically softens prices + rents 12–24 months out; constrained supply supports both.
Investment metrics
- 1% rule
- 1.68% ✓
- Cap rate
- 15.19%
- Cash-on-cash
- 31.79%
- DSCR
- 2.41
- GRM
- 4.9
CMA / ARV
No comps found within radius.
Projected returns pro-forma
7.73% appreciation · 3.0% rent growth · sell at horizon
- IRR
- 45.1%
- Equity multiple
- 4.10×
- Total profit
- $59,800
- Equity at exit
- $51,153
- IRR
- 40.6%
- Equity multiple
- 8.72×
- Total profit
- $149,212
- Equity at exit
- $100,353
Cash invested: $19,320 (down + closing). Projections, not guarantees.
Landlord ↔ Tenant lean methodology
- Overall (STATE)
- 81 Strongly Landlord-Friendly
- State Missouri
- 81 Strongly Landlord-Friendly · R+10
- County
- — inherits STATE
- City
- — inherits STATE
ZIP-level market 63469
- Home prices YoY
- 2.4%
- Active inventory
- 2
- Price-to-rent
- 4.9×
Monthly cashflow live
- Estimated rent
- $1,162 medium interval (Pro) →
- Mortgage (P&I)
- −$362
- Tax from tax record
- −$15 /mo · $185/yr
- Insurance
- −$29
- HOA
- −$0
- Vacancy / Maint / Mgmt
- −$244
- Net cashflow
- $512
Break-even live
UW: 25.0% down · 7.5% · 30yr · 1.5% tax · 5.0% vac · 8.0% maint · 8.0% mgmt
Financing live
Cash to close
- Down payment
- $17,250
- Closing costs
- $2,070
- Reserves months
- —
- Total cash needed
- —
Loan-product check · same deal, 3 products live
Conventional
25% down · 7.5% · 30yr
- Down + closing
- —
- Monthly P&I
- —
- Monthly cashflow
- —
- DSCR
- —
- Eligible?
- —
Personal DTI + credit; lowest rate.
DSCR
20% down · 8.5% · 30yr
- Down + closing
- —
- Monthly P&I
- —
- Monthly cashflow
- —
- DSCR
- —
- Eligible?
- —
No personal income docs; deal must DSCR.
Hard money
10% down · 12.0% · 12mo
- Down + closing
- —
- Monthly P&I
- —
- Monthly cashflow
- —
- DSCR
- —
- Eligible?
- —
Short-term bridge; refi at stabilization.
Listing history 3 events
-
2026-06-18days on market $69,000 Active 2 DOM
-
2026-06-17remarks 687-char remark
-
2026-06-17$69,000 Active 1 DOM
ⓘ Source: listings_history table (triggers on properties + properties_extension) + one-shot
backfill from property_details.listing_events for pre-trigger history.
Tax reassessment forecast MO · Resets to sale price
- Current annual tax
- $185 · $15/mo
- Projected year-2 tax
- $669 · $56/mo
- Expected delta
- +$484/yr (+$40/mo · 261.3%)
ⓘ Screening estimate from a state-policy table — verify with the county assessor before closing.
Climate risk First Street
- Flood 1/10 Low FEMA zone X (unshaded) · 0% chance over 30 yrs
- Wildfire 1/10 Low
- Heat 4/10 Moderate 7 d/yr ≥106°F today · 17 d/yr by 30 yrs out
- Wind 2/10 Low
- Air quality 2/10 Low 1 unhealthy d/yr today · 1 by 30 yrs out
Nearby sold comps map
Loading sold comps map…
Walkable amenities ~0.75 mi
Loading nearby amenities…
Taxation est. · year 1
- Rental income
- $13,941
- − Mortgage interest
- −$3,865
- − Property taxes
- −$185
- − Insurance
- −$345
- − Repairs & maintenance
- −$1,115
- − Management
- −$1,115
- − Depreciation
- −$2,007
- Taxable income
- $5,308
- Est. tax owed @ 24.0%
- −$1,274
- After-tax cash flow
- $4,867/yr
For passive investors: Depreciation is non-cash, so a rental often shows a tax loss while cash-flowing — sheltering income. Rental losses are passive: they offset passive income freely, and up to $25,000/yr can offset ordinary (W-2) income if you actively participate and your MAGI is under $100k (phasing out to $0 by $150k); unused losses carry forward. On sale, claimed depreciation is recaptured at up to 25%, and gains may owe capital-gains tax (a 1031 exchange can defer both). Figures are a year-1 estimate at your 24.0% rate — not tax advice; consult a CPA.
Schools (NCES district)
- District
- North Shelby
- NCES district ID
- 2928140
- Math proficiency
- 65% ▬ 0.00%
- Reading proficiency
- 60% ▼ -5.00%
- Median HH income
- $43,948
- Composite
- 54.09/100
- National rank
- #2984
- State rank
- #31 of 535 in MO
Livability — Shelbyville
- Score
- 60/100
- State rank
- #500
- US rank
- #19317
Category grades
Schools grade is shown separately in the Schools card above.
Census & demographics
- Census place
- Shelbyville, MO
- Population (ZIP)
- 853
Population outlook (Shelby County) Hauer SSP2
- Today (2025)
- 5,663 people
- By 2030
- 5,352 · -5.5%
- By 2040
- 4,762 · -15.9%
- By 2050
- 4,200 · -25.8%
- By 2075
- 3,058 · -46.0%
- By 2100
- 2,166 · -61.8%
Race, ethnicity, and origin ACS 2023
- Neighborhood character
- Predominantly White (95%)
- Race & ethnicity
- White 95% Two or more races 4% Hispanic / Latino 1% Black 1%
- Common ancestry
- Lithuanian 2% Slovak 1% Polish 1%
Political lean MEDSL · Shelby
- 2024 margin
- Solid R (+65.6) · D 16.9% · R 82.5%
- 2008→2024 swing
- -33.9pp toward R · 2008: -31.7pp · 2024: -65.6pp
- All cycles
- 2024: R+65.6 2020: R+62.9 2016: R+59.0 2012: R+37.8 2008: R+31.7
Not yet ingested
- Civics
- —
Market trends
- HPI YoY
- ▲ 7.73%
- Current HPI
- 335.1988
- Rent YoY
- —
- Metro
- —
- State GDP YoY
- ▲ 1.84%
- F500 in state
- 20
Industry mix (Fortune 500 HQ in MO)
| Industry | F500 HQs | Revenue |
|---|---|---|
| Healthcare | 1 | $163B |
|
||
| Insurance | 1 | $21B |
|
||
| Industrial Technology | 1 | $17B |
|
||
| Retail | 1 | $16B |
|
||
| Industrial Distribution | 1 | $10B |
|
||
| Utilities | 1 | $9B |
|
||
Price history
1 event — show timeline
- 2026-06-16 Listed $69,000 MARIS as Distributed by MLS Grid
Property tax history
+1.7%/yrLatest (2025): $185 · +6.5% YoY. Source: county tax records.
Cash-flow waterfall
monthlySold comps — $/sqft
last 12 mo · ≤1 miLoading sold comps…