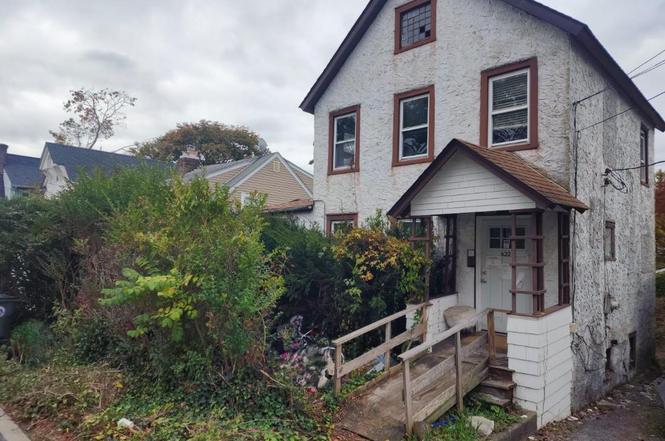
622 2nd St · Mamaroneck, NY
Flood risk 5/10 · Moderate
- FEMA flood zone
- X (shaded)
- Chance of flooding over 30 yrs
- 0.47%
- Est. flood insurance / yr
- $473 – $860
Fire risk 3/10 · Minor
- Est. fire insurance / yr
- $691 – $1,283
Heat risk 6/10 · Moderate
- Hot days now (above 98°F)
- 7 days/yr
- Hot days in 30 yrs
- 16 days/yr
Wind risk 6/10 · Moderate
- Chance of severe wind over 30 yrs
- 27.0%
Air-quality risk 4/10 · Minor
- Unhealthy air days now
- 5 days/yr
- Unhealthy air days in 30 yrs
- 7 days/yr
Risk factors via First Street. Map © Google.
Why this score? — see what drove the B grade
The composite is a weighted blend of 9 inputs, each scored 0–100. Each bar is that input's sub-score; the figure is the points it added to the 100-point composite (weight × sub-score).
- Cash flow +30.0/30.0
- 1% rule +10.0/10.0
- DSCR +10.0/10.0
- ARV discount +7.5/15.0
- Schools +7.3/10.0
- Rent growth +4.2/5.0
- Livability +3.5/5.0
- Condition / age +2.5/5.0
- Appreciation +0.0/10.0
$275,000
🖨 Deal sheet 📄 Offer letter ✓ Due diligence
Listing remarks
Opportunity knocks with this small home in need of a full renovation — the perfect blank canvas for investors, builders, or anyone looking to create their dream space from the ground up. Tucked in a desirable neighborhood close to town, this property offers unbeatable convenience just minutes from shops, restaurants, schools, and major commuting routes. Set on a manageable lot, the home provides a great footprint to reimagine and modernize to your taste. Whether you’re planning a full-scale remodel or a thoughtful rebuild, the location ensures long-term value and strong upside potential. Homes in this area rarely come available at this price point — seize the chance to tur
Key facts
- 4,473 sq ft lot
- Garage
- Built 1935
Neighborhood map
What this means for you Summary
Snapshot
- This is a 3-bed/1.0-bath single-family listed at $275k.
Deal economics
- At list price, monthly cash flow is $1k ($17k/yr) — positive.
- The deal already cash-flows at list — no discount required.
- Meets the 1% rule at list price ($4k rent vs $275k).
- Recommended offer: $250k (9.0% below list) — sets the bar for market timing.
- Cap rate 12.6% vs local median 3.1% in Mamaroneck — top-decile yield for the area; either an underpriced asset or a hidden risk that comps aren't pricing in. Stress-test before assuming the spread holds.
Location & tenants
- Location reads 69/100 on livability (#491 in NY) — a middle-class / working-renter tenant base. Strengths: crime A+, employment A+; Watch: amenities C-, commute F, cost of living F.
- Rye Neck Union Free School District (suburban): math 78% / reading 84% proficiency, ranked #40 of 590 in NY (top 7%) — strong family-tenant draw, lease renewals of 3-5y typical; only 10% free/reduced lunch — higher-income household profile.
- Zoned schools: Daniel Warren Elementary School (320 students, 12% FRL); Rye Neck Middle School (math 73% / reading 83%, grade A+, #37 of 729 statewide, top 5%, 351 students, 16% FRL); Rye Neck Senior High School (math 98% / reading 98%, grade A+, #19 of 1,100 statewide, top 4%, 515 students, 16% FRL).
- Market conditions: Rents rising fast (+6.7%/yr); 124 active listings in the ZIP; 22 comparable units currently listed for rent nearby; rentals at typical pace (median 25d on market — plan ~3-4 weeks tenant-placement turnaround); 45% of comp listings sitting > 30 days — soft ceiling on asking rent; high-income renter base; 954 units permitted in Westchester County in 2024 (649 in 5+ unit buildings).
- This rent runs 42% of the median local income ($126k/yr) — at the standard rent-burdened threshold; future hikes will face affordability resistance.
Forward outlook
- Local home prices are declining (-3.0%/yr); year-one equity from $2k of loan paydown is wiped out by about $8k of value loss. Plan a longer hold.
- Westchester County population projected at +10% by 2050 — modest demand growth; plan on rents tracking national, not racing it.
- At projected returns (-3.0% appreciation + 6.7% rent growth), your $77k cash investment doubles in ~5 years — after that, you're playing with house money.
Negotiation context
- It's been on market 119 days — a 9% lower offer ($250k) is reasonable based on typical stale-listing flexibility.
Risks & watch-outs
- Watch-outs: built in 1935 — expect roof / HVAC / electrical / plumbing capex.
- Climate carrying-cost: moderate flood risk; major wind risk, 27% chance of damaging wind over 30y; extreme-heat days projected 7→16/yr by 2055 (HVAC capex compounding) — expect insurance premiums to compound above CPI over the hold.
Questions for the listing agent
- It's been on market 119 days. Have you received any prior offers? Is the seller open to a 9% concession, seller financing, or rate buy-down credit?
- Built in 1935 — when were the roof, HVAC, electrical panel, plumbing, and water heater last replaced?
- Why hasn't it sold? Are there any deal-killer items the seller is aware of (foundation, flood, title, zoning, code violations)?
- Is there a deadline driving the sale (1031 exchange, divorce, estate, relocation)? That informs how much negotiation room exists.
- Schools are B-rated — typically a magnet for longer-tenancy family renters. What's the average tenant stay here, and is there a school-zone premium baked into asking?
- What's the average days-on-market for RENTAL listings here right now (not sales)? A rising rental-DOM trend means longer vacancies and softer asking-rent achievability than the comps imply.
- What's the recent tenant-quality profile in this submarket — average credit score on applications, eviction rate, late-payment / NSF rate, and stable-employment percentage? A property-management company in the area should have these aggregated.
- How much new for-sale + rental construction is in the pipeline within 1–3 miles? Heavy new supply typically softens prices + rents 12–24 months out; constrained supply supports both.
Investment metrics
- 1% rule
- 1.63% ✓
- Cap rate
- 12.60%
- Cash-on-cash
- 22.52%
- DSCR
- 2.00
- GRM
- 5.1
CMA / ARV
- ARV (on-the-fly)
- $697,368
- Comps found
- 11
Show comp detail 11 sales within ~0.75 mi
| Address | Dist | Beds/Ba | Sqft | Sold | Price | $/sf | Match |
|---|---|---|---|---|---|---|---|
| 410 Hunter St | 0.54mi | 3/2.0 | 1,196 (+2%) | 9mo | $790,000 | $661 | 61 |
| 1311 Henry Ave | 0.56mi | 2/1.5 (-1) | 1,227 (+4%) | 0mo | $790,000 | $644 | 59 |
| 651 Plaza Ave | 0.70mi | 3/1.0 | 1,232 (+5%) | 6mo | $500,000 | $406 | 54 |
| 1676 Mamaroneck Ave | 0.58mi | 3/1.0 | 1,269 (+8%) | 9mo | $640,000 | $504 | 52 |
| 604 Hampshire Rd | 0.28mi | 4/1.0 (+1) | 1,350 (+15%) | 8mo | $775,000 | $574 | 51 |
| 1116 Park Ave | 0.45mi | 3/1.0 | 1,340 (+14%) | 10mo | $830,000 | $619 | 48 |
| 425 4th St | 0.50mi | 2/1.0 (-1) | 1,078 (-8%) | 22mo | $643,000 | $596 | 40 |
| 148 Frank Ave | 0.59mi | 2/2.0 (-1) | 1,316 (+12%) | 12mo | $780,000 | $593 | 34 |
| 227 Madison St | 0.64mi | 2/1.0 (-1) | 1,000 (-15%) | 15mo | $530,000 | $530 | 28 |
| 126 Florence St | 0.67mi | 2/1.5 (-1) | 1,008 (-14%) | 18mo | $520,000 | $516 | 23 |
| 17 Adelphi Ave | 0.67mi | 3/2.0 | 1,344 (+14%) | 22mo | $882,500 | $657 | 23 |
Match score weights: distance 35% · size 25% · config 20% · recency 20%. Top-matched comps best support the ARV.
Projected returns pro-forma
-3.0% appreciation · 6.7% rent growth · sell at horizon
- IRR
- 19.7%
- Equity multiple
- 1.84×
- Total profit
- $64,942
- Equity at exit
- $41,003
- IRR
- 30.6%
- Equity multiple
- 4.28×
- Total profit
- $252,324
- Equity at exit
- $23,777
Cash invested: $77,000 (down + closing). Projections, not guarantees.
Landlord ↔ Tenant lean methodology
- Overall (STATE)
- 15 Strongly Tenant-Friendly
- State New York
- 15 Strongly Tenant-Friendly · D+10
- County
- — inherits STATE
- City
- — inherits STATE
ZIP-level market 10543
- Rents YoY
- 6.7%
- Active inventory
- 124
- Price-to-rent
- 5.1×
Monthly cashflow live
- Estimated rent
- $4,474 high interval (Pro) →
- Mortgage (P&I)
- −$1,442
- Tax from tax record
- −$533 /mo · $6,393/yr
- Insurance
- −$115
- HOA
- −$0
- Vacancy / Maint / Mgmt
- −$940
- Net cashflow
- $1,445
Break-even live
UW: 25.0% down · 7.5% · 30yr · 1.5% tax · 5.0% vac · 8.0% maint · 8.0% mgmt
Financing live
Cash to close
- Down payment
- $68,750
- Closing costs
- $8,250
- Reserves months
- —
- Total cash needed
- —
Loan-product check · same deal, 3 products live
Conventional
25% down · 7.5% · 30yr
- Down + closing
- —
- Monthly P&I
- —
- Monthly cashflow
- —
- DSCR
- —
- Eligible?
- —
Personal DTI + credit; lowest rate.
DSCR
20% down · 8.5% · 30yr
- Down + closing
- —
- Monthly P&I
- —
- Monthly cashflow
- —
- DSCR
- —
- Eligible?
- —
No personal income docs; deal must DSCR.
Hard money
10% down · 12.0% · 12mo
- Down + closing
- —
- Monthly P&I
- —
- Monthly cashflow
- —
- DSCR
- —
- Eligible?
- —
Short-term bridge; refi at stabilization.
Rent comps 22 comps
| Address | Beds | Baths | Sqft | Rent | $/sqft | DOM | Units | Dist |
|---|---|---|---|---|---|---|---|---|
| 1016 Jefferson Ave Mamaroneck, NY | 3.0 | 1.5 | 1300 | $4,200 | $3.23 | 18d | 1 | 0.30mi |
| 746 Mamaroneck Ave Mamaroneck, NY | 1.0–2.0 | 1.0–2.0 | 974 | $6,015 | $6.17 | 1d | 16 | 0.43mi |
| 209 Halstead Ave Unit 3 Mamaroneck, NY | 3.0 | 1.0 | 1500 | $3,975 | $2.65 | 43d | 1 | 0.52mi |
| 1408 Henry Ave #1 Mamaroneck, NY | 2.0 | 1.0 | 850 | $3,200 | $3.76 | 43d | 1 | 0.59mi |
| 1408 Henry Ave #2 Mamaroneck, NY | 3.0 | 1.5 | 1400 | $4,200 | $3.00 | 43d | 1 | 0.59mi |
| 14 Fremont St Unit 1 Harrison, NY | 3.0 | 2.0 | 1500 | $4,300 | $2.87 | 7d | 1 | 0.63mi |
| 210 Union Ave Mamaroneck, NY | 3.0 | 1.5 | 1000 | $3,500 | $3.50 | 24d | 1 | 0.65mi |
| 416 Tompkins Ave Unit SECOND FLOOR Mamaroneck, NY | 2.0 | 1.0 | 1100 | $3,800 | $3.45 | 43d | 1 | 0.65mi |
| 29 Fremont St Unit B Harrison, NY | 3.0 | 2.0 | 1330 | $4,500 | $3.38 | 43d | 1 | 0.66mi |
| 338 Palmer Ave Unit B Mamaroneck, NY | 2.0 | 1.0 | 900 | $3,700 | $4.11 | 24d | 1 | 0.82mi |
| 132 Halstead Ave Unit 2B Harrison, NY | 2.0 | 2.0 | 1132 | $5,500 | $4.86 | 43d | 1 | 0.85mi |
| 132 Halstead Ave Unit 4D Harrison, NY | 3.0 | 2.5 | 1329 | $6,850 | $5.15 | 43d | 1 | 0.85mi |
| 53 Rose Ave Unit 2 Harrison, NY | 3.0 | 1.0 | 1000 | $3,300 | $3.30 | 24d | 1 | 0.86mi |
| 8 Marion Ave #6 Harrison, NY | 3.0 | 2.5 | 1420 | $6,400 | $4.51 | 4d | 1 | 0.92mi |
| 135 Webster Ave Harrison, NY | 3.0 | 1.0 | 1500 | $3,300 | $2.20 | 18d | 1 | 0.97mi |
| 505 Prospect Ave Mamaroneck, NY | 3.0 | 1.5 | 1500 | $6,700 | $4.47 | 13d | 1 | 0.98mi |
| 97 Crotona Ave Unit 1 Harrison, NY | 3.0 | 1.0 | 1000 | $3,900 | $3.90 | 43d | 1 | 1.07mi |
| 52 Nelson Ave Unit 2 Harrison, NY | 3.0 | 1.5 | 1450 | $4,000 | $2.76 | 18d | 1 | 1.17mi |
| 74 Nelson Ave Apt 4 Harrison, NY | 2.0 | 1.0 | 914 | $4,500 | $4.92 | 43d | 1 | 1.21mi |
| 74 Nelson Ave Apt 1 Harrison, NY | 2.0 | 1.0 | 900 | $4,000 | $4.44 | 43d | 1 | 1.21mi |
| 48 Oakland Ave Harrison, NY | 2.0 | 1.0 | 1000 | $3,000 | $3.00 | 24d | 1 | 1.32mi |
| 332 Halstead Ave Harrison, NY | 1.0–3.0 | 1.0–3.0 | 1116 | $6,805 | $6.09 | 1d | 1 | 1.38mi |
Listing history 2 events
-
2026-03-11status Pending
-
2025-11-12$275,000 Active
ⓘ Source: listings_history table (triggers on properties + properties_extension) + one-shot
backfill from property_details.listing_events for pre-trigger history.
Tax reassessment forecast NY · Partial reset (capped growth)
- Current annual tax
- $6,393 · $533/mo
- Projected year-2 tax
- $6,393 · $533/mo
- Expected delta
- $0/yr ($0/mo · 0.0%)
ⓘ Screening estimate from a state-policy table — verify with the county assessor before closing.
Climate risk First Street
- Flood 5/10 Major FEMA zone X (shaded) · 47% chance over 30 yrs
- Wildfire 3/10 Moderate
- Heat 6/10 Major 7 d/yr ≥98°F today · 16 d/yr by 30 yrs out
- Wind 6/10 Major 27% chance of damaging wind over 30 yrs
- Air quality 4/10 Moderate 5 unhealthy d/yr today · 7 by 30 yrs out
Nearby sold comps map
Loading sold comps map…
Walkable amenities ~0.75 mi
Loading nearby amenities…
Taxation est. · year 1
- Rental income
- $53,691
- − Mortgage interest
- −$15,404
- − Property taxes
- −$6,393
- − Insurance
- −$1,375
- − Repairs & maintenance
- −$4,295
- − Management
- −$4,295
- − Depreciation
- −$8,000
- Taxable income
- $13,928
- Est. tax owed @ 24.0%
- −$3,343
- After-tax cash flow
- $14,000/yr
For passive investors: Depreciation is non-cash, so a rental often shows a tax loss while cash-flowing — sheltering income. Rental losses are passive: they offset passive income freely, and up to $25,000/yr can offset ordinary (W-2) income if you actively participate and your MAGI is under $100k (phasing out to $0 by $150k); unused losses carry forward. On sale, claimed depreciation is recaptured at up to 25%, and gains may owe capital-gains tax (a 1031 exchange can defer both). Figures are a year-1 estimate at your 24.0% rate — not tax advice; consult a CPA.
Schools (NCES district)
- District
- Rye Neck Union Free School District
- NCES district ID
- 3625290
- Math proficiency
- 78% ▬ 0.00%
- Reading proficiency
- 84% ▲ 12.00%
- Median HH income
- $99,235
- Composite
- 73.17/100
- National rank
- #188
- State rank
- #40 of 590 in NY
Livability — Mamaroneck
- Score
- 69/100
- State rank
- #491
- US rank
- #8656
Category grades
Schools grade is shown separately in the Schools card above.
Census & demographics
- Census place
- Mamaroneck, NY
- County
- Westchester County · 709,332 people
- City population
- 20,989
- Metro
- New York-Newark-Jersey City, NY-NJ-PA
- Population (ZIP)
- 20,989
- Household income
- $126,417
- Rent vs Own
- Severe rent burden
- 1152.0
Population outlook (Westchester County) Hauer SSP2
- Today (2025)
- 1,028,035 people
- By 2030
- 1,051,636 · +2.3%
- By 2040
- 1,098,520 · +6.9%
- By 2050
- 1,136,044 · +10.5%
- By 2075
- 1,196,925 · +16.4%
- By 2100
- 1,175,147 · +14.3%
Race, ethnicity, and origin ACS 2023
- Neighborhood character
- Diverse neighborhood (Simpson 0.57)
- Race & ethnicity
- White 59% Hispanic / Latino 27% Two or more races 11% Asian 5% Black 4% Native American 1%
- Hispanic origin (detail)
- Mexican 5% Puerto Rican 4% Dominican 2%
- Common ancestry
- Russian 3% Romanian 2% Scotch-Irish 2%
- Foreign-born
- 28% · Canada, Jamaica, China
- Languages at home
- 60% English-only · Spanish 23% Other Indo-European 8% Other Asian/Pacific 2%
Political lean MEDSL · Westchester
- 2024 margin
- Strong D (+26.3) · D 63.1% · R 36.9%
- 2008→2024 swing
- -1.3pp toward R · 2008: 27.6pp · 2024: 26.3pp
- All cycles
- 2024: D+26.3 2020: D+36.3 2016: D+32.8 2012: D+22.2 2008: D+27.6
Not yet ingested
- Civics
- —
Market trends
- HPI YoY
- ▼ -220.53%
- Current HPI
- 268.4687
- Rent YoY
- ▲ 6.70%
- Metro
- New York-Newark-Jersey City, NY-NJ-PA
- State GDP YoY
- ▲ 2.60%
- F500 in state
- 92
Industry mix (Fortune 500 HQ in NY)
| Industry | F500 HQs | Revenue |
|---|---|---|
| Financial Services | 10 | $950B |
|
||
| Consumer Goods | 9 | $162B |
|
||
| Insurance | 4 | $225B |
|
||
| Telecommunications | 2 | $144B |
|
||
| Pharmaceuticals | 2 | $112B |
|
||
| Media / Entertainment | 2 | $69B |
|
||
Price history
2 events — show timeline
- 2026-03-11 Pending — OneKey® MLS as Distributed by MLS Grid
- 2025-11-12 Listed $275,000 OneKey® MLS as Distributed by MLS Grid
Property tax history
+2.6%/yrLatest (2025): $6,393 · -30.2% YoY. Source: county tax records.
Cash-flow waterfall
monthlySold comps — $/sqft
last 12 mo · ≤1 miLoading sold comps…