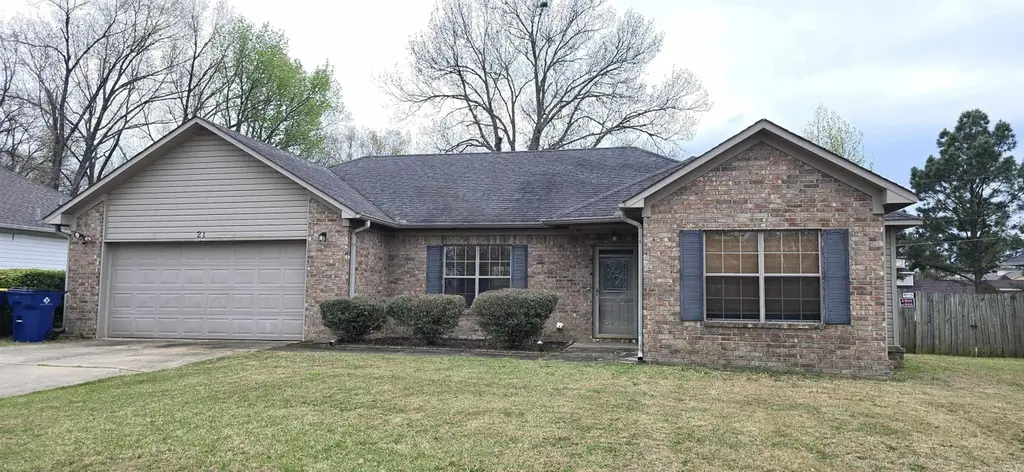
21 Winners Cir · Cabot, AR
Flood risk 1/10 · Minimal
- FEMA flood zone
- X (unshaded)
- Chance of flooding over 30 yrs
- 0.0%
- Est. flood insurance / yr
- $507 – $1,088
Fire risk 4/10 · Minor
- Est. fire insurance / yr
- $1,499 – $2,785
Heat risk 7/10 · Major
- Hot days now (above 109°F)
- 7 days/yr
- Hot days in 30 yrs
- 19 days/yr
Wind risk 3/10 · Minor
- Chance of severe wind over 30 yrs
- 7.0%
Air-quality risk 2/10 · Minimal
- Unhealthy air days now
- 1 days/yr
- Unhealthy air days in 30 yrs
- 1 days/yr
Risk factors via First Street. Map © Google.
Why this score? — see what drove the D- grade
The composite is a weighted blend of 9 inputs, each scored 0–100. Each bar is that input's sub-score; the figure is the points it added to the 100-point composite (weight × sub-score).
- Cash flow +12.5/30.0
- ARV discount +6.6/15.0
- Schools +4.0/10.0
- Livability +3.9/5.0
- DSCR +3.7/10.0
- Rent growth +3.3/5.0
- 1% rule +2.7/10.0
- Condition / age +2.5/5.0
- Appreciation +0.0/10.0
$210,000
🖨 Deal sheet 📄 Offer letter ✓ Due diligence
Listing remarks
MUST SEE! Beautiful 4 bedroom/2 bathroom All Electric home in Cabot. NEW ROOF. Near community Park with ponds, trails, playgrounds, and more. Convenient to Everything. Kitchen is furnished with stainless steel appliances including Fridge, stove, microwave, dishwasher, and disposal. Electric fireplace. Carpet and tile floors throughout. Jetted tub and walk in shower. Walk in closet. Fenced backyard with large patio. 2 car garage.
Key facts
- Jetted tub
- Walk in closet
- Electric fireplace
Tags
Property features AI
Finance
- Financial info: Accepts VA, FHA, conventional loans, or cash
Exterior
- Parking: Attached garage for 2 cars
- Security: Smoke detectors
- Utilities: Public water; Municipal electric service (Entergy)
- Home design: Brick and frame combination exterior
- Construction: Slab foundation; 3-tab shingle roof
- Exterior features: Patio; Fully fenced yard; Wood fence with guttering; Paved road access; Level lot in a subdivision; Inside city limits
Interior
- Kitchen: Free-standing stove; Electric range; Microwave; Dishwasher; Disposal; Pantry; Refrigerator stays
- Bedrooms: Walk-in closet(s) (primary and/or other bedrooms)
- Flooring: Carpet; Tile
- Bathrooms: 2 full bathrooms
- Heating & cooling: Central electric heating; Central electric cooling
- Interior features: Washer connection; Dryer connection (electric); Electric water heater; Smoke detectors; Window treatments; Walk-in closets; Ceiling fans; Walk-in shower; Corian kitchen countertops; Wood-burning prefabricated fireplace with gas logs; Carpet flooring; Tile flooring; Sheetrock walls and ceilings; Tray ceiling
- Laundry & utility: Laundry area with washer and dryer connections
Neighborhood map
What this means for you Summary
Snapshot
- This is a 4-bed/2.0-bath single-family listed at $210k.
Deal economics
- At list price, monthly cash flow is $-32 ($-389/yr) — negative.
- To cash-flow at today's rent, offer at most $204k (2.7% below list).
- To meet the 1% rule (rent ≥ 1% of price), the offer needs to be $161k (23.5% below list).
- Recommended offer: $161k (23.5% below list) — sets the bar for 1% rule.
- Cap rate 6.1% vs local median 4.6% in Cabot — top-decile yield for the area; either an underpriced asset or a hidden risk that comps aren't pricing in. Stress-test before assuming the spread holds.
Location & tenants
- Location reads 78/100 on livability (#6 in AR, #2,695 nationally) — a middle-class / working-renter tenant base. Strengths: cost of living A+, housing A+, health & safety A+; Watch: commute F.
- Cabot School District (suburban): math 48% / reading 43% proficiency, ranked #29 of 238 in AR (top 12%) — families likely to look elsewhere, expect single-tenant / working-renter base with shorter leases.
- Market conditions: Rents rising (+3.2%/yr); 334 active listings in the ZIP; 7 comparable units currently listed for rent nearby; rentals at typical pace (median 24d on market — plan ~3-4 weeks tenant-placement turnaround); solid renter incomes; 185 units permitted in Lonoke County in 2024 (0 in 5+ unit buildings).
Forward outlook
- Local home prices are declining (-3.0%/yr); year-one equity from $1k of loan paydown is wiped out by about $6k of value loss. Plan a longer hold.
- Lonoke County population projected at +12% by 2050 — modest demand growth; plan on rents tracking national, not racing it.
Negotiation context
- It's been on market 49 days — a 3% lower offer ($204k) is reasonable based on typical stale-listing flexibility.
- 2 sale attempts with the ask held roughly flat each time — persistent listings suggest the price (not the market) is what's stuck; bring a comps-based counter.
Risks & watch-outs
- Climate carrying-cost: extreme-heat days projected 7→19/yr by 2055 (HVAC capex compounding) — expect insurance premiums to compound above CPI over the hold.
Questions for the listing agent
- What do current leases actually rent for vs. the listed asking? Can we see a recent rent roll and the last 12 months of T-12 income?
- It's been on market 49 days. Have you received any prior offers? Is the seller open to a 23% concession, seller financing, or rate buy-down credit?
- Is there a deadline driving the sale (1031 exchange, divorce, estate, relocation)? That informs how much negotiation room exists.
- The area grade is low — what's the realistic commute time and amenity access for the typical tenant pool here? Any planned neighborhood developments (good or bad) we should know about?
- What's the average days-on-market for RENTAL listings here right now (not sales)? A rising rental-DOM trend means longer vacancies and softer asking-rent achievability than the comps imply.
- What's the recent tenant-quality profile in this submarket — average credit score on applications, eviction rate, late-payment / NSF rate, and stable-employment percentage? A property-management company in the area should have these aggregated.
- How much new for-sale + rental construction is in the pipeline within 1–3 miles? Heavy new supply typically softens prices + rents 12–24 months out; constrained supply supports both.
Investment metrics
- 1% rule
- 0.77% ✗
- Cap rate
- 6.11%
- Cash-on-cash
- -0.66%
- DSCR
- 0.97
- GRM
- 10.9
CMA / ARV
- ARV (on-the-fly)
- $205,920
- Comps found
- 12
Show comp detail 12 sales within ~0.75 mi
| Address | Dist | Beds/Ba | Sqft | Sold | Price | $/sf | Match |
|---|---|---|---|---|---|---|---|
| 10 Winners Cir | 0.08mi | 3/2.0 (-1) | 1,464 (+2%) | 10mo | $235,000 | $161 | 79 |
| 41 Winners Cir | 0.14mi | 3/2.0 (-1) | 1,425 (-0%) | 12mo | $214,999 | $151 | 78 |
| 45 Winners Cir | 0.17mi | 3/2.0 (-1) | 1,535 (+7%) | 1mo | $238,750 | $156 | 74 |
| 42 Winners Cir | 0.17mi | 3/2.0 (-1) | 1,521 (+6%) | 11mo | $196,500 | $129 | 67 |
| 502 Southaven Ave | 0.54mi | 3/2.0 (-1) | 1,456 (+2%) | 15mo | $200,000 | $137 | 54 |
| 17 Dale Ct | 0.48mi | 3/2.0 (-1) | 1,538 (+8%) | 12mo | $210,000 | $137 | 49 |
| 11 Chad Ct | 0.68mi | 3/2.0 (-1) | 1,464 (+2%) | 12mo | $165,000 | $113 | 49 |
| 431 Nottingham Dr | 0.67mi | 4/2.0 | 1,559 (+9%) | 10mo | $224,900 | $144 | 45 |
| 12 Gail Ct | 0.51mi | 3/2.0 (-1) | 1,641 (+15%) | 12mo | $245,000 | $149 | 37 |
| 23 Warren St | 0.69mi | 3/2.0 (-1) | 1,605 (+12%) | 8mo | $249,000 | $155 | 35 |
| 470 Nottingham Cir | 0.71mi | 4/2.0 | 1,609 (+12%) | 14mo | $216,000 | $134 | 34 |
| 16 Mary Ann Cir | 0.64mi | 3/2.0 (-1) | 1,587 (+11%) | 16mo | $218,800 | $138 | 34 |
Match score weights: distance 35% · size 25% · config 20% · recency 20%. Top-matched comps best support the ARV.
Projected returns pro-forma
-3.0% appreciation · 3.19% rent growth · sell at horizon
- IRR
- -17.2%
- Equity multiple
- 0.39×
- Total profit
- $-35,854
- Equity at exit
- $31,312
- IRR
- -9.0%
- Equity multiple
- 0.44×
- Total profit
- $-32,886
- Equity at exit
- $18,157
Cash invested: $58,800 (down + closing). Projections, not guarantees.
Landlord ↔ Tenant lean methodology
- Overall (STATE)
- 92 Strongly Landlord-Friendly
- State Arkansas
- 92 Strongly Landlord-Friendly · R+14
- County
- — inherits STATE
- City
- — inherits STATE
ZIP-level market 72023
- Home prices YoY
- -13.8%
- Rents YoY
- 3.2%
- Active inventory
- 334
- Price-to-rent
- 10.9×
Monthly cashflow live
- Estimated rent
- $1,607 high interval (Pro) →
- Mortgage (P&I)
- −$1,101
- Tax from tax record
- −$113 /mo · $1,357/yr
- Insurance
- −$88
- HOA
- −$0
- Vacancy / Maint / Mgmt
- −$337
- Net cashflow
- $-32
Break-even live
UW: 25.0% down · 7.5% · 30yr · 1.5% tax · 5.0% vac · 8.0% maint · 8.0% mgmt
Financing live
Cash to close
- Down payment
- $52,500
- Closing costs
- $6,300
- Reserves months
- —
- Total cash needed
- —
Loan-product check · same deal, 3 products live
Conventional
25% down · 7.5% · 30yr
- Down + closing
- —
- Monthly P&I
- —
- Monthly cashflow
- —
- DSCR
- —
- Eligible?
- —
Personal DTI + credit; lowest rate.
DSCR
20% down · 8.5% · 30yr
- Down + closing
- —
- Monthly P&I
- —
- Monthly cashflow
- —
- DSCR
- —
- Eligible?
- —
No personal income docs; deal must DSCR.
Hard money
10% down · 12.0% · 12mo
- Down + closing
- —
- Monthly P&I
- —
- Monthly cashflow
- —
- DSCR
- —
- Eligible?
- —
Short-term bridge; refi at stabilization.
Rent comps 7 comps
| Address | Beds | Baths | Sqft | Rent | $/sqft | DOM | Units | Dist |
|---|---|---|---|---|---|---|---|---|
| 33 Ryleigh Cir Cabot, AR | 3.0 | 2.0 | 1333 | $1,350 | $1.01 | 23d | 1 | 0.99mi |
| 35 Pheasant Run Dr Cabot, AR | 3.0 | 1.0 | 1185 | $1,250 | $1.05 | 23d | 1 | 1.04mi |
| 47 Pheasant Run Dr Cabot, AR | 3.0 | 1.0 | 1211 | $1,100 | $0.91 | 14d | 1 | 1.05mi |
| 15 Amy St Cabot, AR | 3.0 | 2.0 | 1687 | $1,800 | $1.07 | 23d | 1 | 1.14mi |
| 13 Pheasant Run Dr Cabot, AR | 3.0 | 1.5 | 1162 | $1,245 | $1.07 | 23d | 1 | 1.20mi |
| 63 Robinson St Cabot, AR | 3.0 | 1.5 | 1008 | $1,350 | $1.34 | 23d | 1 | 1.30mi |
| 13 Buttercup Ln Cabot, AR | 3.0 | 2.0 | 1548 | $1,495 | $0.97 | 23d | 1 | 1.44mi |
Listing history 8 events
-
2026-06-09statusdays on market $210,000 Under Contract 49 DOM
-
2026-06-08days on market $210,000 Back on Market 48 DOM
-
2026-06-07remarks 432-char remark
-
2026-06-07statusdays on market $210,000 Back on Market 47 DOM
-
2026-05-16status Under Contract
-
2026-03-30$210,000 New Listing
-
2025-02-11historical $1,495
-
2025-02-06$1,495
ⓘ Source: listings_history table (triggers on properties + properties_extension) + one-shot
backfill from property_details.listing_events for pre-trigger history.
Tax reassessment forecast AR · Resets to sale price
- Current annual tax
- $1,357 · $113/mo
- Projected year-2 tax
- $1,357 · $113/mo
- Expected delta
- $0/yr ($0/mo · 0.0%)
ⓘ Screening estimate from a state-policy table — verify with the county assessor before closing.
Climate risk First Street
- Flood 1/10 Low FEMA zone X (unshaded) · 0% chance over 30 yrs
- Wildfire 4/10 Moderate
- Heat 7/10 Severe 7 d/yr ≥109°F today · 19 d/yr by 30 yrs out
- Wind 3/10 Moderate 7% chance of damaging wind over 30 yrs
- Air quality 2/10 Low 1 unhealthy d/yr today · 1 by 30 yrs out
Nearby sold comps map
Loading sold comps map…
Walkable amenities ~0.75 mi
Loading nearby amenities…
Taxation est. · year 1
- Rental income
- $19,282
- − Mortgage interest
- −$11,763
- − Property taxes
- −$1,357
- − Insurance
- −$1,050
- − Repairs & maintenance
- −$1,543
- − Management
- −$1,543
- − Depreciation
- −$6,109
- Taxable loss
- −$4,082
- Est. tax savings @ 24.0%
- +$980
- After-tax cash flow
- $591/yr
For passive investors: Depreciation is non-cash, so a rental often shows a tax loss while cash-flowing — sheltering income. Rental losses are passive: they offset passive income freely, and up to $25,000/yr can offset ordinary (W-2) income if you actively participate and your MAGI is under $100k (phasing out to $0 by $150k); unused losses carry forward. On sale, claimed depreciation is recaptured at up to 25%, and gains may owe capital-gains tax (a 1031 exchange can defer both). Figures are a year-1 estimate at your 24.0% rate — not tax advice; consult a CPA.
Schools (NCES district)
- District
- Cabot School District
- NCES district ID
- 0503750
- Math proficiency
- 48% ▼ -14.00%
- Reading proficiency
- 43% ▼ -10.00%
- Median HH income
- $55,993
- Composite
- 39.66/100
- National rank
- #3912
- State rank
- #29 of 238 in AR
Livability — Cabot
- Score
- 78/100
- State rank
- #6
- US rank
- #2695
Category grades
Schools grade is shown separately in the Schools card above.
Census & demographics
- Census place
- Cabot, AR
- County
- Lonoke County · 46,130 people
- City population
- 37,452
- Metro
- Little Rock-North Little Rock-Conway, AR
- Population (ZIP)
- 37,452
- Household income
- $76,931
- Rent vs Own
- Severe rent burden
- 939.0
Population outlook (Lonoke County) Hauer SSP2
- Today (2025)
- 78,072 people
- By 2030
- 80,673 · +3.3%
- By 2040
- 84,977 · +8.8%
- By 2050
- 87,778 · +12.4%
- By 2075
- 91,398 · +17.1%
- By 2100
- 87,858 · +12.5%
Race, ethnicity, and origin ACS 2023
- Neighborhood character
- Predominantly White (85%)
- Race & ethnicity
- White 85% Two or more races 6% Hispanic / Latino 5% Black 4% Asian 2%
- Common ancestry
- Italian 2% Lithuanian 2% Serbian 1%
- Foreign-born
- 3% · Canada, Vietnam
- Languages at home
- 96% English-only · Spanish 2%
Political lean MEDSL · Lonoke
- 2024 margin
- Solid R (+53.7) · D 22.2% · R 75.8% · Other 2.0%
- 2008→2024 swing
- -6.2pp toward R · 2008: -47.5pp · 2024: -53.7pp
- All cycles
- 2024: R+53.7 2020: R+52.8 2016: R+53.3 2012: R+50.9 2008: R+47.5
Not yet ingested
- Civics
- —
Market trends
- HPI YoY
- ▼ -29.12%
- Current HPI
- 182.3489
- Rent YoY
- ▲ 3.19%
- Metro
- Little Rock-North Little Rock-Conway, AR
- State GDP YoY
- ▲ 3.80%
- F500 in state
- 10
Industry mix (Fortune 500 HQ in AR)
| Industry | F500 HQs | Revenue |
|---|---|---|
| Retail | 1 | $681B |
|
||
| Food / Agriculture | 1 | $53B |
|
||
| Retail / Energy | 1 | $22B |
|
||
| Transportation / Logistics | 1 | $12B |
|
||
| Energy | 1 | $4B |
|
||
Price history
+13946.8% since first listed4 events — show timeline
- 2026-05-16 Pending — CARMLS
- 2026-03-30 Listed $210,000 CARMLS
- 2025-02-11 Rental Removed $1,495 CARMLS
- 2025-02-06 Listed for Rent $1,495 CARMLS
Property tax history
+0.4%/yrLatest (2025): $1,357 · +0.0% YoY. Source: county tax records.
Cash-flow waterfall
monthlySold comps — $/sqft
last 12 mo · ≤1 miLoading sold comps…